. 2022 Jun 13;40(6):656-673.e7.
doi: 10.1016/j.ccell.2022.04.011. Epub 2022 May 5.

Mesothelial cell-derived antigen-presenting cancer-associated fibroblasts induce expansion of regulatory T cells in pancreatic cancer

Affiliations

Mesothelial cell-derived antigen-presenting cancer-associated fibroblasts induce expansion of regulatory T cells in pancreatic cancer

Huocong Huang et al. Cancer Cell. .

Abstract

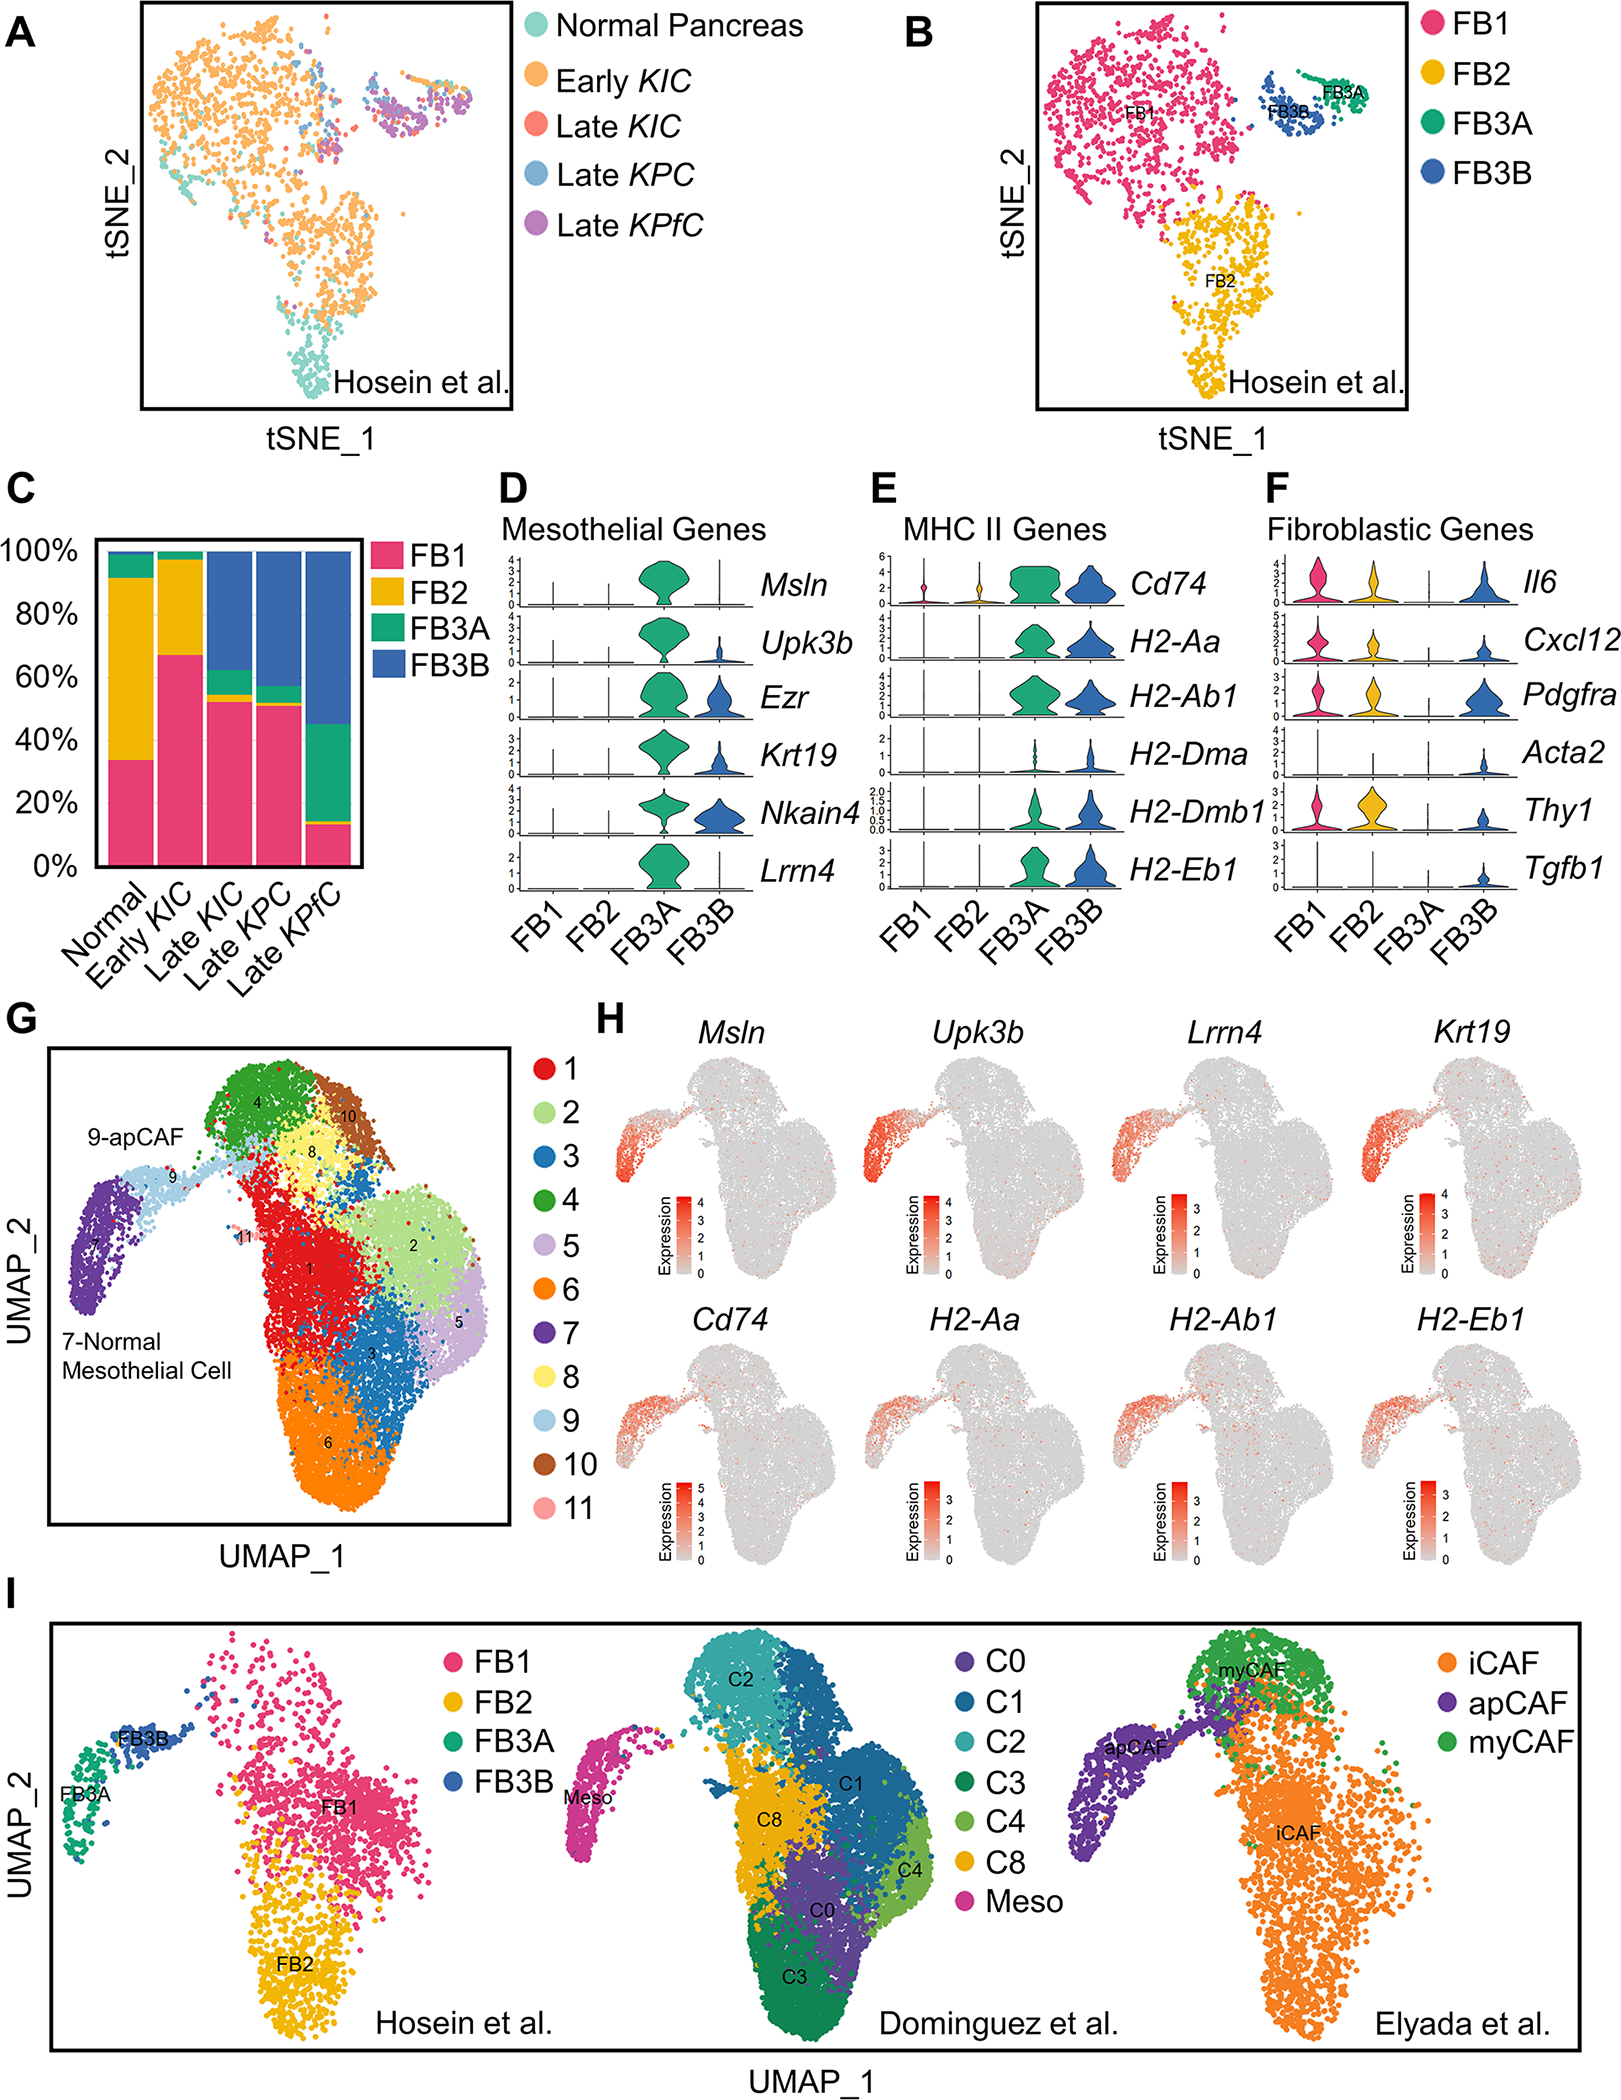
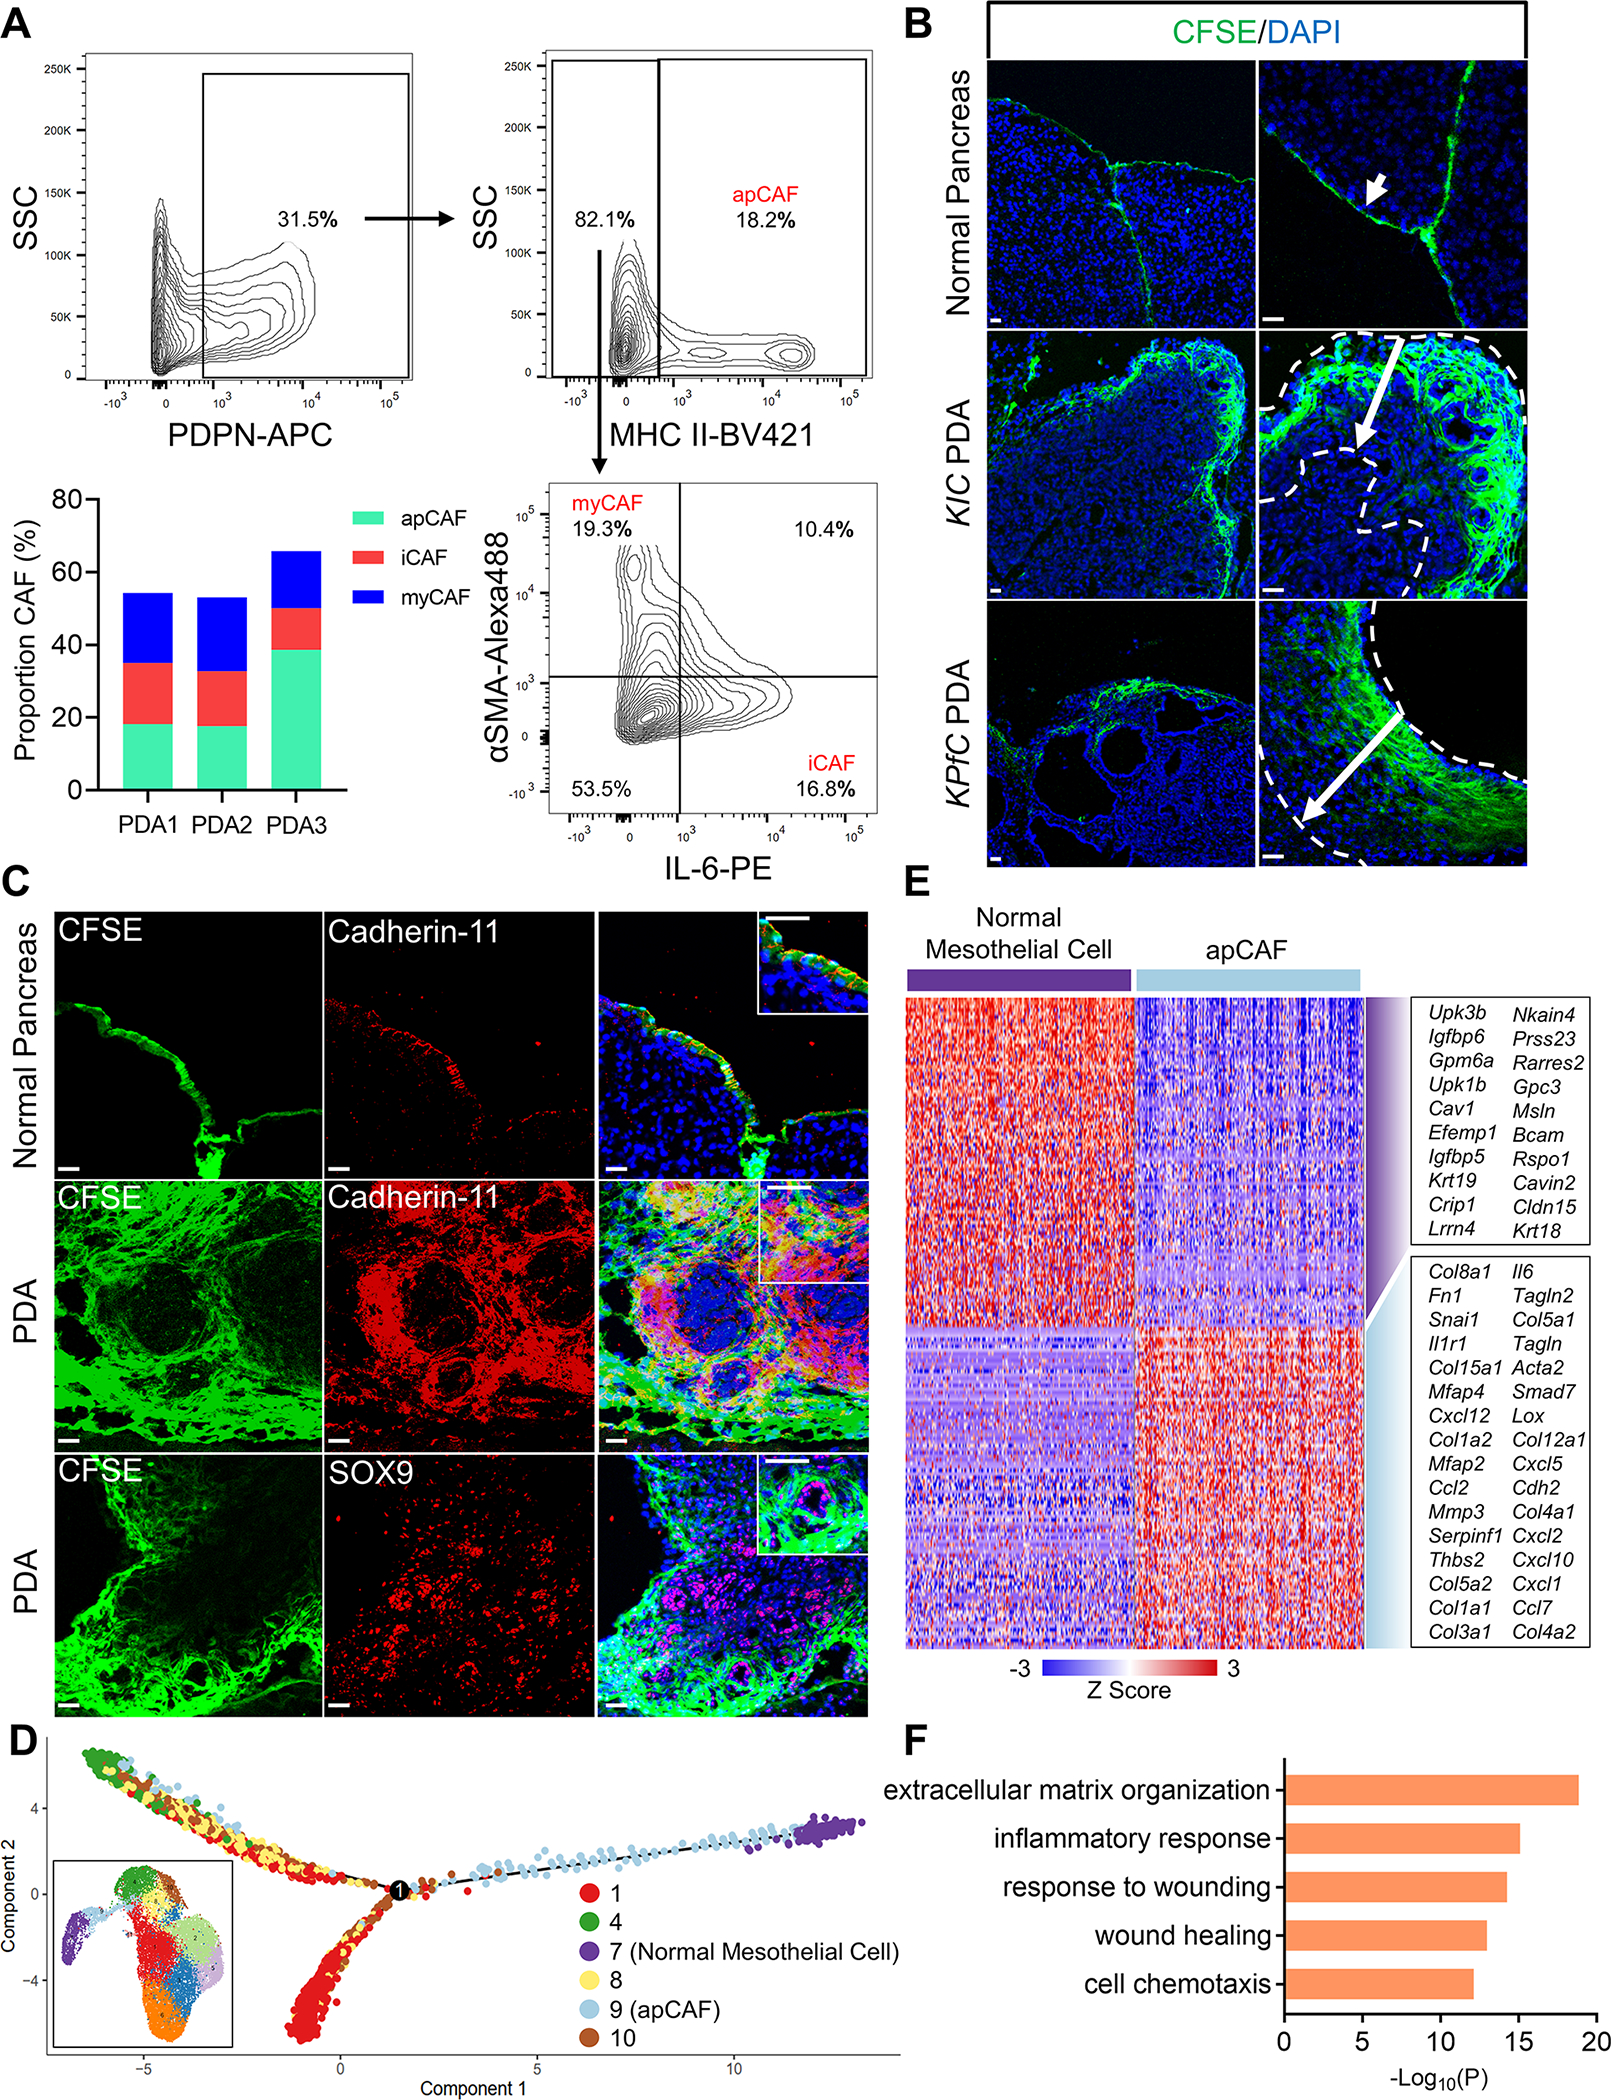
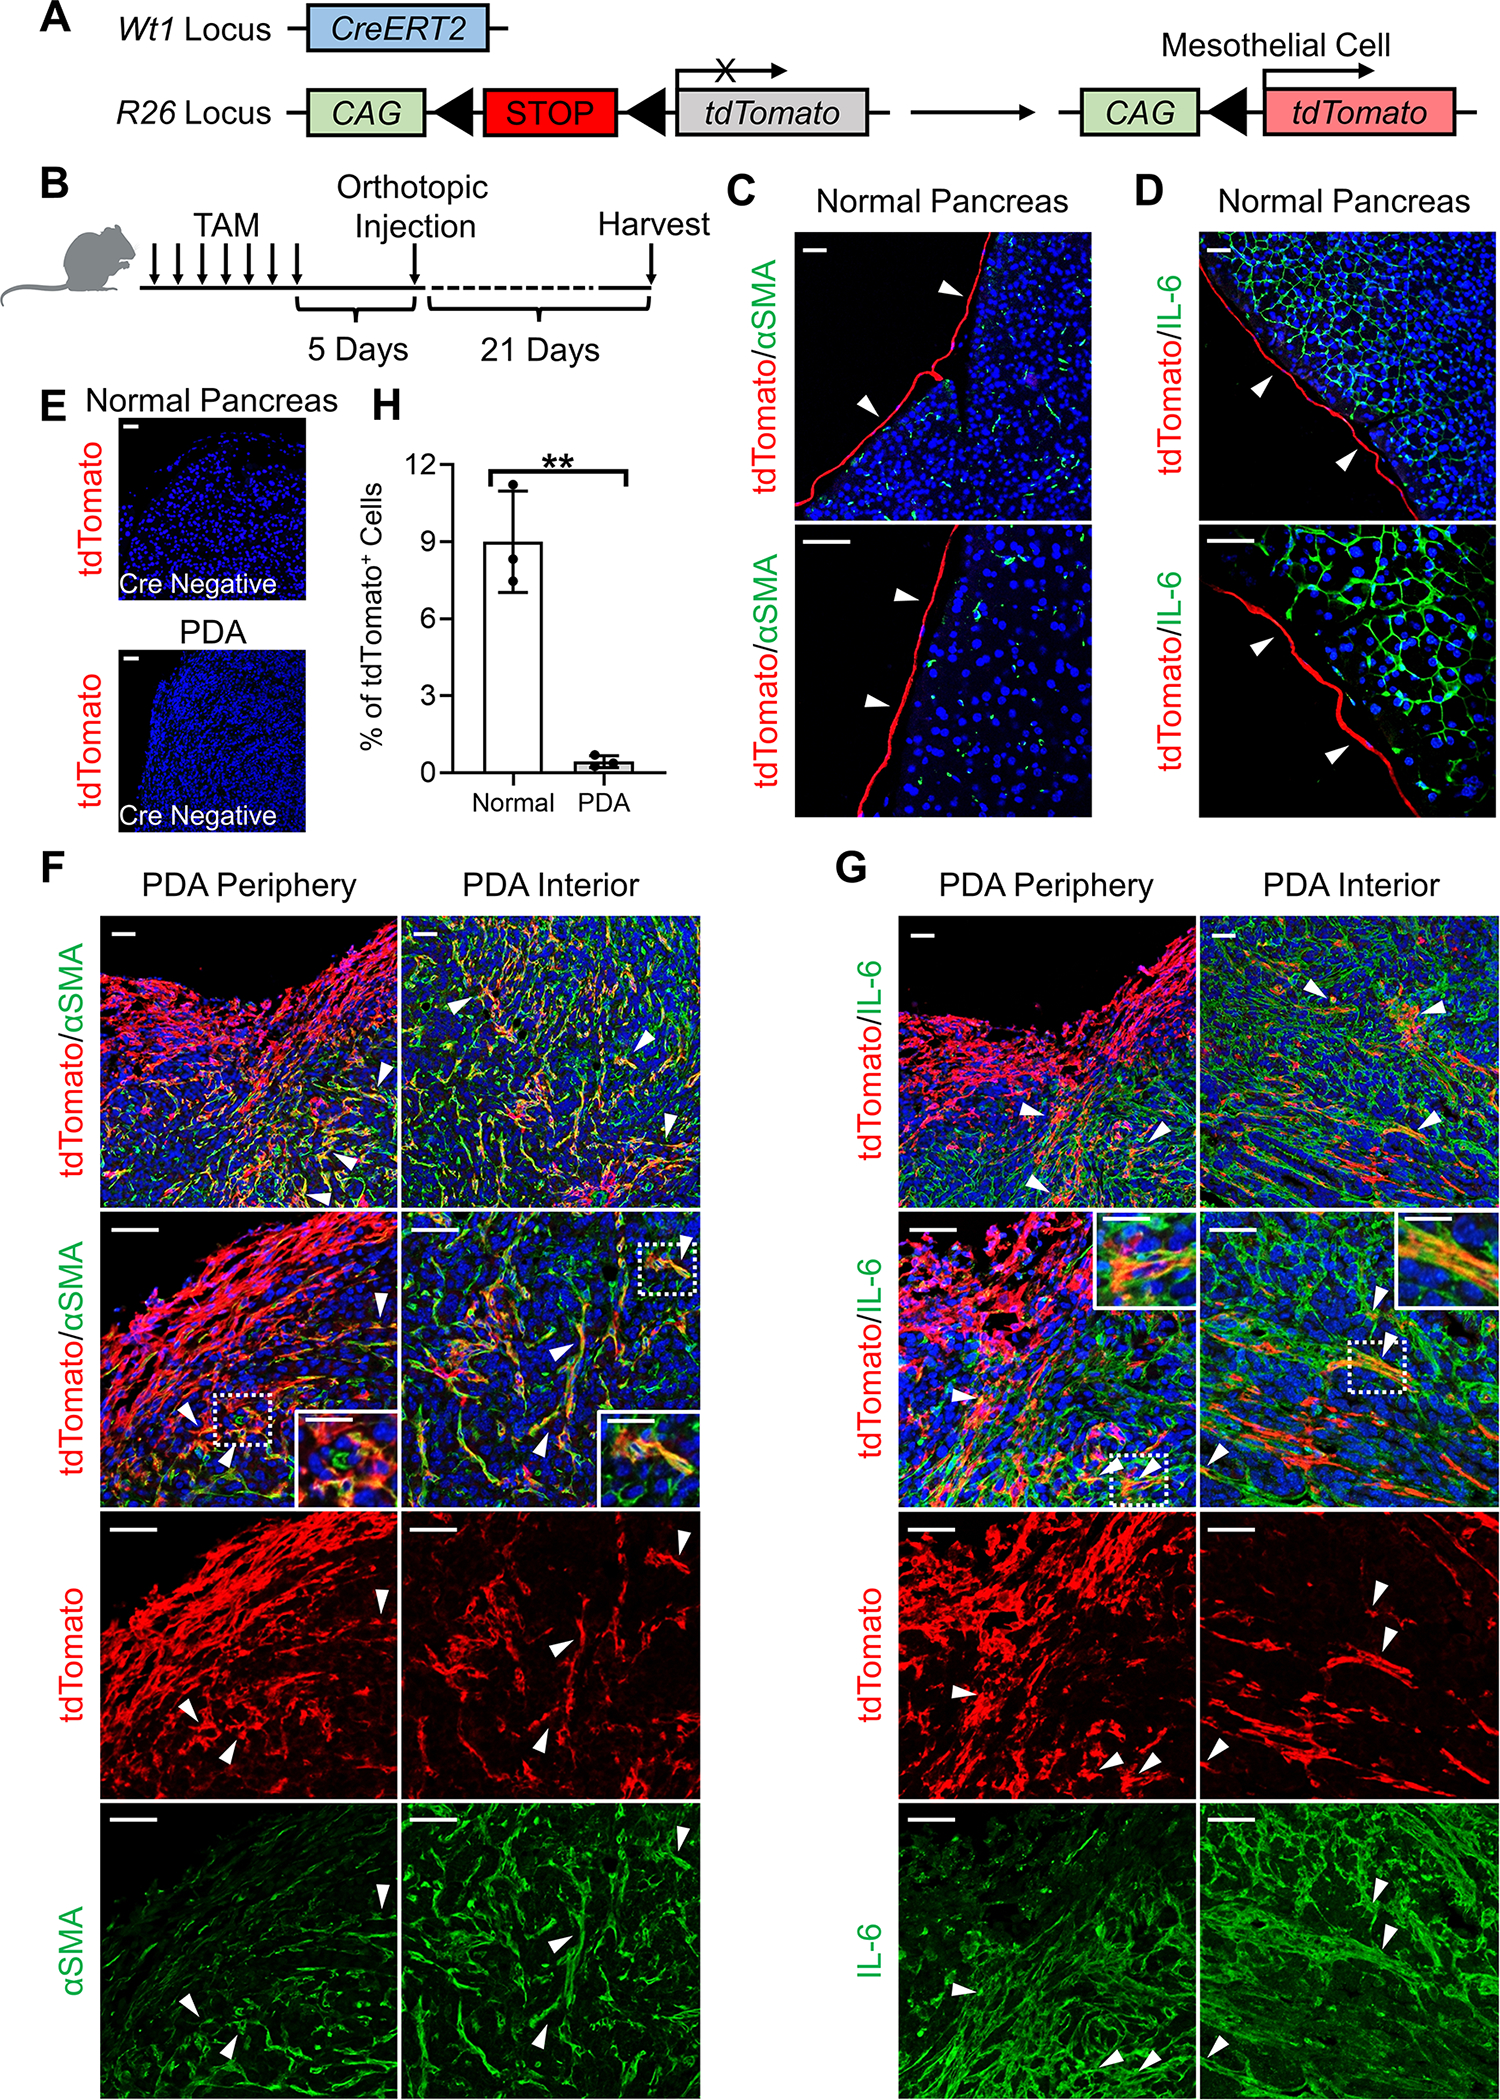
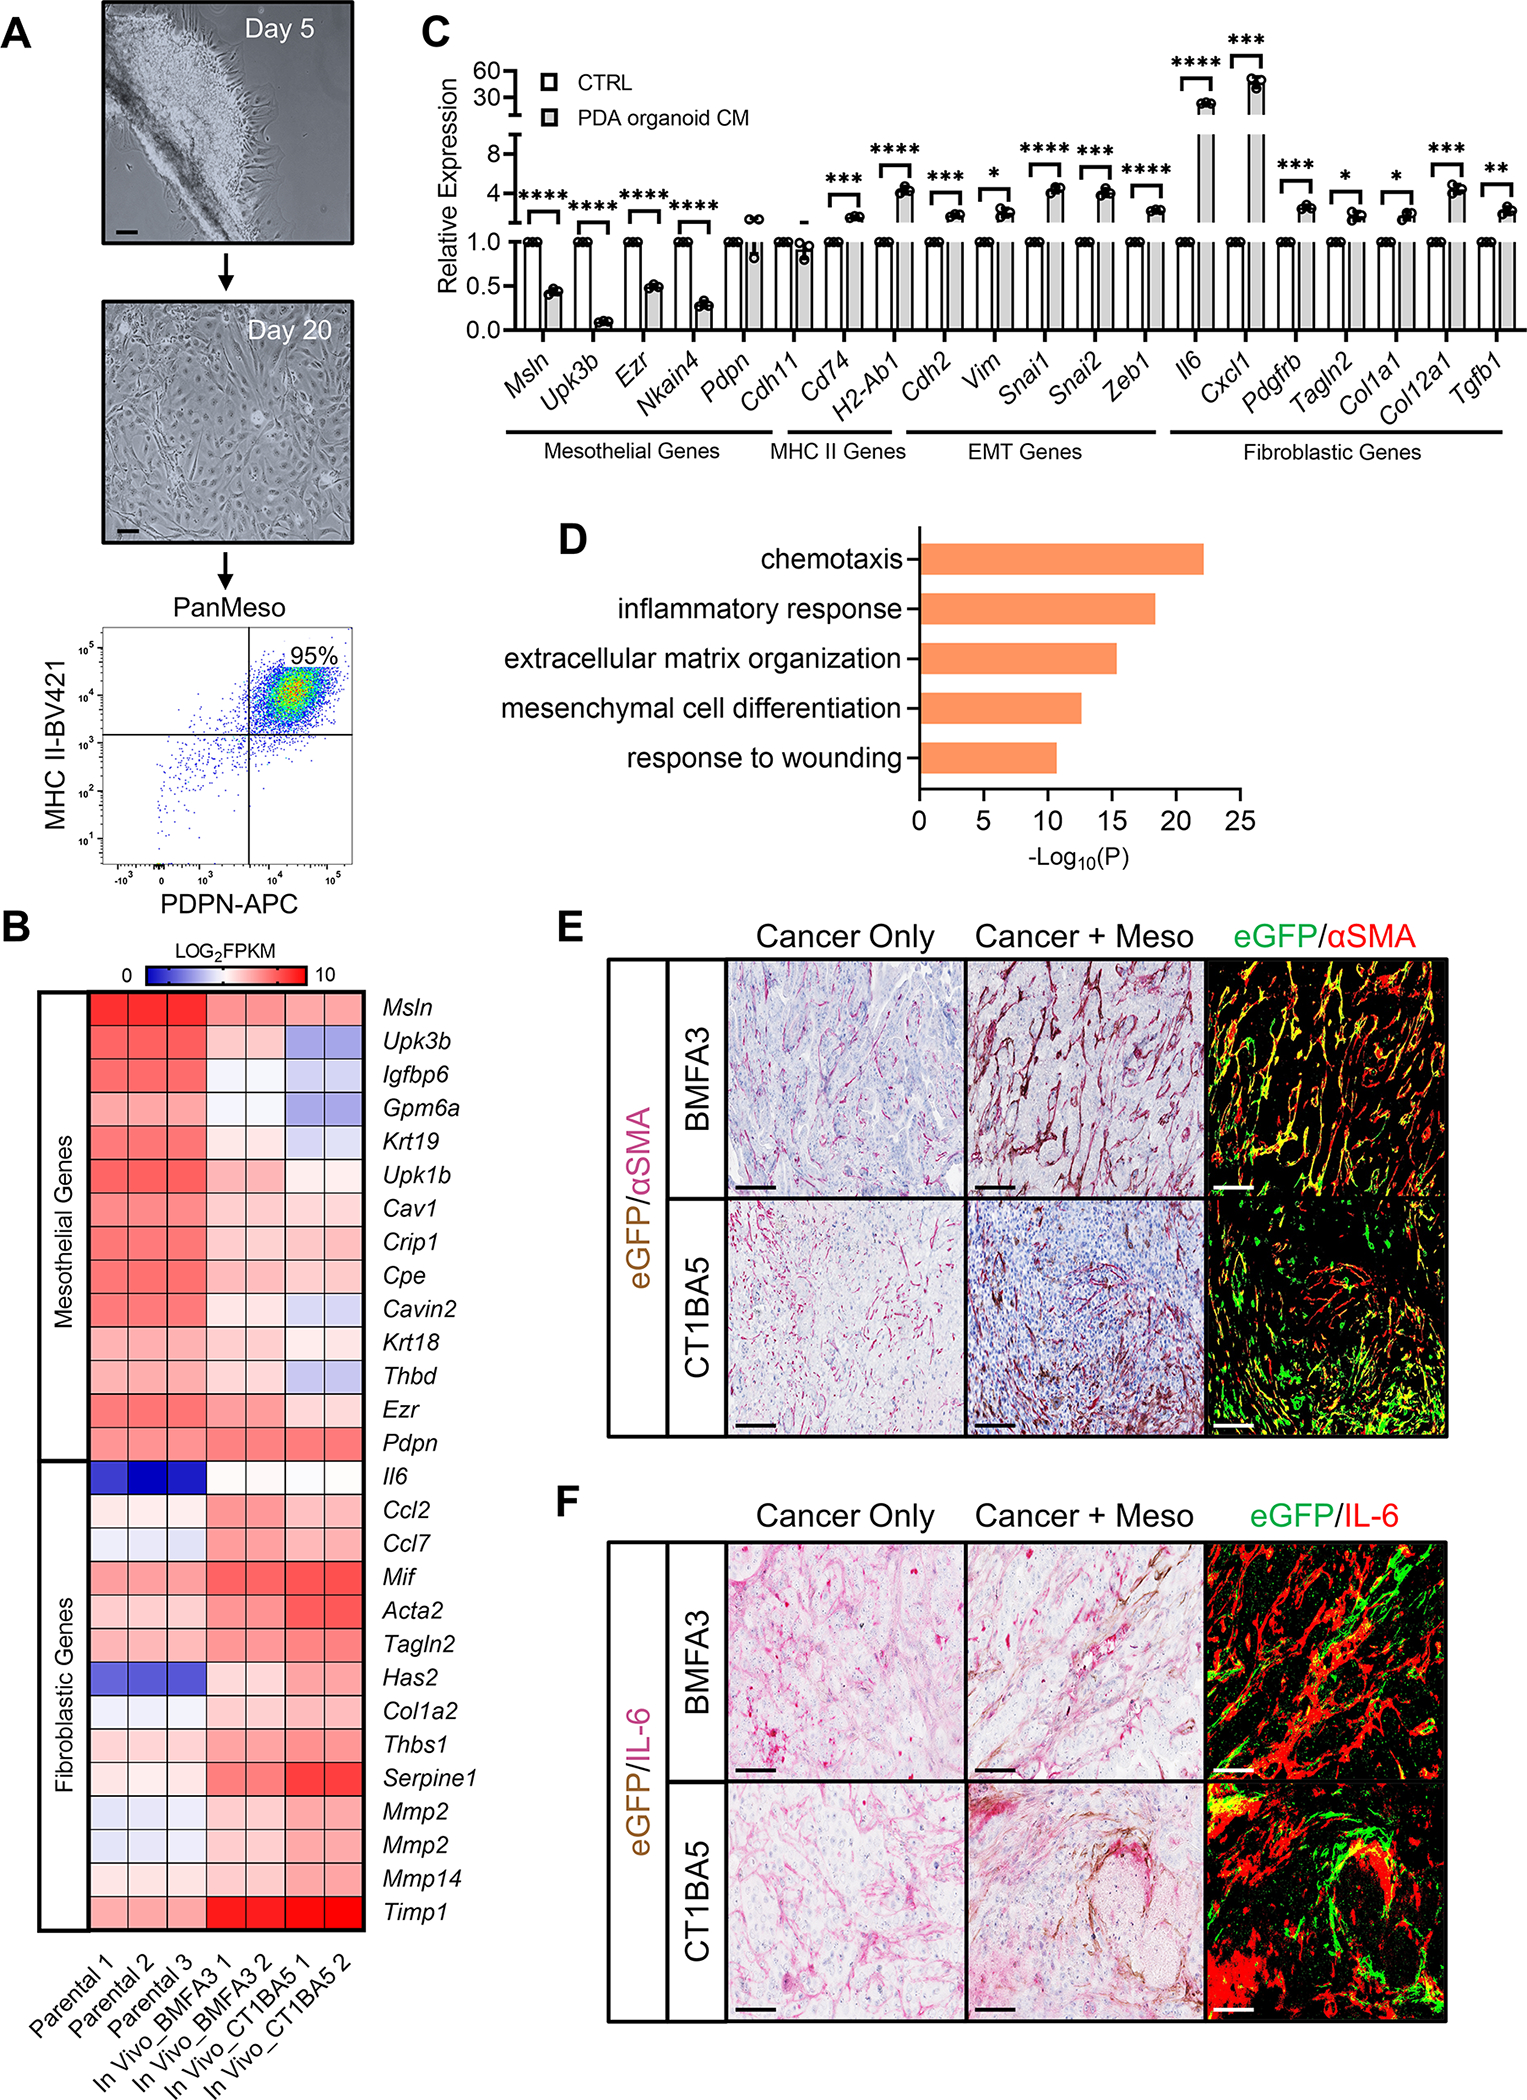
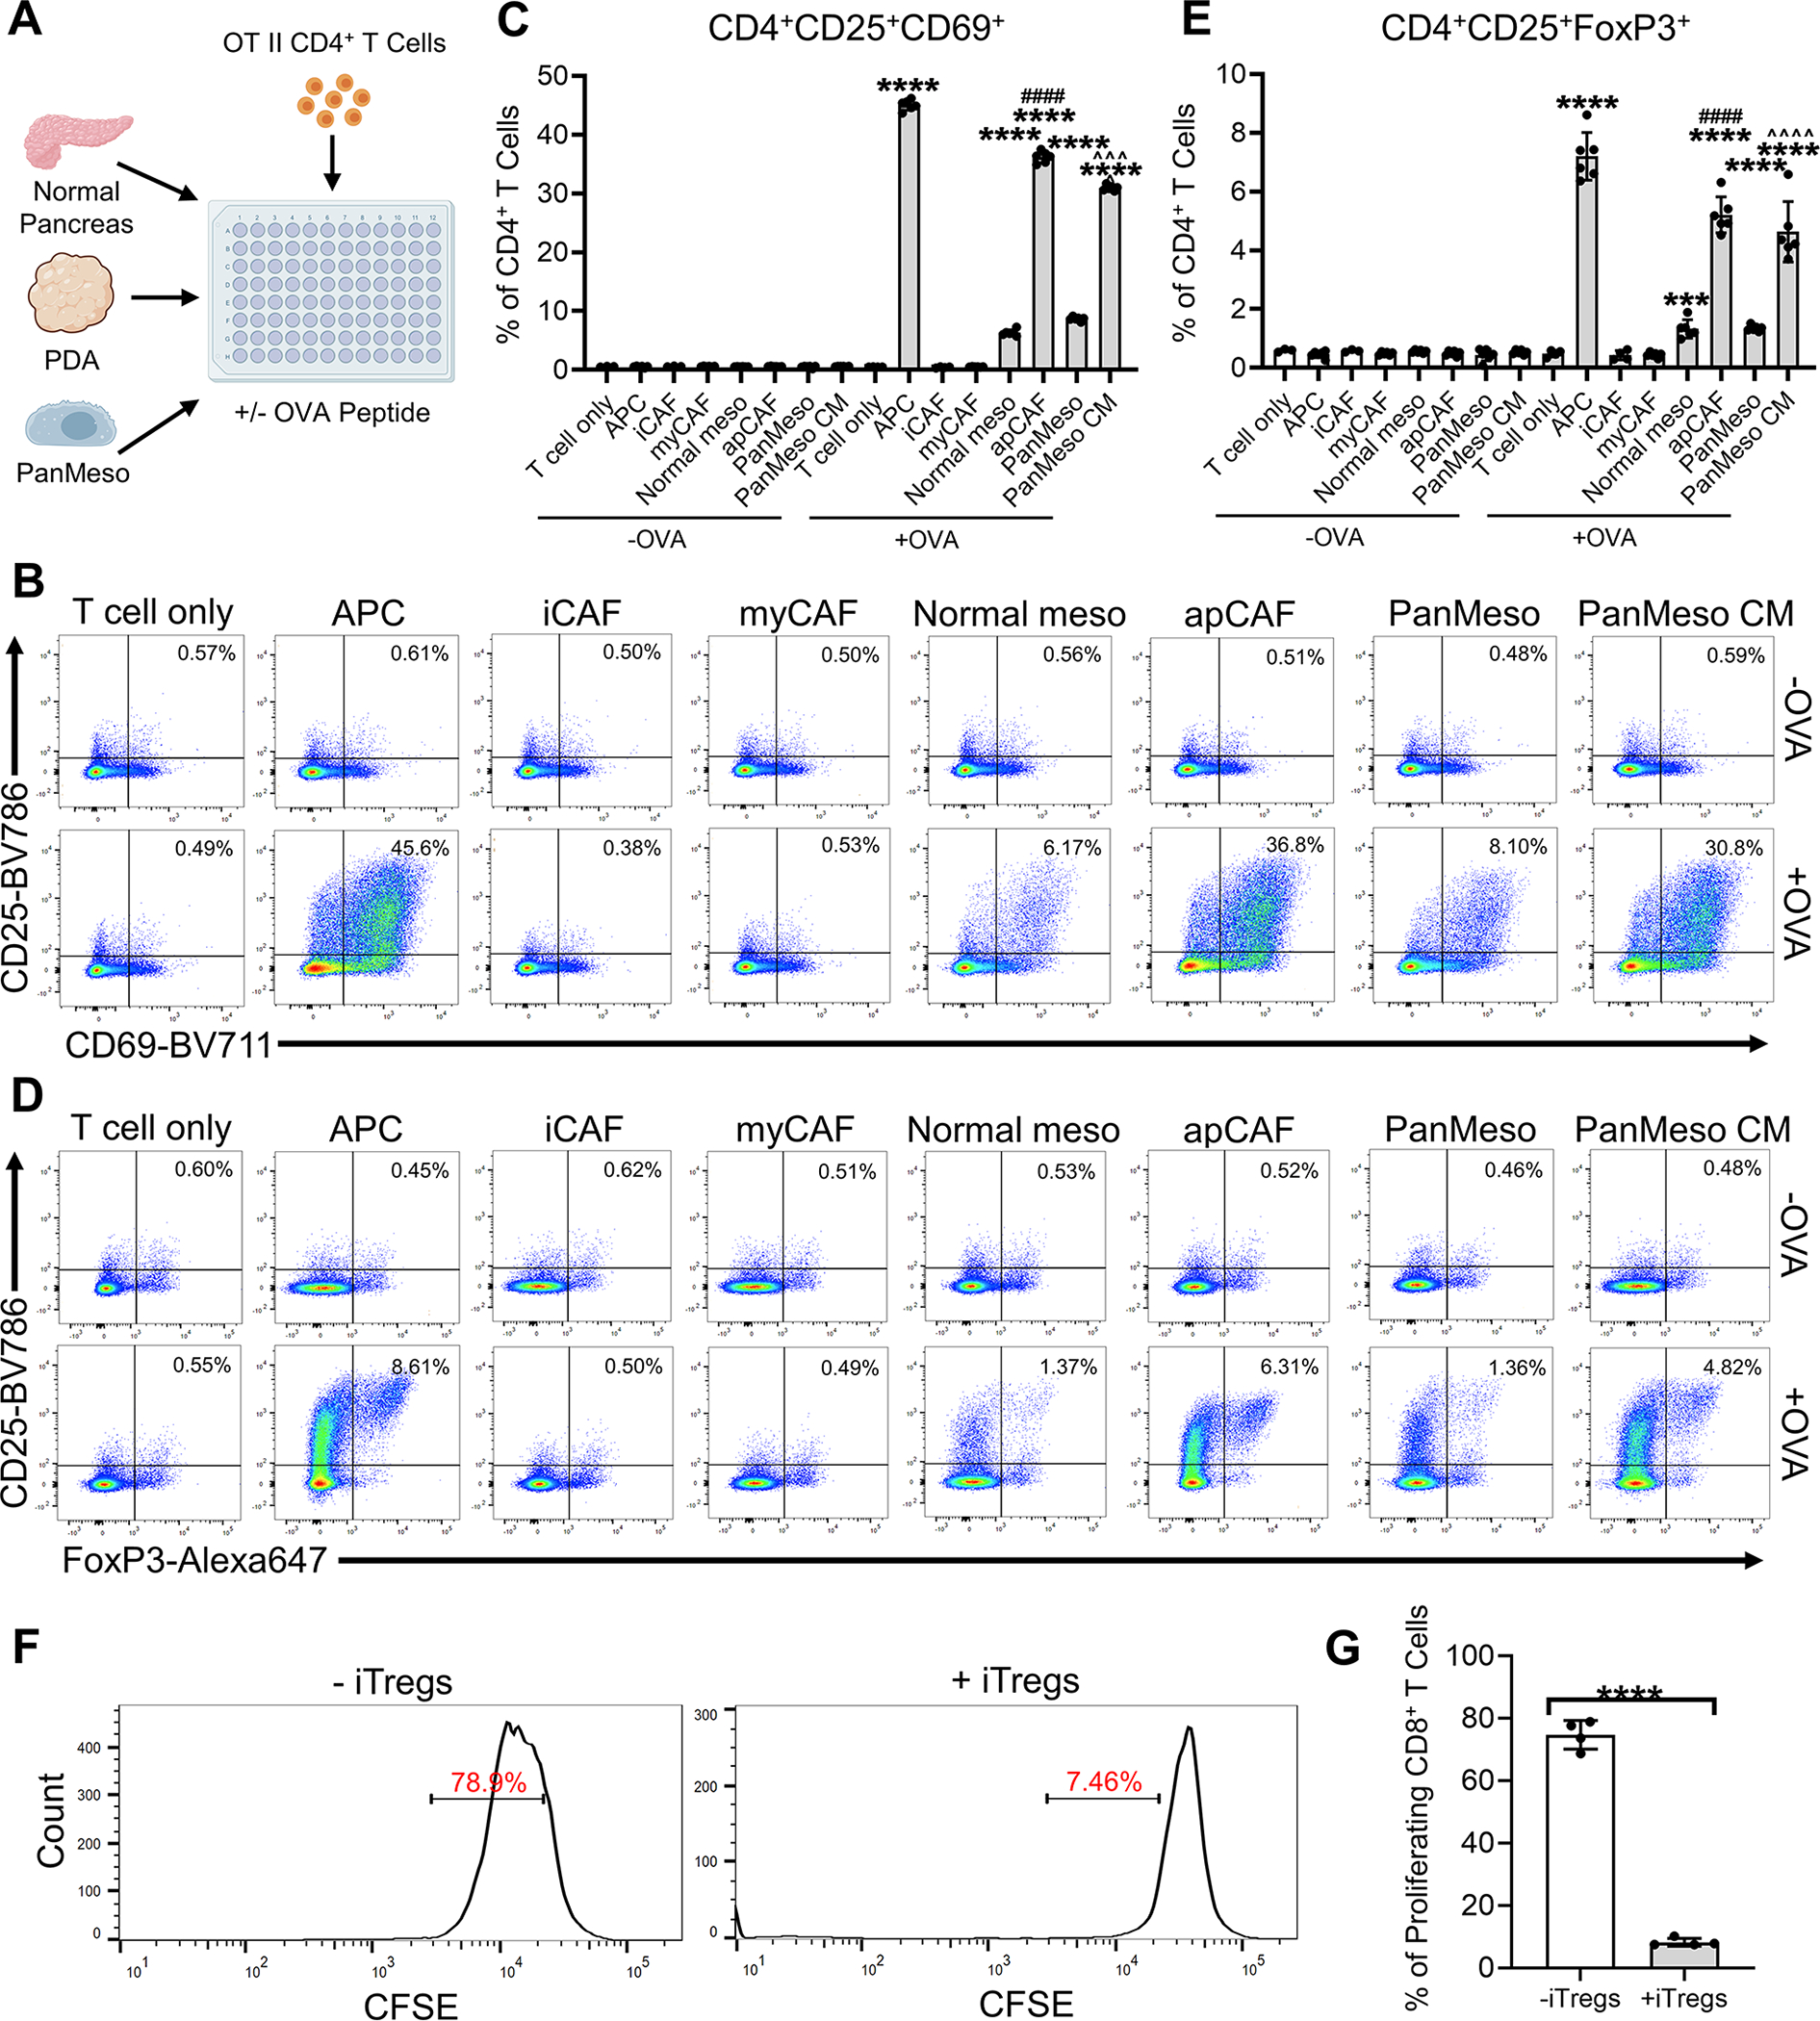
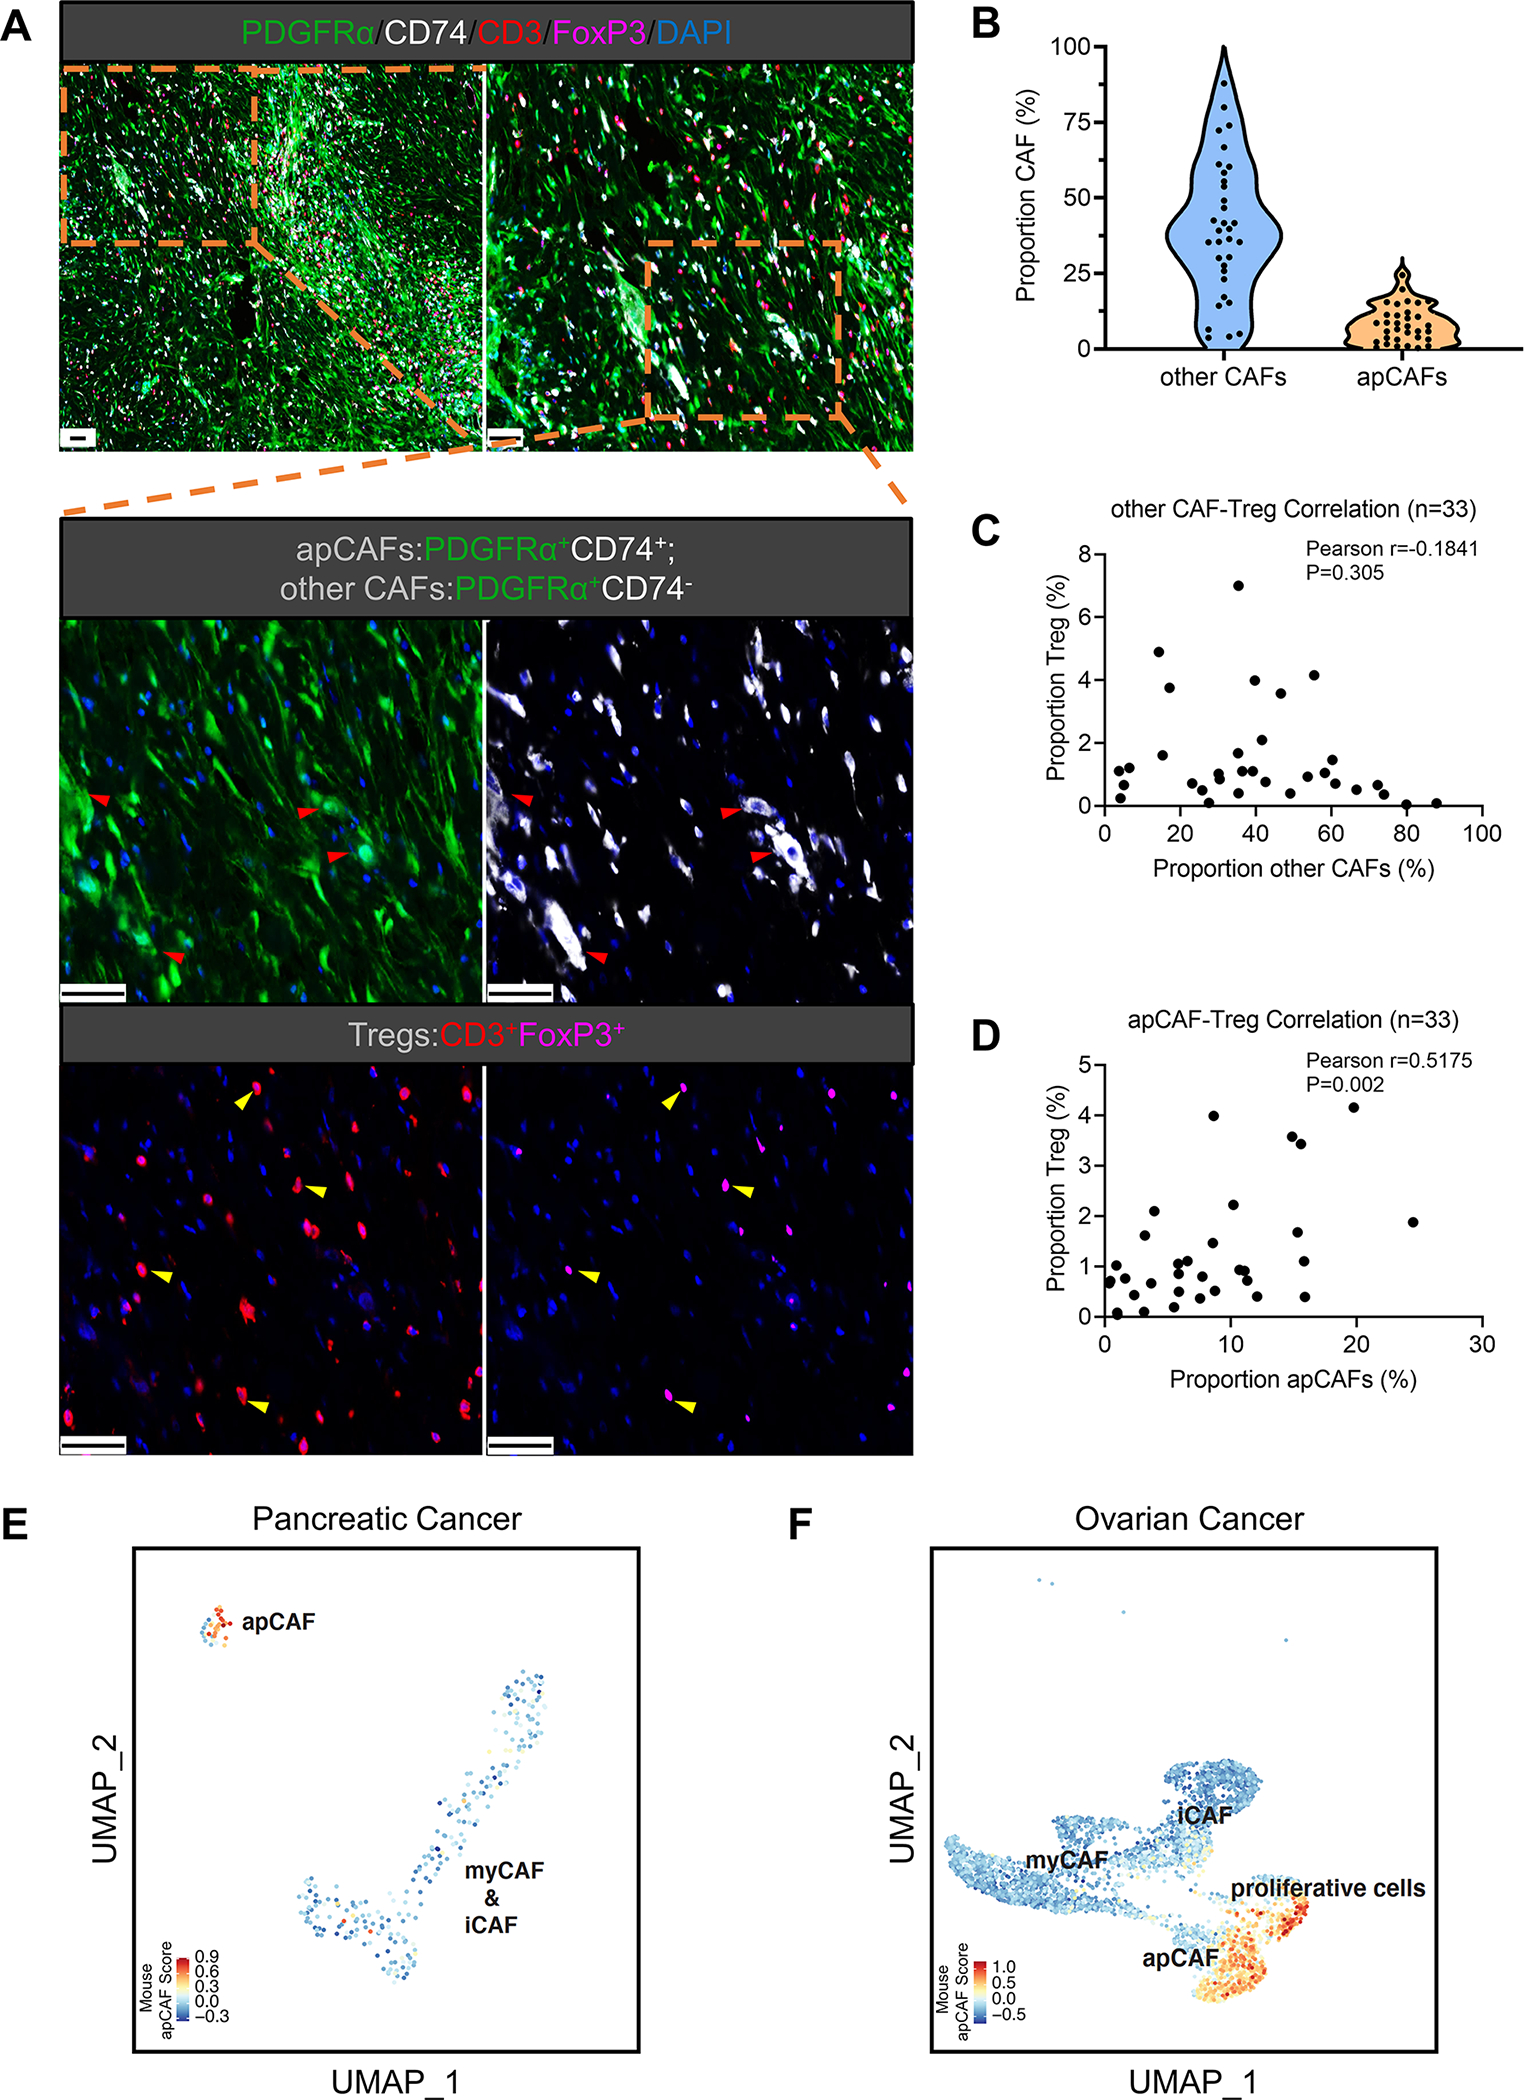
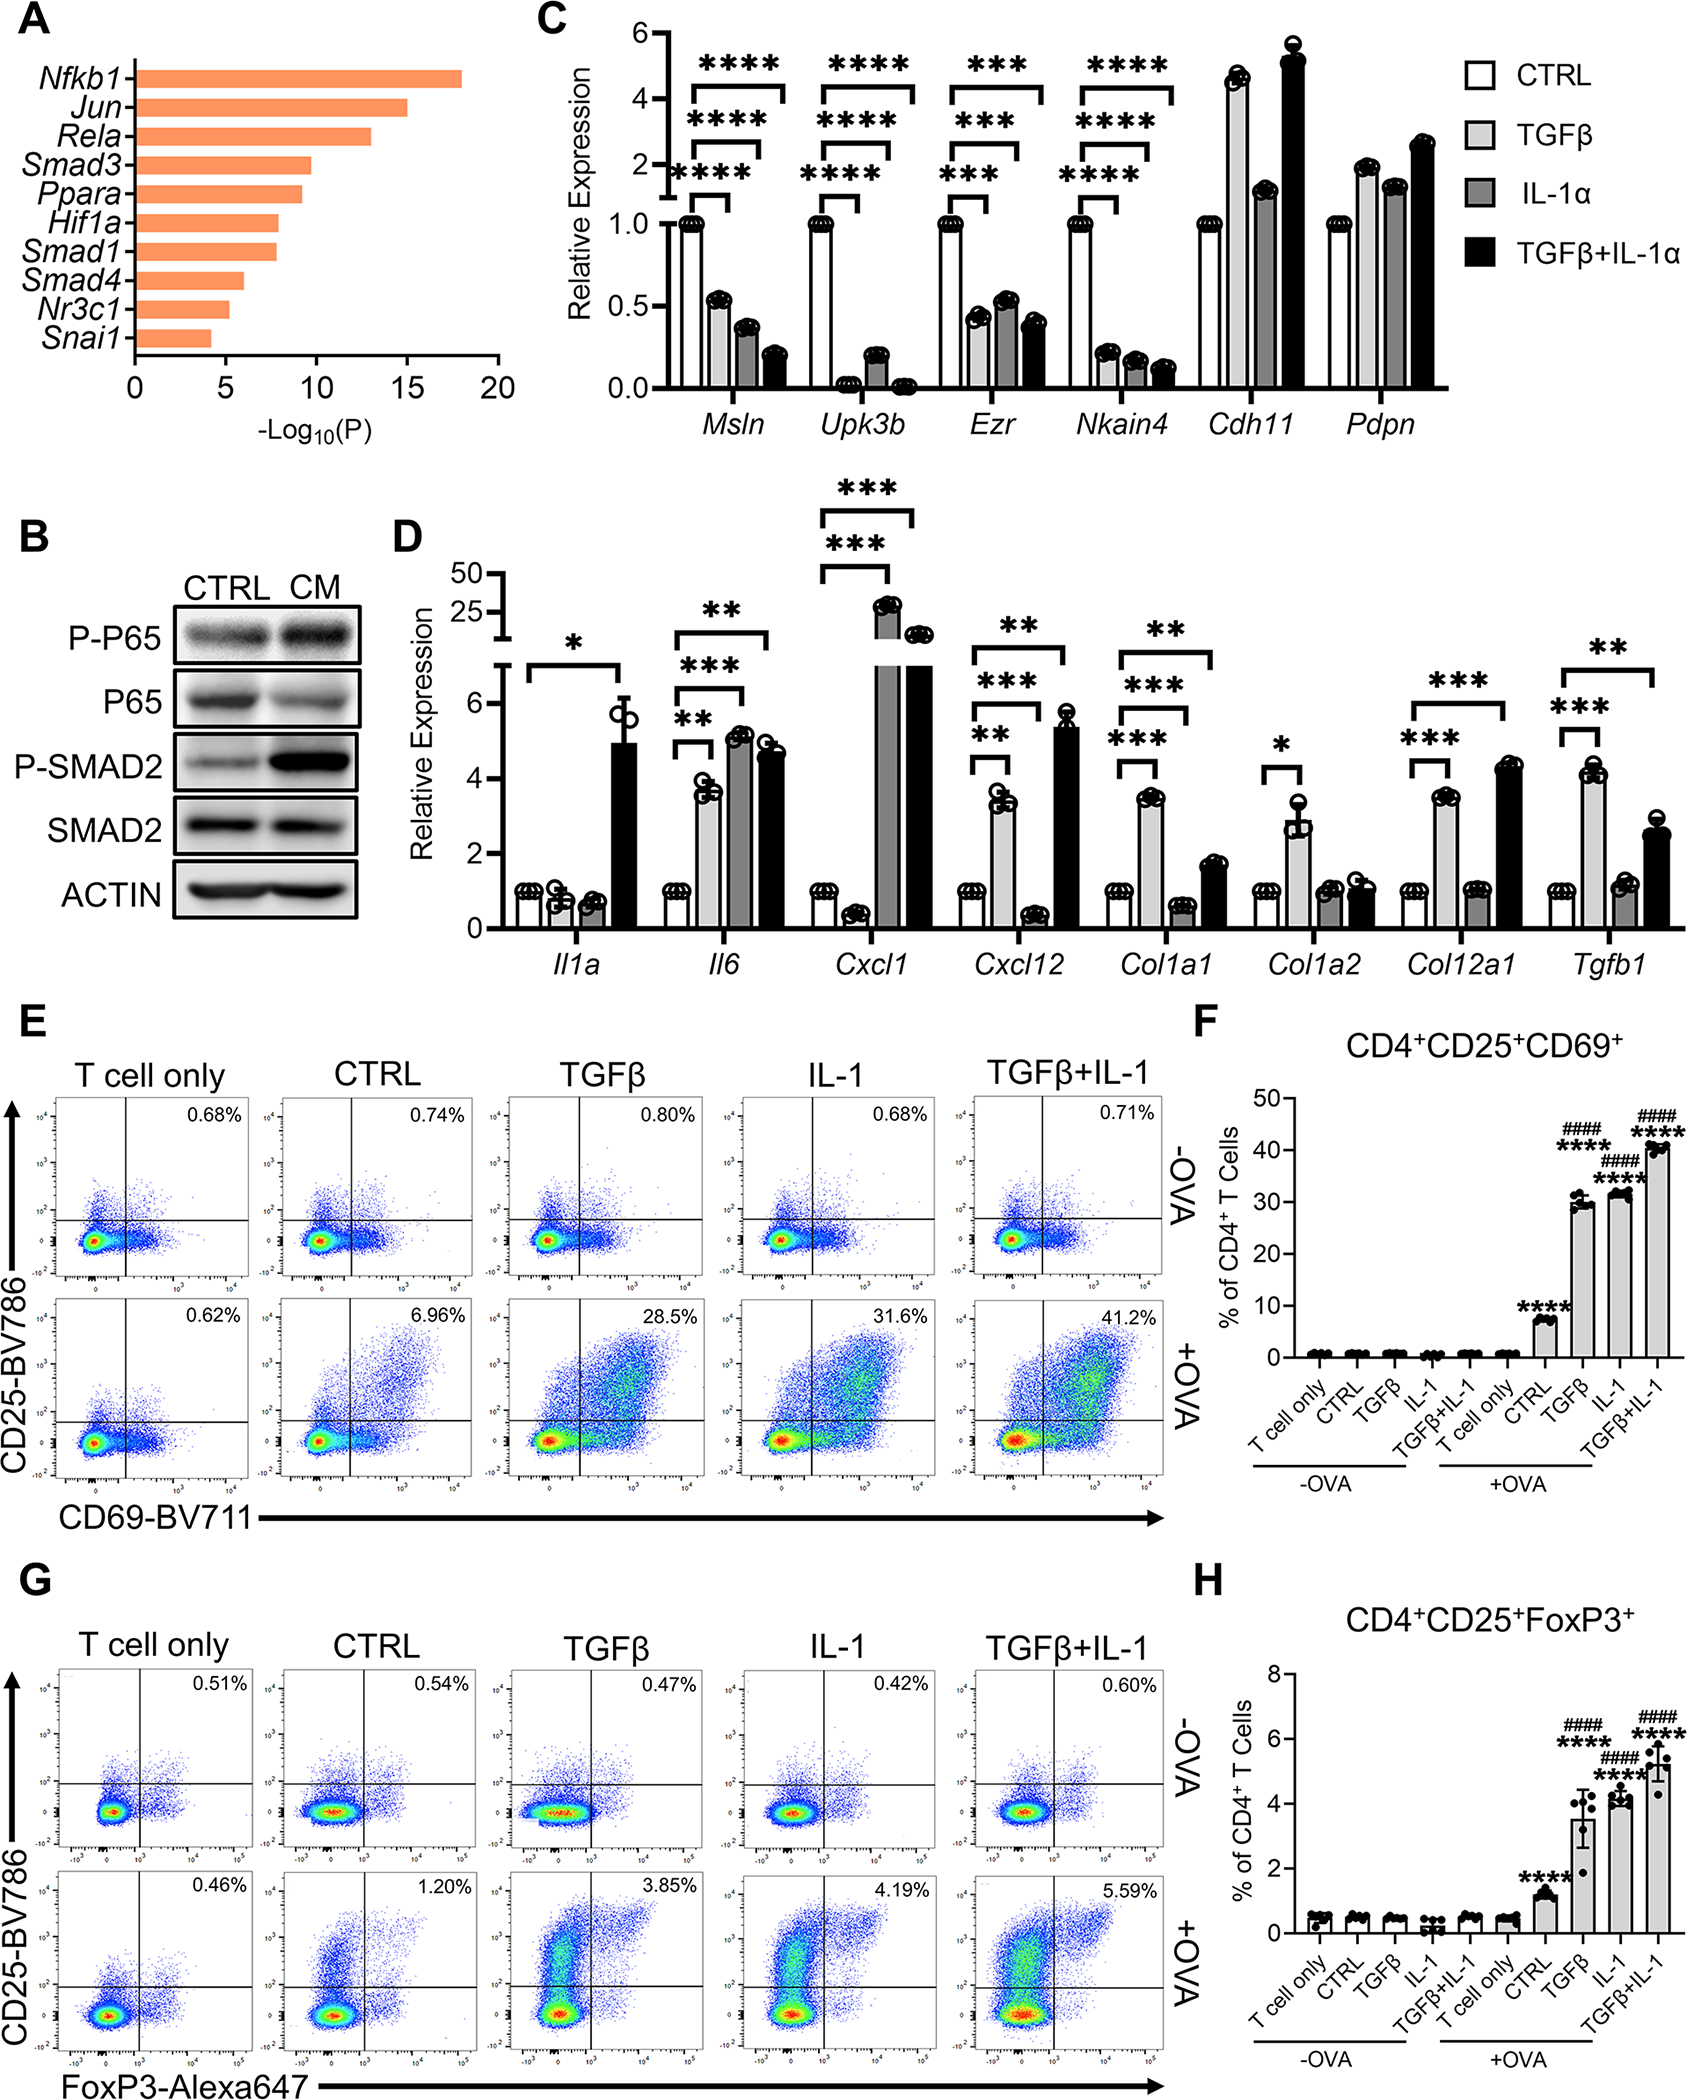
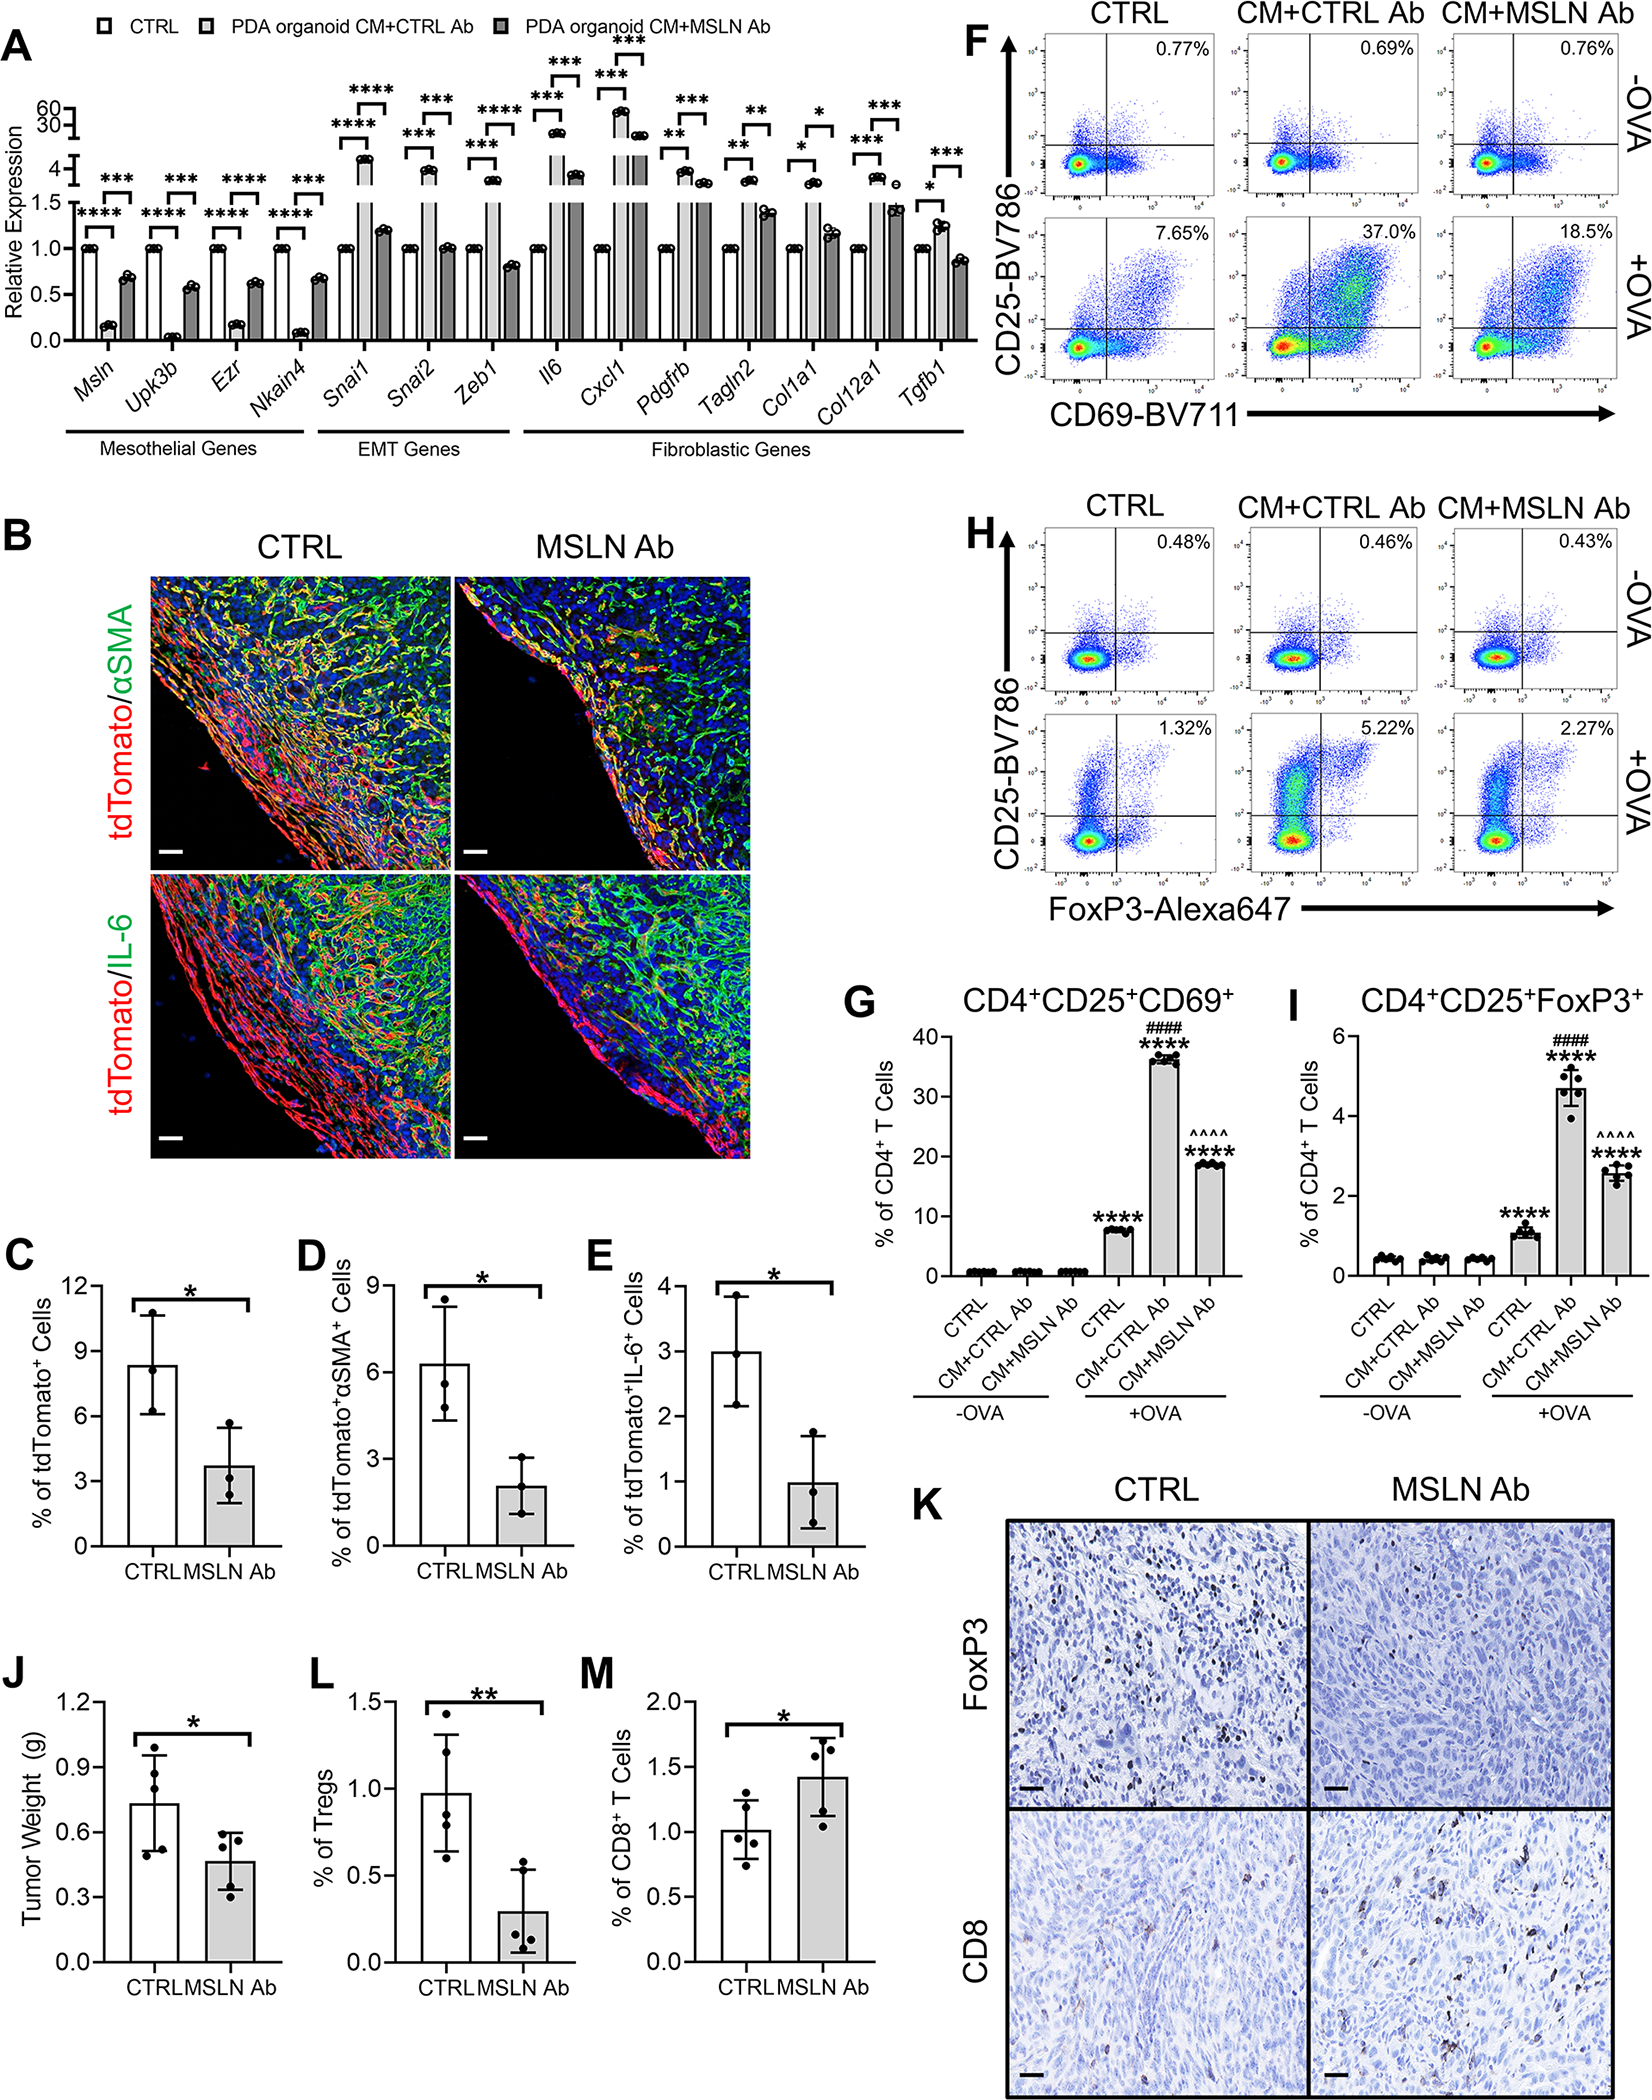
Recent studies have identified a unique cancer-associated fibroblast (CAF) population termed antigen-presenting CAFs (apCAFs), characterized by the expression of major histocompatibility complex class II molecules, suggesting a function in regulating tumor immunity. Here, by integrating multiple single-cell RNA-sequencing studies and performing robust lineage-tracing assays, we find that apCAFs are derived from mesothelial cells. During pancreatic cancer progression, mesothelial cells form apCAFs by downregulating mesothelial features and gaining fibroblastic features, a process induced by interleukin-1 and transforming growth factor β. apCAFs directly ligate and induce naive CD4+ T cells into regulatory T cells (Tregs) in an antigen-specific manner. Moreover, treatment with an antibody targeting the mesothelial cell marker mesothelin can effectively inhibit mesothelial cell to apCAF transition and Treg formation induced by apCAFs. Taken together, our study elucidates how mesothelial cells may contribute to immune evasion in pancreatic cancer and provides insight on strategies to enhance cancer immune therapy.

Keywords: cancer-associated fibroblast; mesothelial cell; mesothelin; pancreatic cancer; regulatory T cell.


Conflict of interest statement

Declaration of interests The authors declare no competing interests.

Figures

Figure 1.
Figure 1.. Relationship of Normal Mesothelial Cells and apCAFs in Integrated scRNA-seq Analyses
(A-B) All fibroblasts from scRNA-seq of normal pancreas, early KIC, late KIC, late KPC and late KPfC tumor lesions projected onto a tSNE plot with each model (A) or the FB1, FB2, FB3A and FB3B fibroblast populations (B) distinguished by different colors. (C) Proportions of different fibroblast populations in normal pancreas, early KIC, late KIC, late KPC and late KPfC tumor lesions. (D-F) Violin plots demonstrating mesothelial (D), MHC II (E) and fibroblastic (F) genes for FB1, FB2, FB3A and FB3B fibroblast populations. The width of the violin plots represents frequency of cells in each region. Values of Y axis indicate log normalized expression of genes. (G) Graph-based clustering of cells with UMAP was performed with the integrated data and 11 clusters of fibroblasts were identified. (H) UMAP plots of mesothelial and MHC II genes from the integrated fibroblast data. Color keys indicate log normalized expression. (I) Distribution of fibroblasts in the integrated data based on the origin of datasets (Dominguez et al., 2020; Elyada et al., 2019; Hosein et al., 2019), including FB1, FB2, FB3A and FB3B from Hosein et al. (Hosein et al., 2019), C0-C8 and normal mesothelial cell from Dominguez et al. (Dominguez et al., 2020) and iCAF, apCAF and myCAF from Elyada et al. (Elyada et al., 2019). See also Figure S1.
Figure 2.
Figure 2.. Mesothelial Cells Expand and Gain Fibroblastic Feature during PDA Formation
(A) Three 60-day-old KPfC tumors were analyzed for CAFs through flow cytometry (PDA1, PDA2, PDA3). The flow cytometry gating of PDA1 and percentages of CAF subtypes in the three tumors was shown. Podoplanin+ (PDPN+) (total CAFs, 31.5%); PDPN+MHC II+ (apCAFs, 18.2%); PDPN+MHC IIIL-6+ (iCAFs, 16.8%); PDPN+MHC IIαSMA+ (myCAFs, 19.3%). (B) Mesothelium tracing with CFSE in normal mice, KIC and KPfC mice with PDAs (arrows). (CFSE, green; DAPI, blue). Scale bar 50 μm. (C) The normal pancreas or KPfC PDA tissues from the CFSE lineage tracing assay (B) were stained for cadherin-11 (red) or SOX9 (red) and overlapped with CFSE (green) and DAPI (blue) staining. Scale bar 50 μm. (D) Pseudotime analysis with normal mesothelial cells (cluster 7), apCAFs (cluster 9) and other closely associated fibroblast populations (clusters 1, 4, 8, 10) from the integrated data (inset, Figure 1G). (E) The heatmap displaying the top significant genes (cutoff: P<10−20) for normal mesothelial cells (cluster 7) and apCAFs (cluster 9) from the integrated data (Figure 1G). (F) Top biological processes of Gene Ontology (GO) analysis with the up-regulated gene cluster in apCAFs compared with normal mesothelial cells (E). See also Figure S2 and Figure S3.
Figure 3.
Figure 3.. Lineage Tracing of Mesothelial Cells in PDA with Inducible Transgenic Mouse Model
(A-B) Wt1CreERT2; R26LSL-tdTomato model was established to trace the fate of mesothelial cells (A). Seven doses of TAM were injected into the Wt1CreERT2; R26LSL-tdTomato mice to induce the tdTomato expression in mesothelial cells (B). Pancreata were either harvested for analysis or orthotopically injected with the KPfC cell line BMFA3 for tumor formation 5 days after the last dose of TAM injection. (C-D) Normal pancreata of Wt1CreERT2; R26LSL-tdTomato harvested after TAM injection were stained for tdTomato (red), DAPI (blue), αSMA (green, C) or IL-6 (green, D). Scale bar 50 μm. (E) R26LSL-tdTomato mice without Wt1CreERT2 were treated with TAM negative control and followed the same scheme as (B). Normal pancreata or PDAs were harvested and stained for tdTomato (red) and DAPI (blue). Scale bar 50 μm. (F-G) PDAs from Wt1CreERT2; R26LSL-tdTomato mice following (B) were stained for tdTomato (red), DAPI (blue), αSMA (green, F) or IL-6 (green, G). Both periphery and interior of the tumors were shown. Scale bar 50 μm. Scale bars inside the magnification boxes 25 μm. (H) tdTomato+ cells of normal pancreata (C-D) and PDAs (F-G) were quantified, n=3, data shown as mean ± SD, statistical analysis, t-test, **P<0.01.
Figure 4.
Figure 4.. Recapitulating the Mesothelial Cell-apCAF Transition in PanMeso Cells
(A) Day 5 and day 20 of pancreatic mesothelium tissues from immortomice were shown. Cells became confluent and were subjected to FACS. Podoplanin+MHC II+ cells were collected (PanMeso cells). Scale bar 50 μm. (B) The heatmap generated from the RNA-seq data comparing mesothelial genes and fibroblastic genes between parental PanMeso cells and PanMeso cells sorted from BMFA3 or CT1BA5 tumors. (C) The PanMeso cells were treated with PDA organoid conditioned medium derived from KPfC tumors for 48 hrs. Cells were harvested and subjected to qPCR for mesothelial, MHC II, EMT and fibroblastic genes. n=3, data shown as mean ± SD, statistical analysis, t-test, *P<0.05, **P<0.01, ***P<0.001, ****P<0.0001. (D) Top biological processes of GO analysis with the up-regulated gene cluster in sorted compared with parental PanMeso cells (B) were shown. (E-F) The tumors of (B) were fixed and stained for eGFP (brown) and the fibroblastic marker αSMA (red, E) or IL-6 (red, F). eGFP was also highlighted as green and αSMA or IL-6 was highlighted as red by ImageJ (right panel in E and F). Yellow marked the eGFP+ PanMeso cells expressing fibroblastic marker αSMA or IL-6. Scale bar 25 μm. See also Figure S3.
Figure 5.
Figure 5.. apCAFs Induce Naïve CD4+ T Cells into Tregs
(A) An illustration of the APC/mesothelial cell/CAF-T cell co-culture assay. (B-C) The CD4+ T cells after being co-cultured (A) were subjected to flow cytometry for the analysis of the early activation markers of TCR ligation CD25 and CD69 and representative plots were shown (B). CD4+CD25+CD69+ T cells of the flow cytometry were quantified (C), n=6, data shown as mean ± SD, statistical analysis, t-test, ****P<0.0001 vs without OVA control. ####P<0.0001 vs normal mesothelial cells. ^^^P<0.001 vs control PanMeso cells. (D-E) The CD4+ T cells after being co-cultured (A) were subjected to flow cytometry for the analysis of Treg markers CD25 and FoxP3 and representative plots were shown (D). CD4+CD25+FoxP3+ Tregs of the flow cytometry were quantified (E), n=6, data shown as mean ± SD, statistical analysis, t-test, ***P<0.001, ****P<0.0001 vs without OVA control. ####P<0.0001 vs normal mesothelial cells. ^^^^P<0.0001 vs control PanMeso cells. (F-G) Naïve OT II CD4+ T cells were co-cultured with apCAFs sorted from tumors in the absence or presence of OVA peptide. The uninduced CD4+ T cells (without OVA) and iTregs (with OVA) were then co-cultured with CFSE-labeled CD8+ T cells with subsequent flow cytometry analysis. Representative plots of CFSE-labeled CD8+ T cells were shown (F). Proliferating CD8+ T cells (CFSE low) were quantified (G), n=4, data shown as mean ± SD, statistical analysis, t-test, ****P<0.0001. See also Figure S4.
Figure 6.
Figure 6.. apCAFs are Present in Human Tumors and Correlate with Tregs
(A-D) A cohort of PDA tissues from 33 patients were subjected to multiplex staining for apCAFs (PDGFRα+CD74+), other CAFs (PDGFRα+CD74) and Tregs (CD3+FoxP3+). PDGFRα (green), CD74 (white), CD3 (red), FoxP3 (magenta), DAPI (blue). Scale bar 50 μm (A). The staining images were analyzed and the percentages of apCAFs, other CAFs and Tregs were quantified by the HALO image analysis platform. Quantification of other CAFs and apCAFs was shown by the violin plot (B). The width of the violin plot represents frequency of patients (each dot represents one patient) in each region. Pearson correlation analysis was performed between other CAFs & Tregs (C) and apCAFs & Tregs (D). (E-F) The mouse apCAF gene signature generated from the integrated dataset (Figure 1G) was scored in two human cancer scRNA-seq datasets including PDA (E) and ovarian cancer (F). The fibroblast subpopulations from these two datasets were identified based on the cluster annotations mentioned in the original publications (iCAF, myCAF, apCAF in the PDA dataset; iCAF, myCAF, apCAF and proliferative cells in the ovarian cancer dataset). See also Figure S5.
Figure 7.
Figure 7.. IL-1 and TGFβ are Responsible for Mesothelial Cell-apCAF Transition
(A) The differential genes that were up-regulated in apCAFs compared to normal mesothelial cells from the integrated data (Figure 1G) were subjected to motif enrichment analysis. Top transcription factors from the analysis are shown. (B) Western blots with PanMeso cells treated with control medium or PDA organoid conditioned medium (CM) for 48 hrs, probed for the phosphorylation of the NF-κB signaling (P-P65) and TGFβ signaling (P-SMAD2) proteins. (C-D) The PanMeso cells were treated with IL-1α (5 ng/mL), TGFβ (30 ng/mL) or a combination of IL-1α (5 ng/mL) and TGFβ (30 ng/mL) for 48 hrs and subjected to qPCR for mesothelial (C) and fibroblastic (D) genes. n=3, data shown as mean ± SD, statistical analysis, t-test, *P<0.05, **P<0.01, ***P<0.001, ****P<0.0001. (E-F) The PanMeso cells were pre-treated with IL-1α (5 ng/mL), TGFβ (30 ng/mL) or a combination of IL-1α (5 ng/mL) and TGFβ (30 ng/mL) for 48 hrs and washed. Cells were then incubated with the OVA peptide (OVA 323–339) for 4 hrs. The PanMeso cells were washed and co-cultured with CD4+ T cells isolated from OT II mice for 18 hrs. The CD4+ T cells after the co-culture were subjected to flow cytometry for the analysis of the early activation markers of TCR ligation CD25 and CD69 and representative plots were shown (E). CD4+CD25+CD69+ T cells of the flow cytometry were quantified (F), n=6, data shown as mean ± SD, statistical analysis, t-test, ****P<0.0001 vs without OVA control. ####P<0.0001 vs control with OVA treatment. (G-H) The CD4+ T cells after the co-culture were subjected to flow cytometry for the analysis of the Treg markers CD25 and FoxP3 and representative plots were shown (G). CD4+CD25+FoxP3+ Tregs of the flow cytometry were quantified (H), n=6, data shown as mean ± SD, statistical analysis, t-test, ****P<0.0001 vs without OVA control. ####P<0.0001 vs control with OVA treatment.
Figure 8.
Figure 8.. Inhibition of Mesothelial Cell to apCAF Transition by Targeting Mesothelin
(A) PanMeso cells were treated with KPfC PDA organoid CM with the presence of isotype control Ab (CTRL Ab) or mouse specific mesothelin antibody (MSLN Ab) and subjected to qPCR to examine mesothelial, EMT and fibroblastic genes. n=3, data shown as mean ± SD, statistical analysis, t-test, *P<0.05, **P<0.01, ***P<0.001, ****P<0.0001. (B-E) Seven doses of TAM were injected into the Wt1CreERT2; R26LSL-tdTomato mice to induce the tdTomato expression in mesothelial cells. 3 days after the last dose of TAM injection, mice were given 1 dose of CTRL Ab or MSLN Ab. The mice were then orthotopically injected with the KPC cell line 6499c4 5 days after the last dose of TAM injection. Control Ab or MSLN Ab treatment were given once per week during the tumor progression. Tumors were harvested 21 days after the orthotopic injection and stained for tdTomato (red), DAPI (blue), αSMA (green) or IL-6 (green) (B). Scale bar 50 μm. tdTomato+ (C), tdTomato+αSMA+ (D) and tdTomato+IL-6+ (E) cells were quantified. n=3, data shown as mean ± SD, statistical analysis, t-test, *P<0.05. (F-G) PanMeso cells were pre-treated with control medium or PDA organoid CM in the presence of CTRL Ab or MSLN Ab for 48 hrs, washed and incubated with the OVA peptide (OVA 323–339) for 4 hrs. The PanMeso cells were then washed again and co-cultured with CD4+ T cells isolated from OT II mice for 18 hrs. The CD4+ T cells after the co-culture were subjected to flow cytometry for the analysis of the early activation markers of TCR ligation CD25 and CD69 and representative plots were shown (F). CD4+CD25+CD69+ T cells of the flow cytometry were quantified (G), n=6, data shown as mean ± SD, statistical analysis, t-test, ****P<0.0001 vs without OVA control. ####P<0.0001 vs control with OVA treatment. ^^^^P<0.0001 vs PDA organoid CM treatment. (H-I) The CD4+ T cells after the co-culture were subjected to flow cytometry for the analysis of the Treg markers CD25 and FoxP3 and representative plots were shown (H). CD4+CD25+FoxP3+ Tregs of the flow cytometry were quantified (I), n=6, data shown as mean ± SD, statistical analysis, t-test, ****P<0.0001 vs without OVA control. ####P<0.0001 vs control with OVA treatment. ^^^^P<0.0001 vs PDA organoid CM treatment. (J-M) C57BL/6 mice were treated with one dose of control or MSLN Ab and 6499c4 cells were then injected orthotopically into the mice. Control or MSLN Ab treatment were maintained once per week during the tumor formation. 21 days after orthotopic injection, tumors were harvested, weighed (J) and stained for FoxP3 and CD8 (K). Scale bar 25 μm. Tumor weights (J), FoxP3+ Tregs (L) and CD8+ T cells (M) were quantified. n=5, data shown as mean ± SD, statistical analysis, t-test, *P<0.05, **P<0.01. See also Figure S6.

Comment in

References

    1. Barnden MJ, Allison J, Heath WR, and Carbone FR (1998). Defective TCR expression in transgenic mice constructed using cDNA-based alpha- and beta-chain genes under the control of heterologous regulatory elements. Immunol Cell Biol 76, 34–40. - PubMed
    1. Biffi G, Oni TE, Spielman B, Hao Y, Elyada E, Park Y, Preall J, and Tuveson DA (2019). IL1-Induced JAK/STAT Signaling Is Antagonized by TGFbeta to Shape CAF Heterogeneity in Pancreatic Ductal Adenocarcinoma. Cancer Discov 9, 282–301. - PMC - PubMed
    1. Bour-Jordan H, and Bluestone JA (2009). Regulating the regulators: costimulatory signals control the homeostasis and function of regulatory T cells. Immunol Rev 229, 41–66. - PMC - PubMed
    1. Butler A, Hoffman P, Smibert P, Papalexi E, and Satija R (2018). Integrating single-cell transcriptomic data across different conditions, technologies, and species. Nat Biotechnol 36, 411–420. - PMC - PubMed
    1. Cao J, and Poss KD (2018). The epicardium as a hub for heart regeneration. Nat Rev Cardiol 15, 631–647. - PMC - PubMed

Publication types

MeSH terms

Substances