. 2022 May 26;185(11):1875-1887.e8.
doi: 10.1016/j.cell.2022.04.009. Epub 2022 Apr 8.

Efficient recall of Omicron-reactive B cell memory after a third dose of SARS-CoV-2 mRNA vaccine

Affiliations

Efficient recall of Omicron-reactive B cell memory after a third dose of SARS-CoV-2 mRNA vaccine

Rishi R Goel et al. Cell. .

Abstract

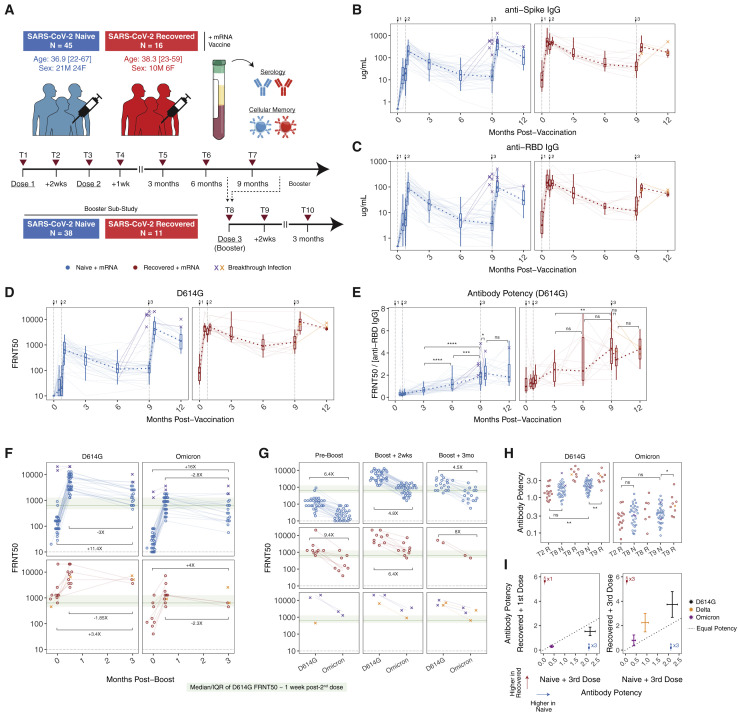
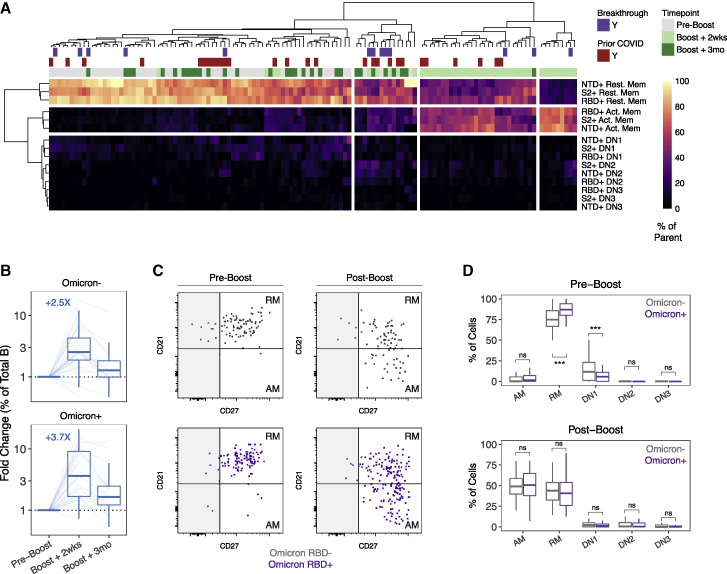
We examined antibody and memory B cell responses longitudinally for ∼9-10 months after primary 2-dose SARS-CoV-2 mRNA vaccination and 3 months after a 3rd dose. Antibody decay stabilized between 6 and 9 months, and antibody quality continued to improve for at least 9 months after 2-dose vaccination. Spike- and RBD-specific memory B cells remained durable over time, and 40%-50% of RBD-specific memory B cells simultaneously bound the Alpha, Beta, Delta, and Omicron variants. Omicron-binding memory B cells were efficiently reactivated by a 3rd dose of wild-type vaccine and correlated with the corresponding increase in neutralizing antibody titers. In contrast, pre-3rd dose antibody titers inversely correlated with the fold-change of antibody boosting, suggesting that high levels of circulating antibodies may limit the added protection afforded by repeat short interval boosting. These data provide insight into the quantity and quality of mRNA-vaccine-induced immunity over time through 3 or more antigen exposures.

Keywords: COVID-19; Omicron; SARS-CoV-2; antibody; booster; immune memory; mRNA; memory B cell; vaccine; variants of concern.


Conflict of interest statement

Declaration of interests S.E.H. has received consultancy fees from Sanofi Pasteur, Lumen, Novavax, and Merck for work unrelated to this study. A.R.G. is a consultant for Relation Therapeutics. E.J.W. is consulting for or is an advisor for Merck, Marengo, Janssen, Related Sciences, Synthekine, and Surface Oncology. E.J.W. is a founder of Surface Oncology, Danger Bio, and Arsenal Biosciences.

Figures

None
Graphical abstract
Figure 1
Figure 1
Antibody responses after 2 and 3 doses of mRNA vaccine (A) Study design and cohort characteristics. (B and C) (B) Anti-spike and (C) anti-RBD IgG concentrations over time in plasma samples from vaccinated individuals. (D) Pseudovirus (PSV) neutralization titers against wild-type D614G spike protein over time in plasma samples from vaccinated individuals. Data are represented as focus reduction neutralization titer 50% (FRNT50) values. (E) Antibody neutralization potency against D614G over time. Potency was calculated as neutralizing titer (FRNT50) divided by the paired concentration of anti-RBD IgG. (F and G) Plasma neutralizing activity against D614G and Omicron before and after booster vaccination. Dotted lines indicate limit of detection for the assay. Green boxes and lines indicate interquartile range (IQR) and median of D614G neutralizing titers ∼1 week following the second vaccine dose in SARS-CoV-2-naive subjects. (H and I) Comparison of antibody potency against D614G, Delta, and Omicron between SARS-CoV-2-naive and previously infected vaccinees. For (I), bars indicate mean with 95% confidence intervals. Statistics were calculated using unpaired nonparametric Wilcoxon test with Benjamini-Hochberg correction for multiple comparisons. Breakthrough infection samples were excluded from statistical comparisons. Median fold-changes for selected comparisons are indicated. p < 0.05; ∗∗p < 0.01; ∗∗∗p < 0.001; ∗∗∗∗p < 0.0001; ns, not significant. Binding antibody and D614G pseudovirus neutralization data from prevaccine baseline through 6 months postprimary vaccination were described previously (Goel et al., 2021a).
Figure S1
Figure S1
Gating strategy for identifying SARS-CoV-2-specific B cell responses, related to Figure 2 Single cells were identified based on FSC-A and FSC-H. Live cells were identified based on negative staining with Ghost 510 viability dye. Lymphocytes were identified from bulk PBMCs based on FSC-A and SSC-A. Total B cells were then identified from live lymphocytes as CD3 CD19+ cells. Memory B cell subsets were identified based on expression of IgD, CD20, CD27, and CD38. IgD+ CD27 naive B cells were excluded from all analysis. From non-naive B cells, memory B cells were identified as CD20+ CD38lo/intermediate and plasmablasts were identified as CD20lo CD38+. Antigen-specificity of memory B cells and plasmablasts was determined based on binding to fluorescently labeled antigen probes. First, a decoy probe (BV711-streptavidin) was used to exclude cells that nonspecifically bind streptavidin. Decoy negative cells were then assessed for binding to full-length SARS-CoV-2 spike protein or influenza hemagglutinin (HA) from the 2019 flu vaccine season. Spike+ B cells were subsequently analyzed for cobinding to a receptor-binding domain (RBD) probe. Regarding phenotype, immunoglobulin isotype (IgG, IgM, and IgA) was measured on all antigen-binding populations. CD71 was used as a marker of activated B cells.
Figure 2
Figure 2
Memory B cell responses after 2 and 3 doses of mRNA vaccine (A) Flow cytometry gating strategy for SARS-CoV-2-specific plasmablasts. (B) Frequency of spike+ plasmablasts ∼1 week after booster vaccination or postvaccine breakthrough infection. Data are represented as a percentage of total B cells. (C) Flow cytometry gating strategy for SARS-CoV-2-specific memory B cells. (D and E) (D) Frequency of spike+ and (E) spike+ RBD+ memory B cells over time in PBMCs from vaccinated individuals. Data are represented as a percentage of total B cells. (F and G) (F) Fold-change in the frequency of spike+ and (G) spike+ RBD+ memory B cells after booster vaccination relative to paired preboost samples. Median fold-change is indicated in dashed blue or red lines. Dashed black lines at fold-change = 1 indicate no change in frequency compared with preboost samples. (H) Isotype composition of spike+ memory B cells in vaccinated individuals pre and postboost. (I) Activation status of spike+ memory B cells over time in vaccinated individuals following booster vaccination. Statistics were calculated using unpaired nonparametric Wilcoxon test. p < 0.05; ∗∗p < 0.01; ∗∗∗p < 0.001; ∗∗∗∗p < 0.0001; ns, not significant. Memory B cell responses from prevaccine baseline through 6 months postprimary vaccination were reanalyzed from a previous dataset (Goel et al., 2021a). See also Figure S1.
Figure 3
Figure 3
Variant-reactive memory B cell responses after 2 and 3 doses of mRNA vaccine (A and B) (A) Experimental design and (B) flow cytometry gating strategy for SARS-CoV-2 variant-reactive memory B cells. (C) Frequency of NTD+, WT RBD+, all variant RBD+, and S2+ memory B cells in vaccinated individuals pre- and post-boost. (D) Fold-change in the frequency of antigen-specific memory B cells after booster vaccination relative to paired preboost samples. Median fold-change for each variable is indicated in dashed blue or red lines. Dashed black lines at fold-change = 1 indicate no change in frequency compared with preboost samples. (E) Variant cross-binding of RBD-specific memory B cells in vaccinated individuals. Data are represented as a percentage of WT RBD+ cells. (F) Boolean analysis of variant cross-binding memory B cell populations in vaccinated individuals ∼2 weeks after 3rd vaccination or at a cross-sectional time point in individuals with a postvaccine breakthrough infection. Pie charts indicate the fraction of WT RBD+ memory B cells that cross-bind zero, one, two, three, or four variant RBDs. Colored arcs indicate cross-binding to specific variants. (G) Comparison of RBD variant cross-binding between SARS-CoV-2-naive and previously infected vaccinees before and ∼2 weeks after 3rd vaccination. For (G), bars indicate mean with 95% confidence intervals. Statistics were calculated using unpaired nonparametric Wilcoxon test with Benjamini-Hochberg correction for multiple comparisons. Breakthrough infection samples were excluded from statistical comparisons. p < 0.05; ∗∗p < 0.01; ∗∗∗p < 0.001; ∗∗∗∗p < 0.0001; ns, not significant. See also Figure S2.
Figure S2
Figure S2
Gating strategy for identifying SARS-CoV-2 variant-reactive memory B cell populations, related to Figures 3 and 4 B cells were pre-enriched from total PBMCs by negative selection with a STEMCELL isolation kit. Lymphocytes were identified based on FSC-A and SSC-A. Single cells were identified based on FSC-A and FSC-H. Live cells were identified based on negative staining with Ghost 510 viability dye. Total B cells were then identified from live lymphocytes as CD3 CD19+ cells. IgD+ naive B cells were excluded from all analysis. From non-naive B cells, plasmablasts were identified as CD27++ CD38+ and excluded. Antigen-specificity of memory B cells was determined based on binding to fluorescently labeled antigen probes. First, a decoy probe (BUV615-streptavidin) was used to exclude cells that nonspecifically bind streptavidin. Decoy negative cells were then assessed for binding to full-length SARS-CoV-2 spike protein or SARS-CoV-2-nucleocapsid protein. Spike+ B cells were subsequently analyzed for cobinding to NTD and S2 probes. Spike+ B cells that did not bind NTD or S2 were analyzed for binding to wild-type receptor-binding domain (RBD) probe. Cross-binding to Alpha, Beta, Delta, and Omicron variant RBD probes was measured on WT RBD-specific B cells. Regarding phenotype, memory B cell subsets were identified based on CD11c, CD21, and CD27 staining. CD21+ CD27+ B cells were defined as resting memory and CD21 CD27+ B cells were defined as activated memory. CD27 memory B cells were split into double-negative (DN) subsets based on CD11c and CD21 staining.
Figure 4
Figure 4
Activation of Omicron-reactive B cell memory after a 3rd dose of mRNA vaccine (A) Heatmap and hierarchal clustering of memory B cell activation status by antigen specificity at pre- and post-3rd dose time points. Prior COVID infection and/or postvaccine breakthrough infection are indicated. (B) Median fold-change in the frequency of Omicron RBD-binding versus nonbinding memory B cells after booster vaccination relative to paired preboost samples. Dashed black lines at fold-change = 1 indicate no change in frequency compared with preboost samples. (C) Representative flow cytometry plots for activation phenotype of Omicron RBD-binding versus Omicron RBD nonbinding (but still wild-type RBD binding) memory B cells. (D) Frequency of activated memory (AM), resting memory (RM), or double-negative (DN) subsets in Omicron RBD-binding versus nonbinding memory B cells before and ∼2 weeks after a 3rd vaccination. For (B)–(D), analysis was restricted to SARS-CoV-2-naive vaccinees with no breakthrough infection. Statistics were calculated using paired nonparametric Wilcoxon test with Benjamini-Hochberg correction for multiple comparisons. p < 0.05; ∗∗p < 0.01; ∗∗∗p < 0.001; ∗∗∗∗p < 0.0001; ns, not significant. See also Figure S2.
Figure 5
Figure 5
Immune relationships after 2 and 3 doses of mRNA vaccine (A) UMAP of antibody and memory B cell responses to mRNA vaccination. Data points represent individual participants and are colored by time point relative to primary vaccine. (B) UMAP coordinates of SARS-CoV-2-naive and SARS-CoV-2-recovered subjects over time. Labels indicate centroids for each group at the indicated time point. Breakthrough infection samples were excluded from calculations of group centroids. (C) Correlation matrix of antibody and memory B cell responses over time in SARS-CoV-2-naive subjects. (D) Correlation of preboost RBD+ memory B cell frequencies with neutralizing antibody recall responses to D614G and Omicron. Recall responses were calculated as the difference between pre- and post-boost titers ∼2 weeks after the 3rd vaccine dose. (E) Change in binding and neutralizing antibody responses after a 3rd vaccine dose in individuals with 3 versus 4 exposures to SARS-CoV-2 antigen (∼2 weeks post-3rd dose in SARS-CoV-2-naive and SARS-CoV-2-recovered individuals), calculated as in (D). Dotted lines indicate no change in antibodies. (F) Correlation of preboost binding antibody responses with change in antibody responses after boost, calculated as in (D). (G) Peak binding and neutralizing antibody levels after 3 versus 4 exposures to SARS-CoV-2 antigen. Dotted lines indicate the limit of detection for the assay. (H) Correlation of preboost binding antibody levels with peak postboost antibody levels. (I) Fold-change in antibody responses after 3 versus 4 exposures to SARS-CoV-2 antigen. Dotted lines indicate no change in antibodies. (J) Correlation of fold-change in antibody responses after boosting with pre-3rd dose antibody levels. Statistics were calculated using unpaired nonparametric Wilcoxon tests with Benjamini-Hochberg correction for multiple comparisons. All correlations were calculated using nonparametric Spearman rank correlation. p < 0.05; ∗∗p < 0.01; ∗∗∗p < 0.001; ∗∗∗∗p < 0.0001; ns, not significant. See also Figure S3.
Figure S3
Figure S3
Expanded analysis of immune relationships and correlation of antibody boosting with time since primary vaccination, related to Figure 5 (A) UMAP of antibody and memory B cell responses to mRNA vaccination, including Omicron neutralization titers, variant-binding memory B cell frequencies, and memory B cell phenotypes. Data points represent individual participants and are colored by time point: 9 months, pre-boost; 9.5 months, boost + 2 weeks; 12 months, boost + 3 months. (B) Kernel density plots of Omicron neutralizing antibodies and all variant+ memory B cells. Red contours represent areas of UMAP space that are enriched for indicated immune components. (C) Correlation matrix of antibody and memory B cell responses over time in SARS-CoV-2-naive subjects. (D) Correlation of preboost wild-type and variant-reactive RBD+ memory B cell frequencies with neutralizing antibody recall responses to D614G and Omicron. Recall responses were calculated as the difference between pre and post-boost titers ∼2 weeks after the 3rd vaccine dose. (E) Correlation of peak postboost antibody levels (∼2 weeks after the 3rd dose) with days since primary vaccination. (F) Correlation of fold-change in antibody responses after boosting with days since primary vaccination. All correlations were calculated using nonparametric Spearman rank correlation. p < 0.05; ∗∗p < 0.01; ∗∗∗p < 0.001; ∗∗∗∗p < 0.0001; ns, not significant.

Update of

References

    1. Bournazos S., Ravetch J.V. Fcγ receptor function and the design of vaccination strategies. Immunity. 2017;47:224–233. - PMC - PubMed
    1. Cameroni E., Bowen J.E., Rosen L.E., Saliba C., Zepeda S.K., Culap K., Pinto D., VanBlargan L.A., de Marco A., di Iulio J., et al. Broadly neutralizing antibodies overcome SARS-CoV-2 Omicron antigenic shift. Nature. 2022;602:664–670. - PMC - PubMed
    1. Carvalho T., Krammer F., Iwasaki A. The first 12 months of COVID-19: a timeline of immunological insights. Nat. Rev. Immunol. 2021;21:245–256. - PMC - PubMed
    1. Cele S., Jackson L., Khoury D.S., Khan K., Moyo-Gwete T., Tegally H., San J.E., Cromer D., Scheepers C., Amoako D.G., et al. Omicron extensively but incompletely escapes Pfizer BNT162b2 neutralization. Nature. 2021;602:654–656. - PMC - PubMed
    1. Chatterjee D., Tauzin A., Marchitto L., Gong S.Y., Boutin M., Bourassa C., Beaudoin-Bussières G., Bo Y., Ding S., Laumaea A., et al. SARS-CoV-2 Omicron spike recognition by plasma from individuals receiving BNT162b2 mRNA vaccination with a 16-week interval between doses. Cell Rep. 2022;38:110429. - PMC - PubMed

Publication types

Supplementary concepts