. 2022 May 26;185(11):1905-1923.e25.
doi: 10.1016/j.cell.2022.04.015. Epub 2022 May 5.

Lineage tracing reveals the phylodynamics, plasticity, and paths of tumor evolution

Affiliations

Lineage tracing reveals the phylodynamics, plasticity, and paths of tumor evolution

Dian Yang et al. Cell. .

Abstract

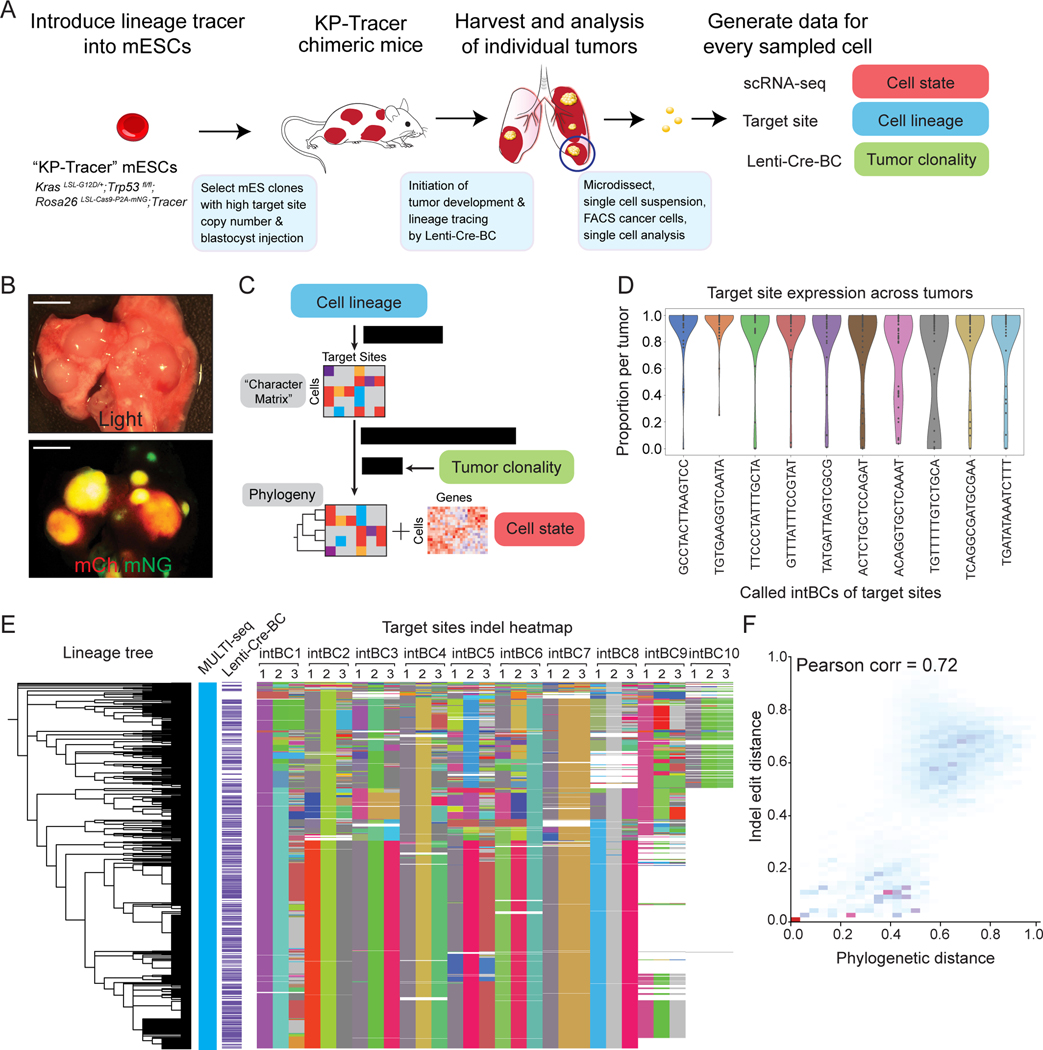
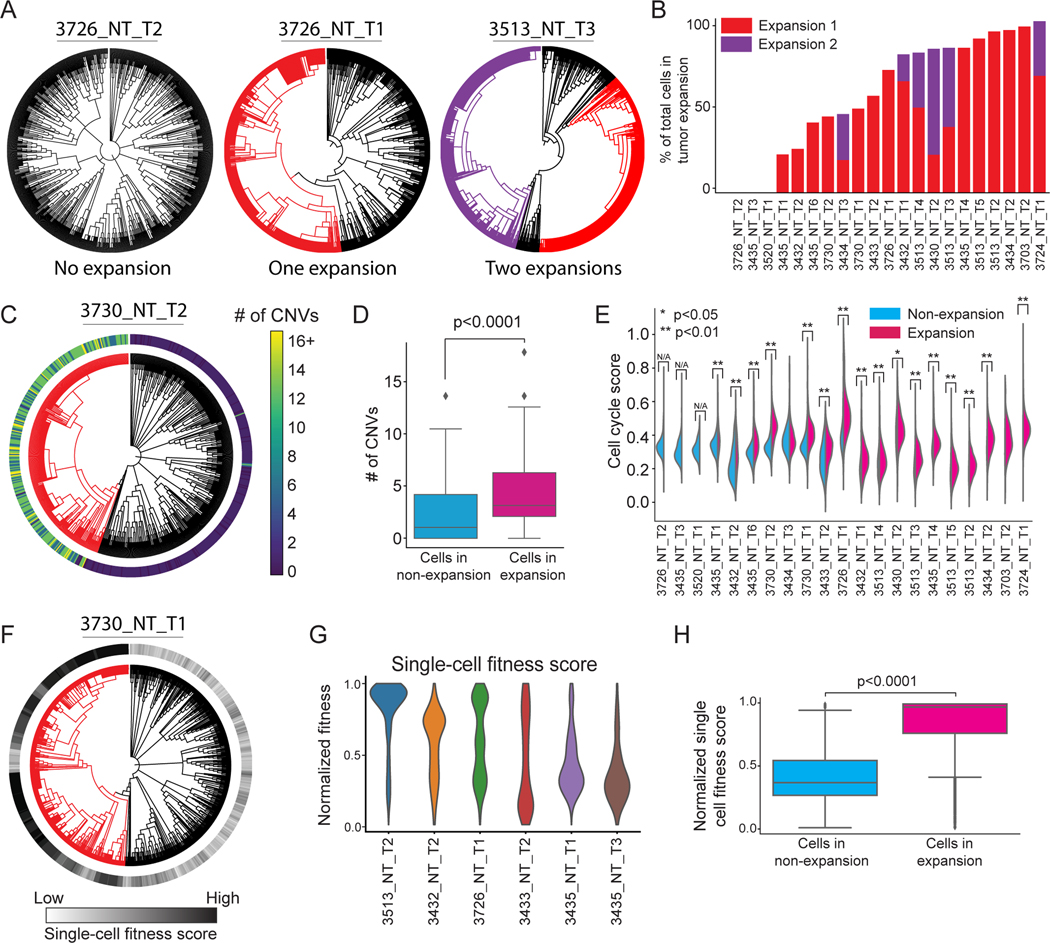
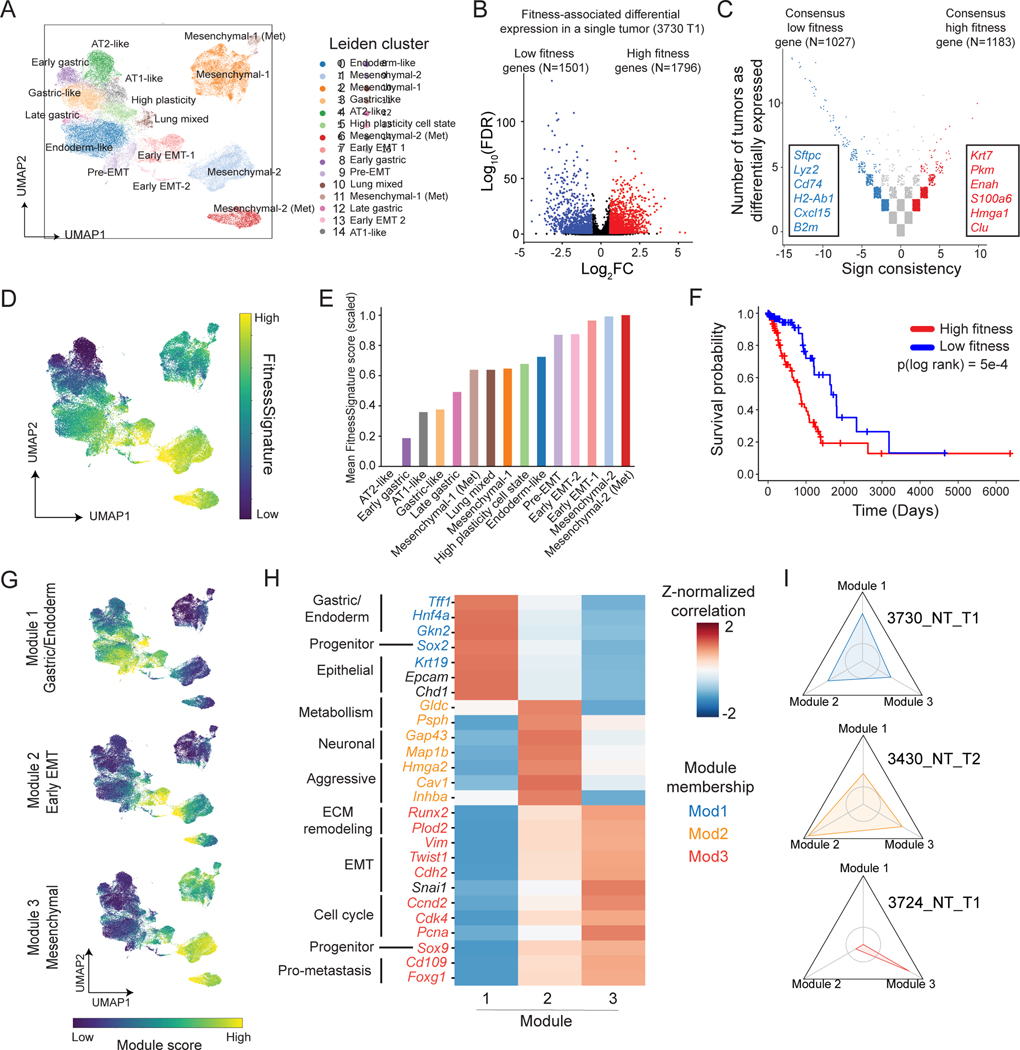
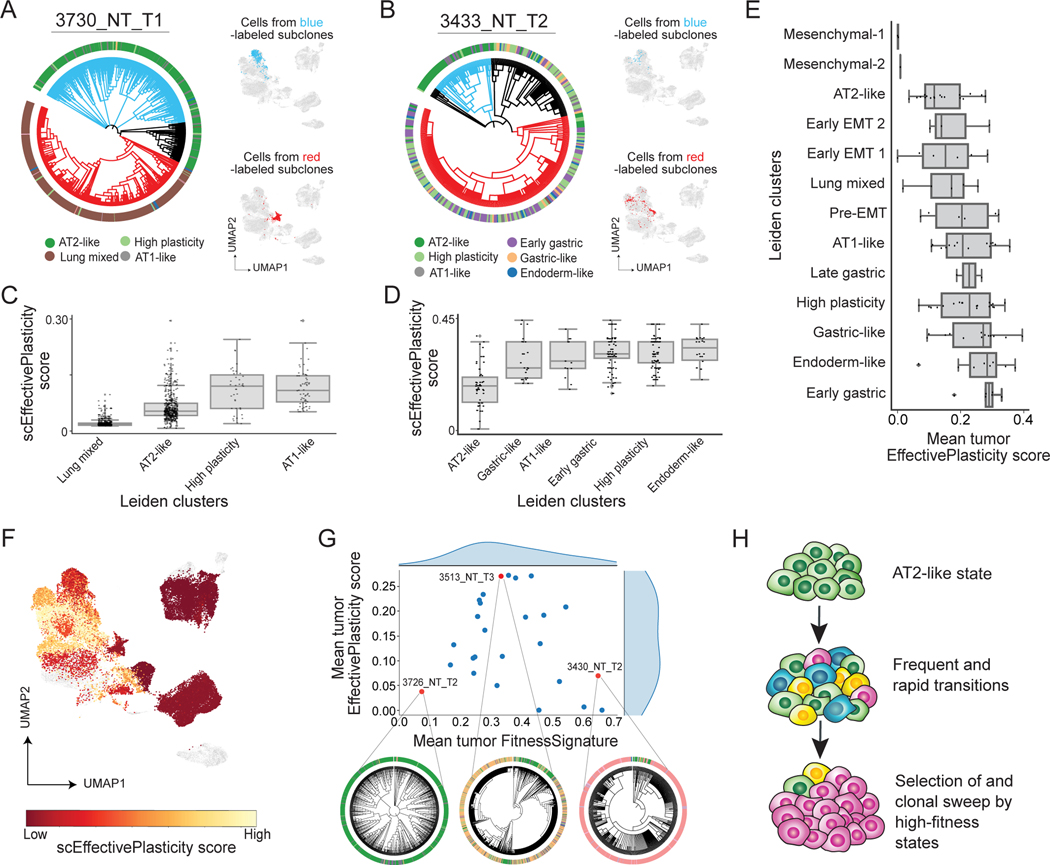
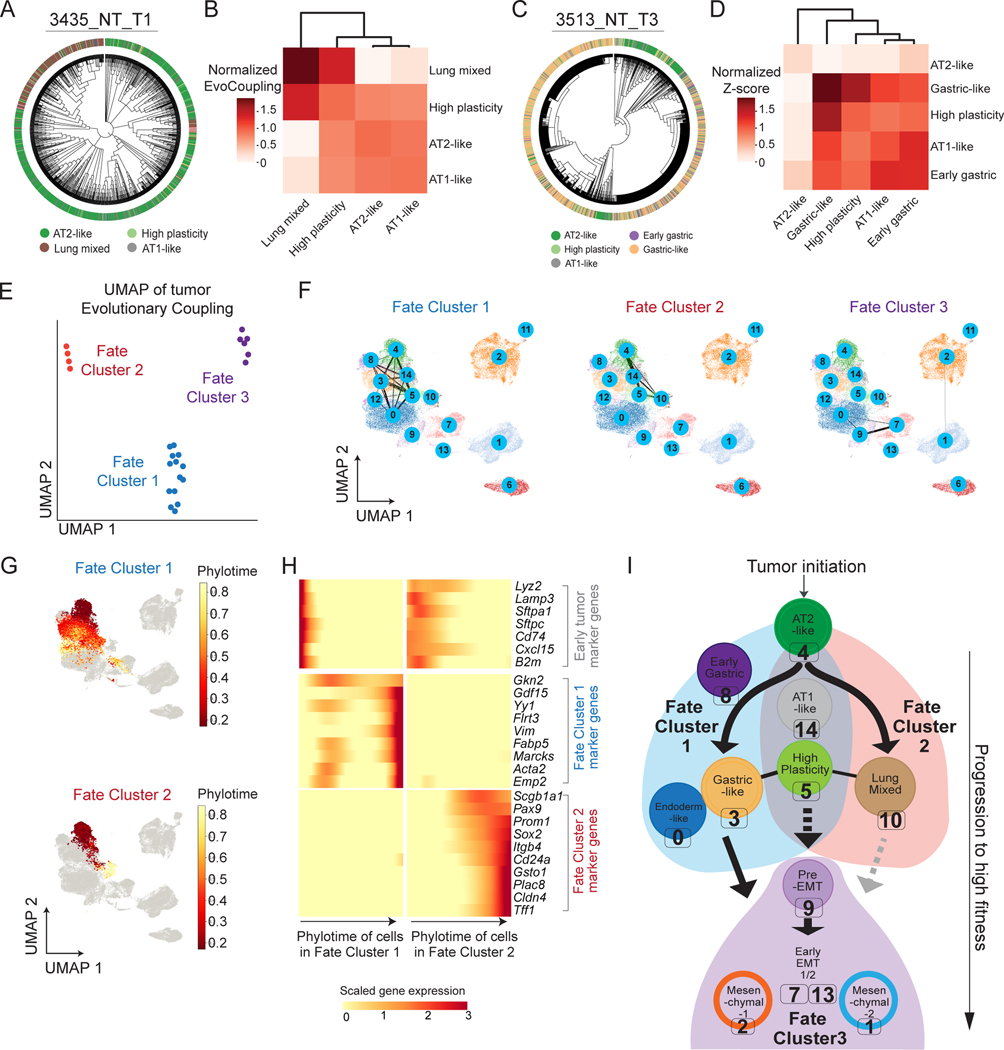
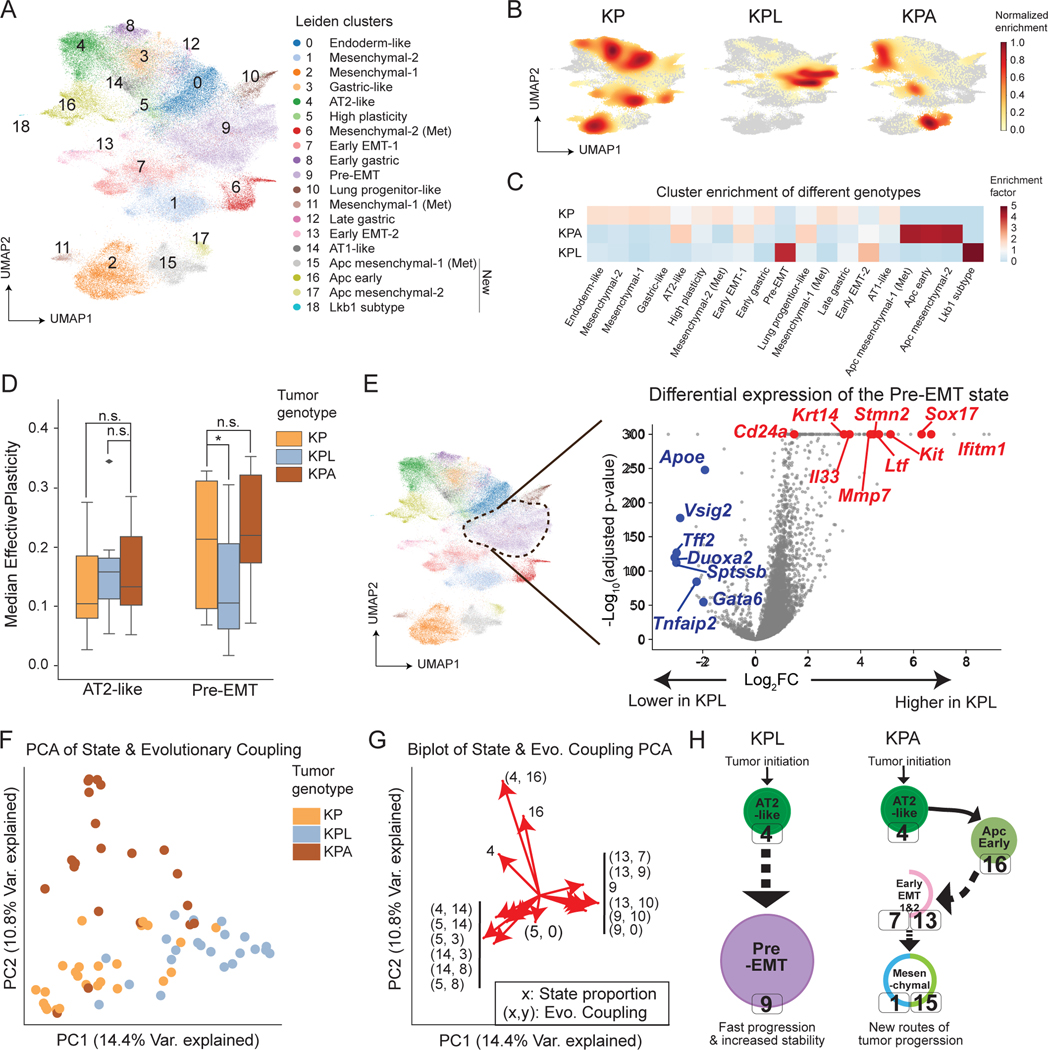
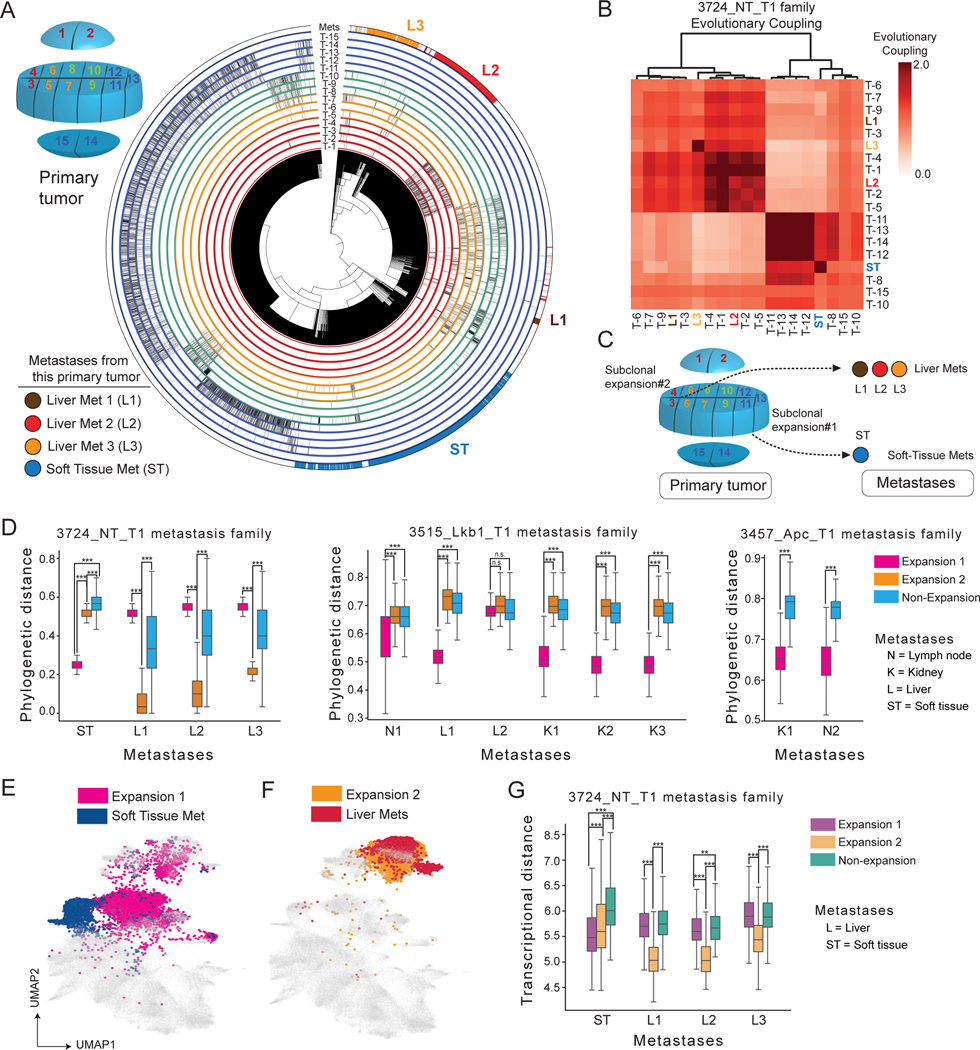
Tumor evolution is driven by the progressive acquisition of genetic and epigenetic alterations that enable uncontrolled growth and expansion to neighboring and distal tissues. The study of phylogenetic relationships between cancer cells provides key insights into these processes. Here, we introduced an evolving lineage-tracing system with a single-cell RNA-seq readout into a mouse model of Kras;Trp53(KP)-driven lung adenocarcinoma and tracked tumor evolution from single-transformed cells to metastatic tumors at unprecedented resolution. We found that the loss of the initial, stable alveolar-type2-like state was accompanied by a transient increase in plasticity. This was followed by the adoption of distinct transcriptional programs that enable rapid expansion and, ultimately, clonal sweep of stable subclones capable of metastasizing. Finally, tumors develop through stereotypical evolutionary trajectories, and perturbing additional tumor suppressors accelerates progression by creating novel trajectories. Our study elucidates the hierarchical nature of tumor evolution and, more broadly, enables in-depth studies of tumor progression.

Keywords: fitness; genetically engineered mouse model; lineage tracing; lung cancer; phylogenetics; plasticity; single cell; transcriptome heterogeneity; tumor evolution.


Conflict of interest statement

Declaration of interests J.S.W. declares outside interest in 5 AM Venture, Amgen, Chroma Medicine, KSQ Therapeutics, Maze Therapeutics, Tenaya Therapeutics, and Tessera Therapeutics. T.J. is a member of the Board of Directors of Amgen and Thermo Fisher Scientific, is a co-founder of Dragonfly Therapeutics and T2 Biosystems, and is the president of Break Through Cancer. T.J. serves on the Scientific Advisory Board of Dragonfly Therapeutics, SQZ Biotech, and Skyhawk Therapeutics. None of these affiliations represent a conflict of interest with respect to this study. T.G.B. is an advisor to Array BioPharma, Revolution Medicines, Novartis, AstraZeneca, Takeda, Springworks, Jazz Pharmaceuticals, Relay Therapeutics, Rain Therapeutics, and Engine Biosciences and receives research funding from Novartis, Strategia, Kinnate, and Revolution Medicines. J.M.R. consults for Maze Therapeutics and Waypoint Bio. Z.J.G. is an equity holder in Scribe Biosciences and Provenance bio and a member of the SAB of Serotiny Bio.

Figures

Figure 1.
Figure 1.. KP-Tracer mouse enables continuous and high-resolution lineage tracing of tumor initiation and progression.
(A) Generation of the KP-Tracer chimeric mouse and initiation of KP-Tracer tumors (STAR Methods). Five to six months after tumor initiation, individual tumors are dissociated into single cell suspension and single cell sequencing libraries are prepared. (B) Representative images of tumors from KP-Tracer mouse. Tumors are positive for mCherry and mNeonGreen. Scale bars = 5 mm. (C) Tumor lineage reconstruction data analysis pipeline. (D) Target site capture efficiency across tumors from mice generated from one representative mESC clone (2E1). Dots represent the average capture rate of a specific target site in a tumor. (E) Phylogeny with MULTI-seq, lenti-Cre-BC, and target site information for an example tumor. Each row represents a single cell and each column indicates barcode or target site information (ordered by the percentage of target sites detected across cells). Unique colors represent unique barcodes or indels, uncut sites are shown in light-gray, and missing data is indicated in white. (F) Comparison of phylogenetic distance (from the reconstructed tree) and allele edit distance (from target sites) for the example tumor in (E). See also Figure S1 and Table S1
Figure 2.
Figure 2.. Rare subclones expand during tumor progression, marked by increased DNA copy number variation, cell cycle score, and fitness score.
(A) Example tumor phylogenies with expansions highlighted with red or purple branches. (B) The number of expansions and percentage of expanding cells across tumors. Tumors are ranked by the total percentage of cells in expanding subclones. (C) CNV numbers per cell (outer bar) in expanding (red) versus non-expanding (black) cells of an example tumor. (D) Comparison of CNV number per cell in expansions versus non-expansions (Permutation test, p<0.0001). (E) Comparison of cell cycle transcriptional scores of cells from the expanding and non-expanding subclones (two-sided Mann-Whitney U test, * p<0.05, ** p<0.01). Tumors without expansions are labeled as N/A. (F-H) Phylogenetic single-cell fitness scores in expansions. (F) A representative tumor phylogeny with single-cell fitness scores overlaid. (G) Single cell fitness scores in representative tumors. (H) Cancer cells from expansions have significantly higher single-cell fitness scores (two-sided Mann-Whitney U test, p < 0.0001). See also Figure S2.
Figure 3.
Figure 3.. Integration of phylodynamics and transcriptome uncovers fitness-associated gene programs for KP tumors.
(A) Gene expression UMAP and clustering of cancer cells from KP-Tracer tumors. (B-C) Identification of a transcriptional FitnessSignature. (B) Differential expression analysis identifies genes positively (red) and negatively (blue) associated with single-cell fitness (C) Meta-analysis of fitness-associated genes across all KP tumors. (D) Gene expression UMAP annotated by individual cells’ single cell FitnessSignature scores (normalized to a 0–1 scale). (E) Average FitnessSignature scores of each Leiden cluster (normalized to 0–1). Colors reflect the Leiden clusters in (A). (F) Kaplan-Meier survival analysis of TCGA lung adenocarcinoma patients (n=495) stratified into high (red) and low (blue) groups based on gene expression of the derived transcriptional FitnessSignature. (Log-rank test, p=5e-4). (G) Gene expression UMAP annotated with transcriptional scores of the three fitness gene modules. (H) Heatmap of Z-normalized Pearson’s correlations between marker gene expression and fitness module scores for selected differentially expressed genes with manual annotations. Genes are colored by assigned fitness gene module; genes in black indicate helpful markers that did not appear in a fitness module. (I) Personality plots of three representative tumors displaying the fold change in fitness module scores of individual expansions compared to the non-expanding regions. Vertices indicate individual fitness modules. Axes are normalized to 0.4 – 2.2-fold change observed across tumors. Inner circle represents a fold change of 1 (no change) and values greater than 1 indicate the cells in expansions exhibiting enriched usage of the particular fitness gene module. Colors (see (H)) reflect the module a tumor expansion is characterized by. See also Figure S3 and Table S2 and S3.
Figure 4.
Figure 4.. Intratumoral transcriptional heterogeneity is driven by transient increases in plasticity of cell states.
(A-B) Representative tumors with (A) low EffectivePlasticity and (B) high EffectivePlasticity. Outer bar indicates the Leiden cluster of single cells (as in 3A). Selected clades are highlighted on the gene expression UMAP to the right of phylogenies. (C-D) Quantification of scEffectivePlasticity for each transcriptional state (Leiden cluster) for tumors in (A) and (B). Each dot represents a single cell’s EffectivePlasticity. (E) Distribution of mean EffectivePlasticity scores for each Leiden cluster across KP tumors. Each dot represents a Leiden cluster’s mean EffectivePlasticity within a tumor. Leiden clusters are ranked by the mean of the distribution across tumors. (F) scEffectivePlasticity score overlaid onto the gene expression UMAP. Cells marked in grey are from metastases and not included. (G) Relationship between tumor average FitnessSignature and EffectivePlasticity. Three representative phylogenies are displayed with Leiden cluster annotations (outer circle). (H) A model describing changes of transcriptome heterogeneity and EffectivePlasticity following tumor progression. See also Figure S4.
Figure 5.
Figure 5.. Mapping the phylogenetic relationships between cell states reveals common paths of tumor evolution.
(A-D) Transcriptional state relationships of representative tumors are quantified with Evolutionary Couplings. (A, C) Phylogenies of tumors 3435_NT_T1 and 3513_NT_T3 with overlaid Leiden cluster annotations (colors from Fig 3A). (B, D) Corresponding normalized Evolutionary Couplings between Leiden clusters in each tumor. (E) UMAP projection of KP tumor Evolutionary Couplings annotated by identified “Fate Clusters” (see Fig S5F). Dots correspond to tumors. (F) Aggregated Evolutionary Couplings between transcriptional states of tumors from each Fate Cluster visualized on the gene expression UMAP. Thickness of bars reflect the average magnitude of couplings across tumors in a Fate Cluster. (G) Gene expression UMAP annotated by Phylotime of single cells from tumors in Fate Cluster 1 (top) and 2 (bottom) (normalized to 0–1). Cells from tumors that do not appear in the Fate Cluster of interest are shown in gray. (H) Significant gene expression changes along Phylotime for Fate Cluster 1 and 2 across Phylotime quantiles. Genes are annotated by their assigned Fate Cluster. Colors in heatmap are library-normalized gene expression, Z-normalized across quantiles of both Fate Clusters. (I) Summary of major paths of KP tumor progression. Solid lines indicate direct evidence of Evolution Couplings; dotted lines indicate couplings likely involving unobserved intermediate states; gray lines indicate couplings that are supported by rare examples. See also Figure S5 and Table S4 and S5.
Figure 6.
Figure 6.. Loss of tumor suppressors alters tumor transcriptome, plasticity and evolutionary trajectory.
(A) Batch corrected and integrated gene expression UMAP of all cancer cells from KP, KPL and KPA tumors annotated by 19 Leiden clusters (STAR Methods). (B) Density plots of cancer cells from KP, KPL and KPA tumors on the UMAP. (C) Enrichment of genotypes in each Leiden cluster. Enrichments below 1 are colored blue; enrichments above 1 are colored red. (D) Median EffectivePlasticity scores in selected Leiden clusters across genotypes (one-sided Mann-Whitney U Test, *p≤0.05, n.s. = not significant). (E) Genes up-regulated (red) and down-regulated (blue) in the Pre-EMT state of KPL tumors compared to KP and KPA tumors combined. (F) PCA of Evolutionary Coupling and transcriptional state proportion vectors for all tumors analyzed across genotypes. Each dot represents a tumor.(G) Biplot of top 10 features per principal component from PCA analysis shown in (F). Evolutionary Couplings are shown as tuples (x, y); transcriptional state proportions are shown as a single number x indicating Leiden cluster ID. (H) Summary of major evolutionary paths in KPL and KPA tumors. Solid lines indicate direct evidence of Evolution Couplings between transcriptome states, dotted lines indicate couplings that likely involve unobserved intermediate cell states. See also Figure S6 and Table S2, S3 and S4.
Figure 7.
Figure 7.. Metastases originate from spatially localized, expanding subclones of primary tumors.
(A) Multi-region analysis of tumor-metastasis family 3724_NT_T1. Top left inset showed the relative spatial location of tumor pieces. The phylogeny of the primary tumor and metastases is annotated via peripheral radial tracks for each color-coded region of the tumor (matching the inset) and four metastases. (B) Heatmap of Evolutionary Couplings of primary tumor pieces (black) and 4 related metastases (matching colors in (A)) from the 3724_NT_T1 tumor-metastasis family. (C) Summary of the spatial-phylogenetic relationship of the tumor-metastasis family 3724_NT_T1. (D) Single-cell phylogenetic distance of each metastasis to the non-expanding and expanding subclones in its related primary tumor. Each box represents the distribution of phylogenetic distances from a metastasis to a defined region of its related primary tumor (one-sided Mann-Whitney U test are indicated: ***p<0.0001, n.s. = not significant). (E-F) Gene expression UMAP annotated by metastases and their original subclones in 3724_NT_T1. Cells that are not relevant to the comparison in each panel are shown in gray. (G) Transcriptional distances between expanding regions of 3724_NT_T1 and its four metastases (one-sided Mann-Whitney U test are indicated: **p < 0.001, ***p<0.0001). See also Figure S7.

Comment in

Similar articles

Cited by

References

    1. Abbosh Christopher, Birkbak Nicolai J., Wilson Gareth A., Jamal-Hanjani Mariam, Constantin Tudor, Salari Raheleh, Le Quesne John, et al. 2017. “Phylogenetic ctDNA Analysis Depicts Early-Stage Lung Cancer Evolution.” Nature 545 (7655): 446–51. - PMC - PubMed
    1. Adamson Britt, Norman Thomas M., Jost Marco, Cho Min Y., Nuñez James K., Chen Yuwen, Villalta Jacqueline E., et al. 2016. “A Multiplexed Single-Cell CRISPR Screening Platform Enables Systematic Dissection of the Unfolded Protein Response.” Cell 167 (7): 1867–82.e21. - PMC - PubMed
    1. Alemany Anna, Florescu Maria, Baron Chloé S., Peterson-Maduro Josi, and van Oudenaarden Alexander. 2018. “Whole-Organism Clone Tracing Using Single-Cell Sequencing.” Nature 556 (7699): 108–12. - PubMed
    1. Amirouchene-Angelozzi Nabil, Swanton Charles, and Bardelli Alberto. 2017. “Tumor Evolution as a Therapeutic Target.” Cancer Discovery 7(8), pp.805–817. - PubMed
    1. Arnal-Estapé Anna, Cai Wesley L., Albert Alexandra E., Zhao Minghui, Stevens Laura E., López-Giráldez Francesc, Patel Kiran D., et al. 2020. “Tumor Progression and Chromatin Landscape of Lung Cancer Are Regulated by the Lineage Factor GATA6.” Oncogene 39 (18): 3726–37. - PMC - PubMed

Publication types