. 2022 May 17;61(10):843-855.
doi: 10.1021/acs.biochem.1c00740. Epub 2022 May 6.

The N-Terminus of Human Sulfotransferase 2B1b─a Sterol-Sensing Allosteric Site

Affiliations

The N-Terminus of Human Sulfotransferase 2B1b─a Sterol-Sensing Allosteric Site

Ian Cook et al. Biochemistry. .

Abstract

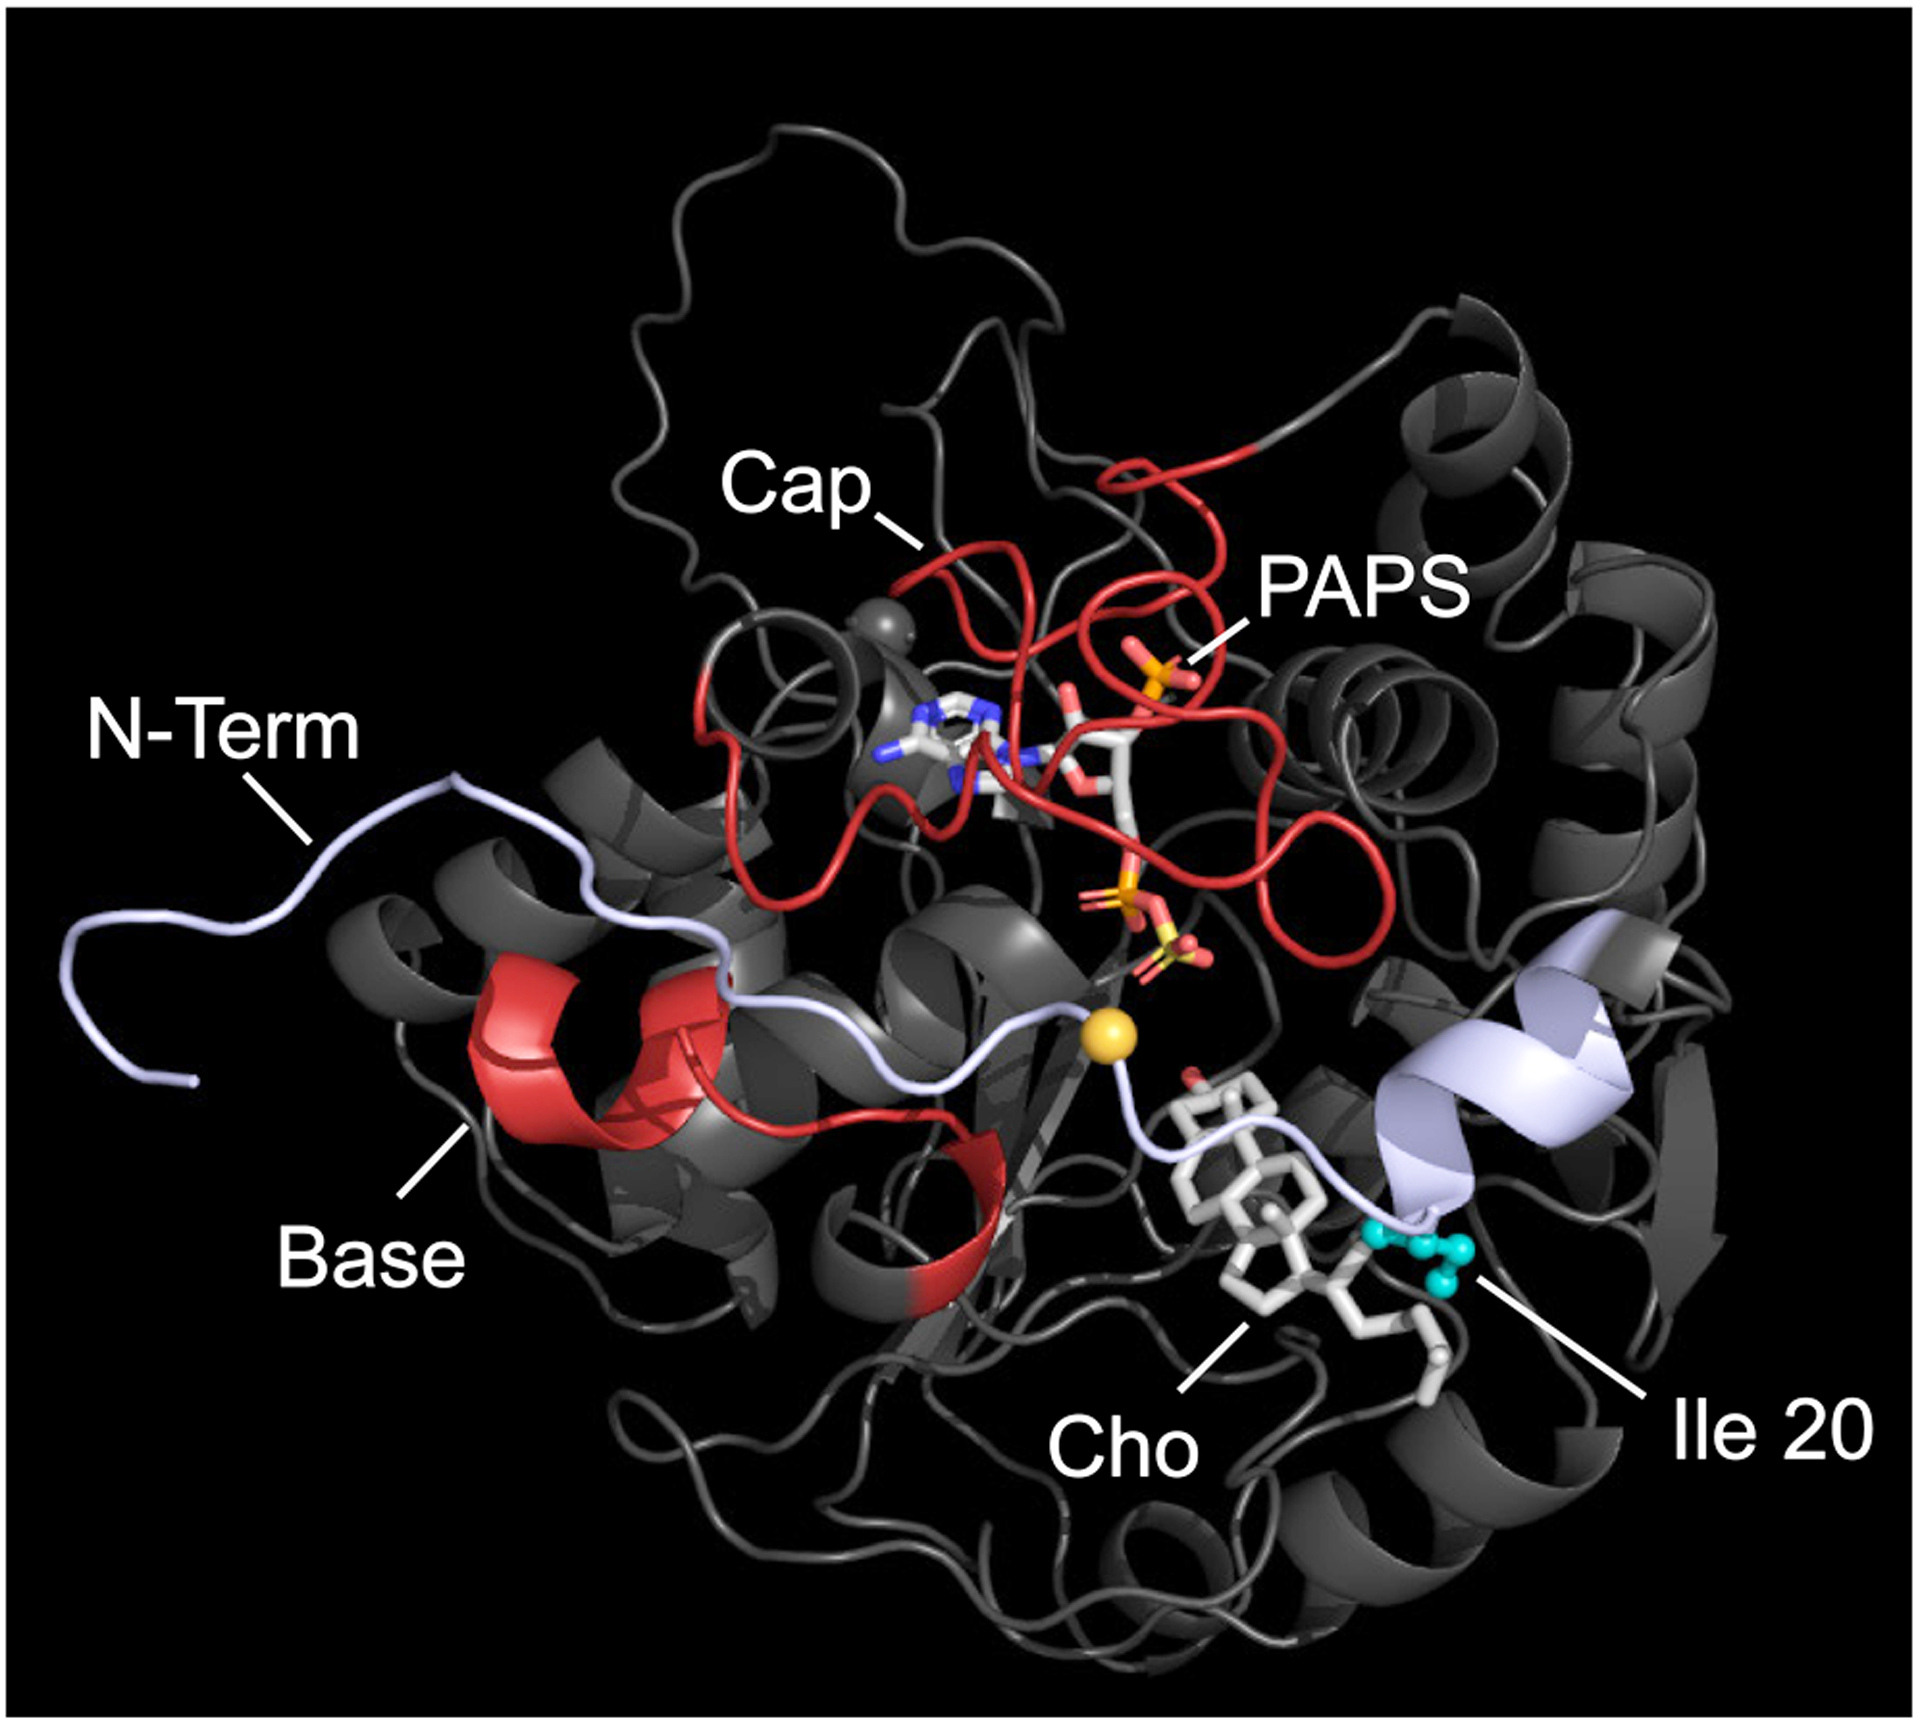
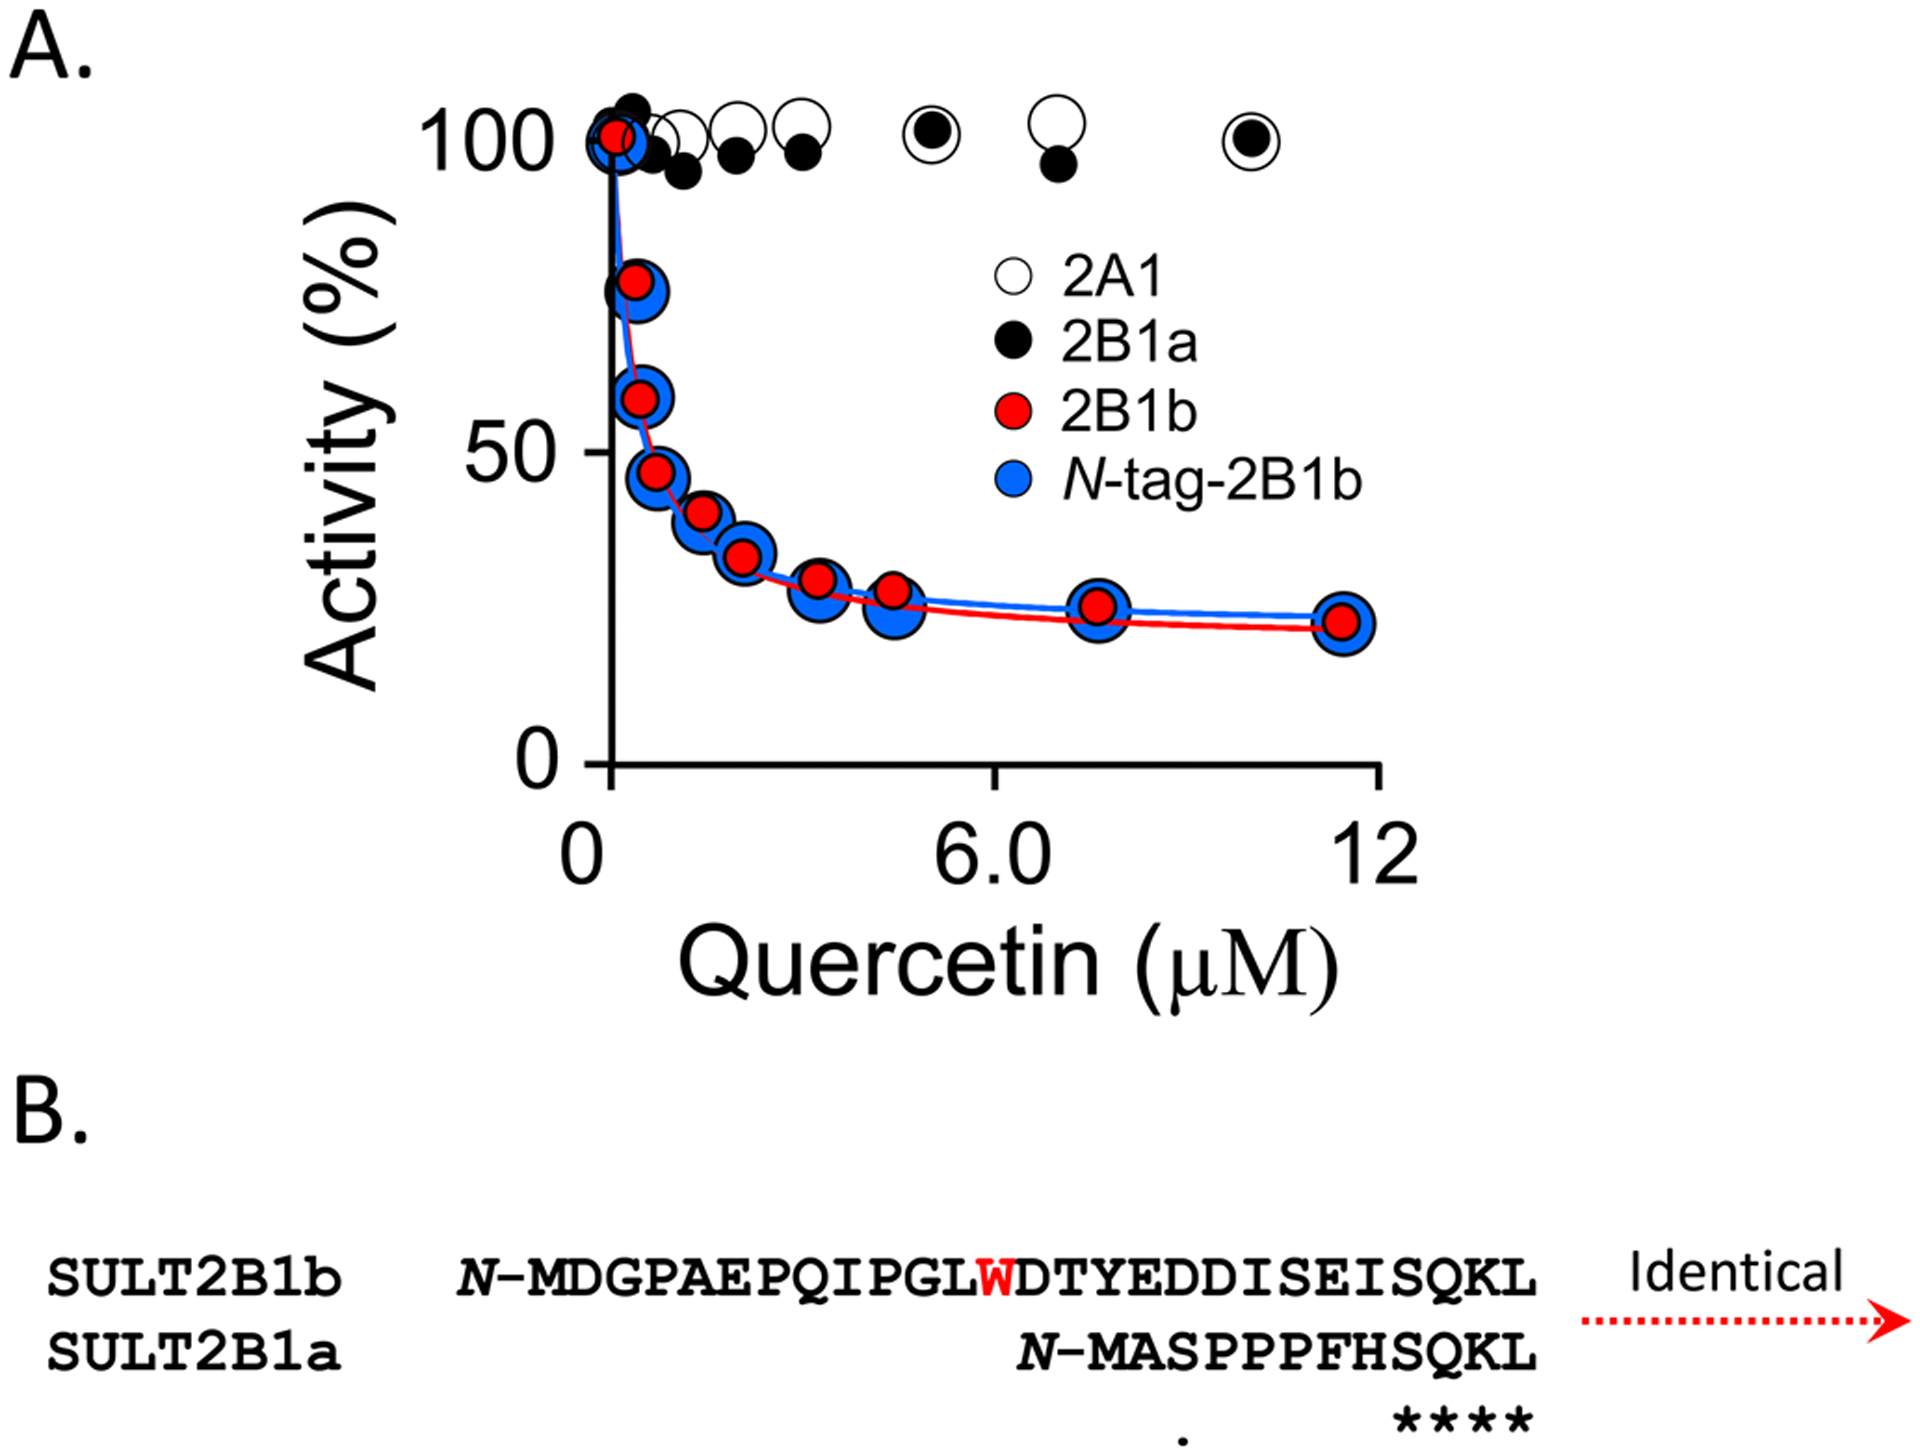
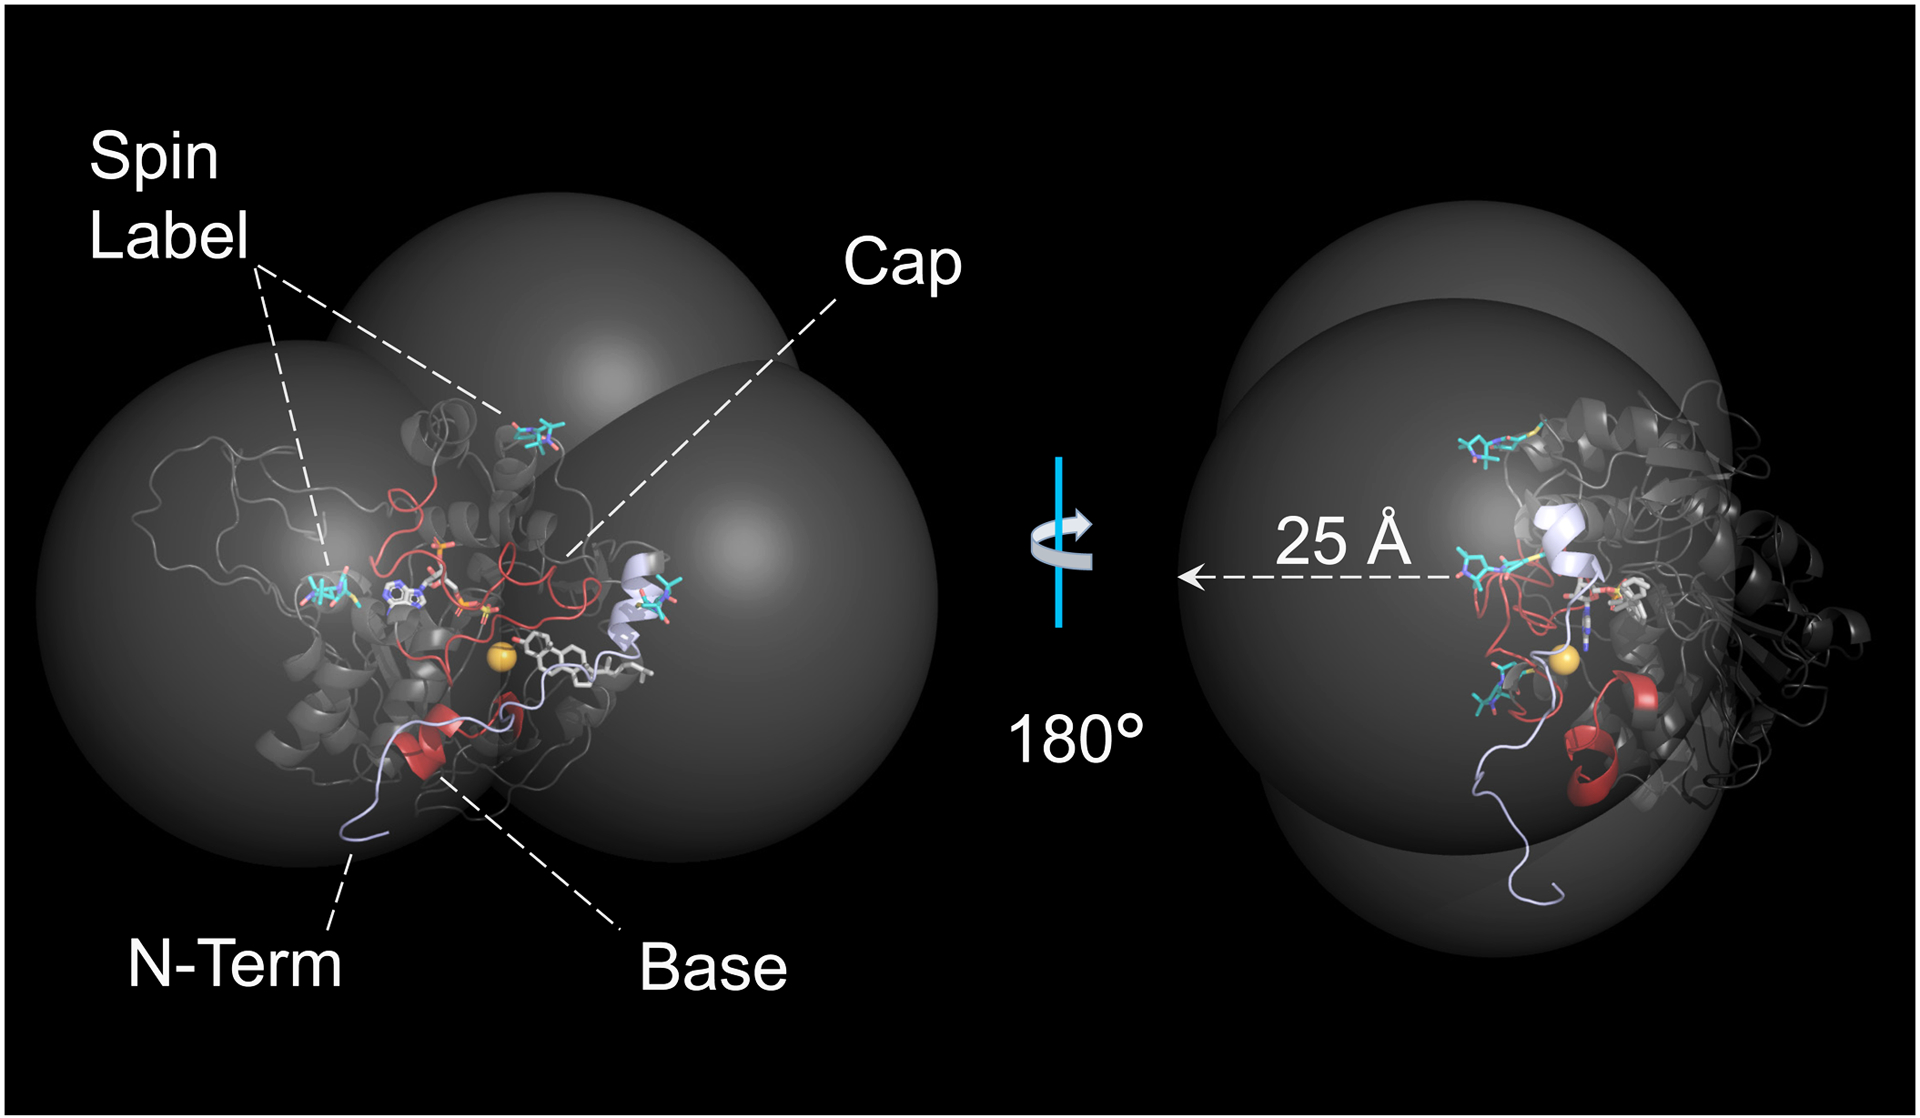
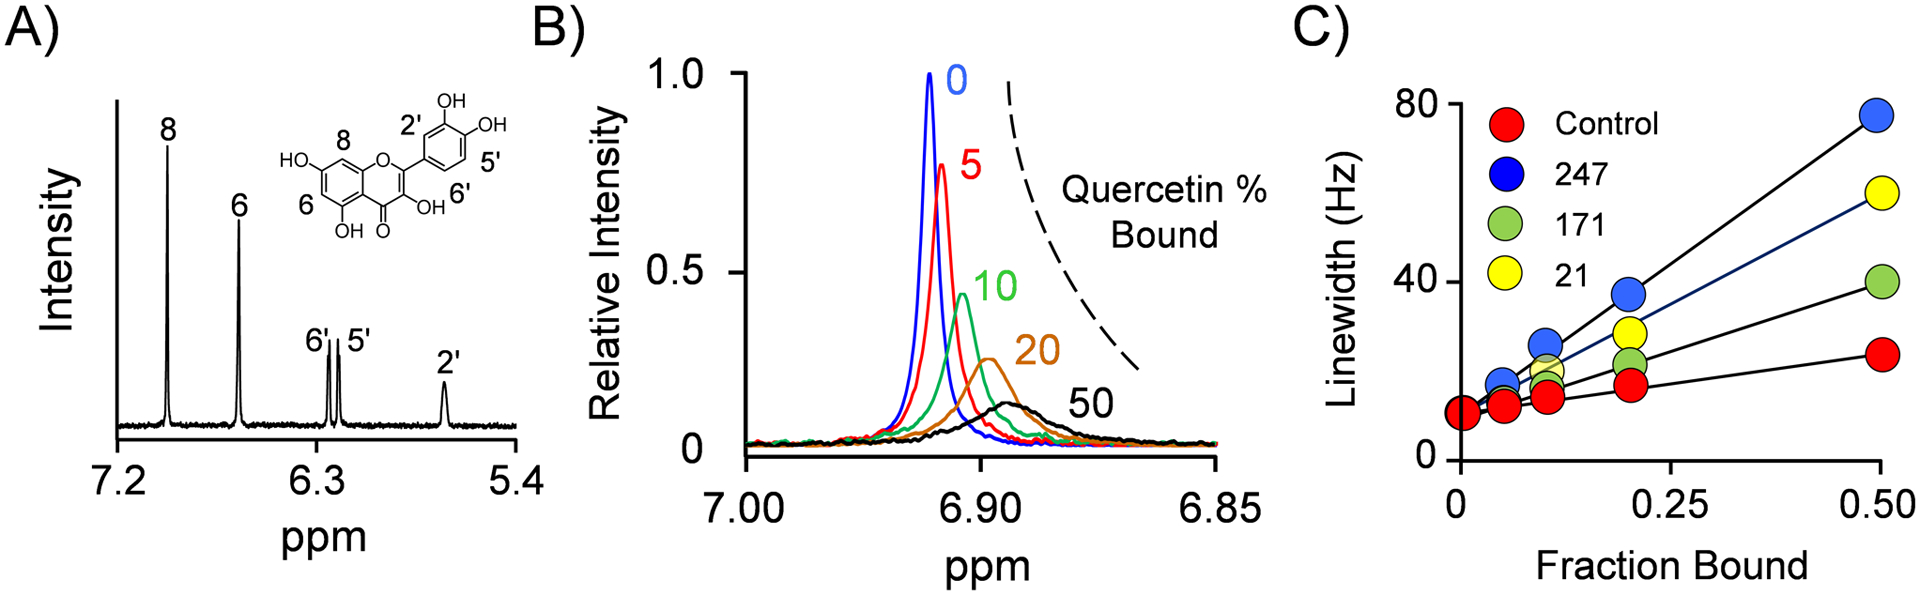
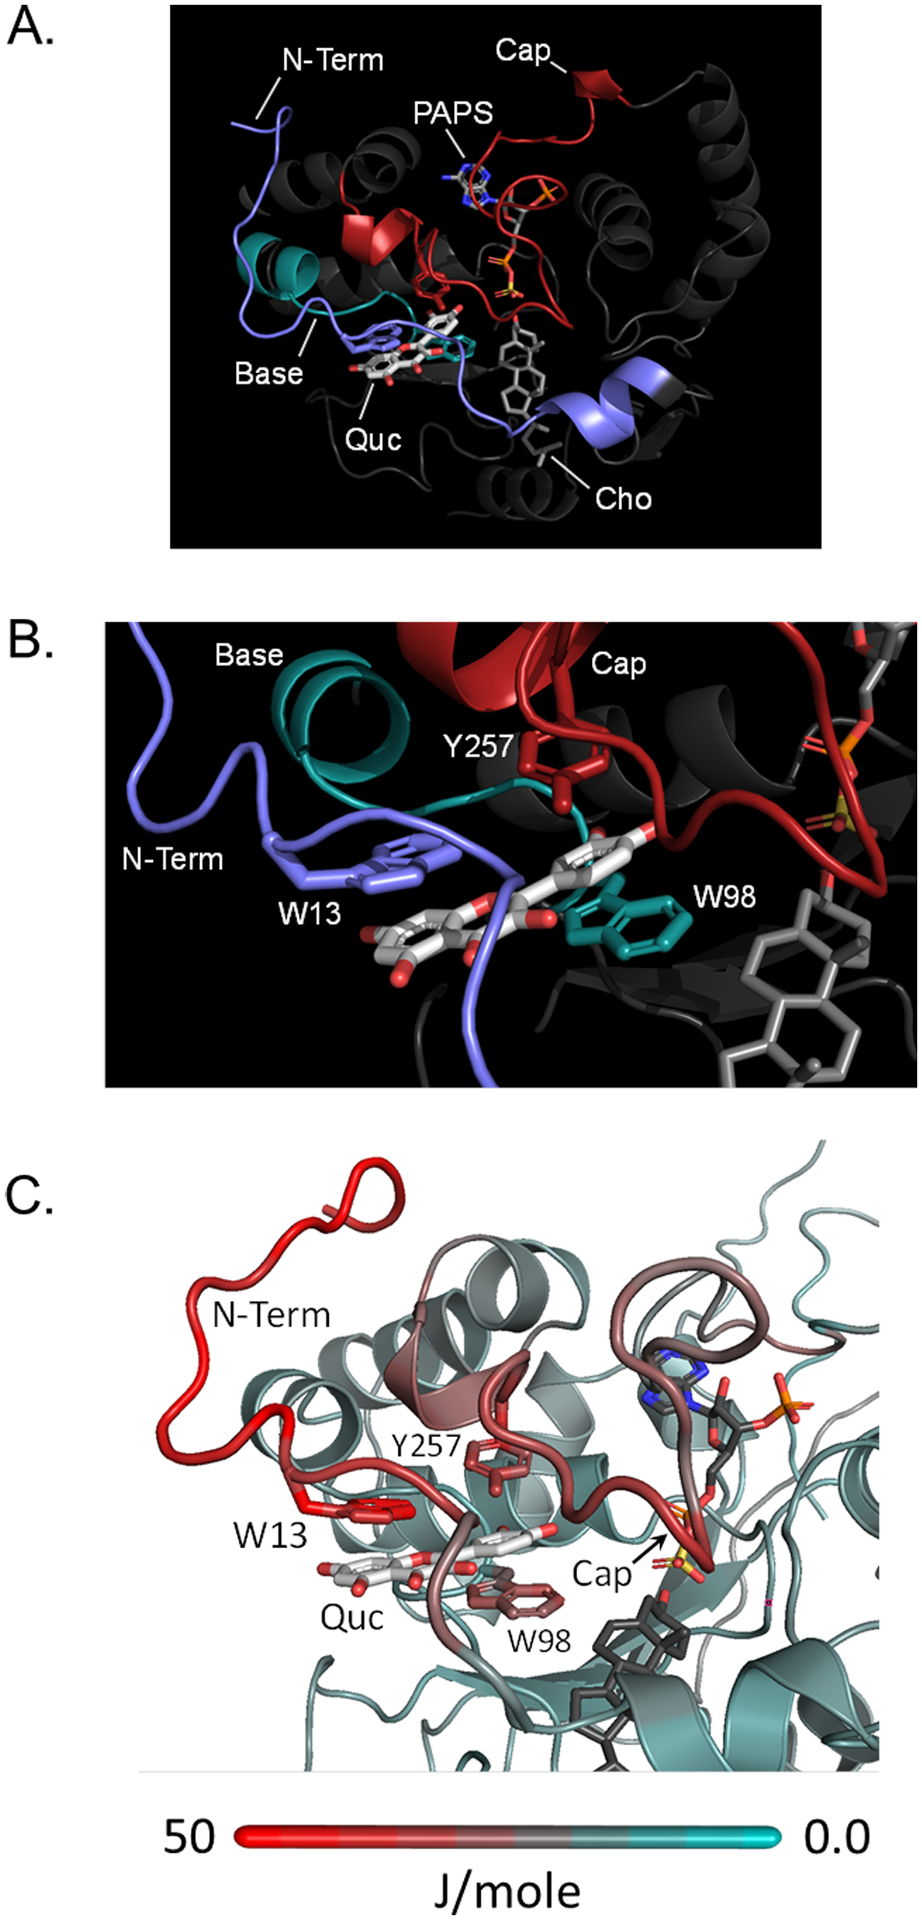
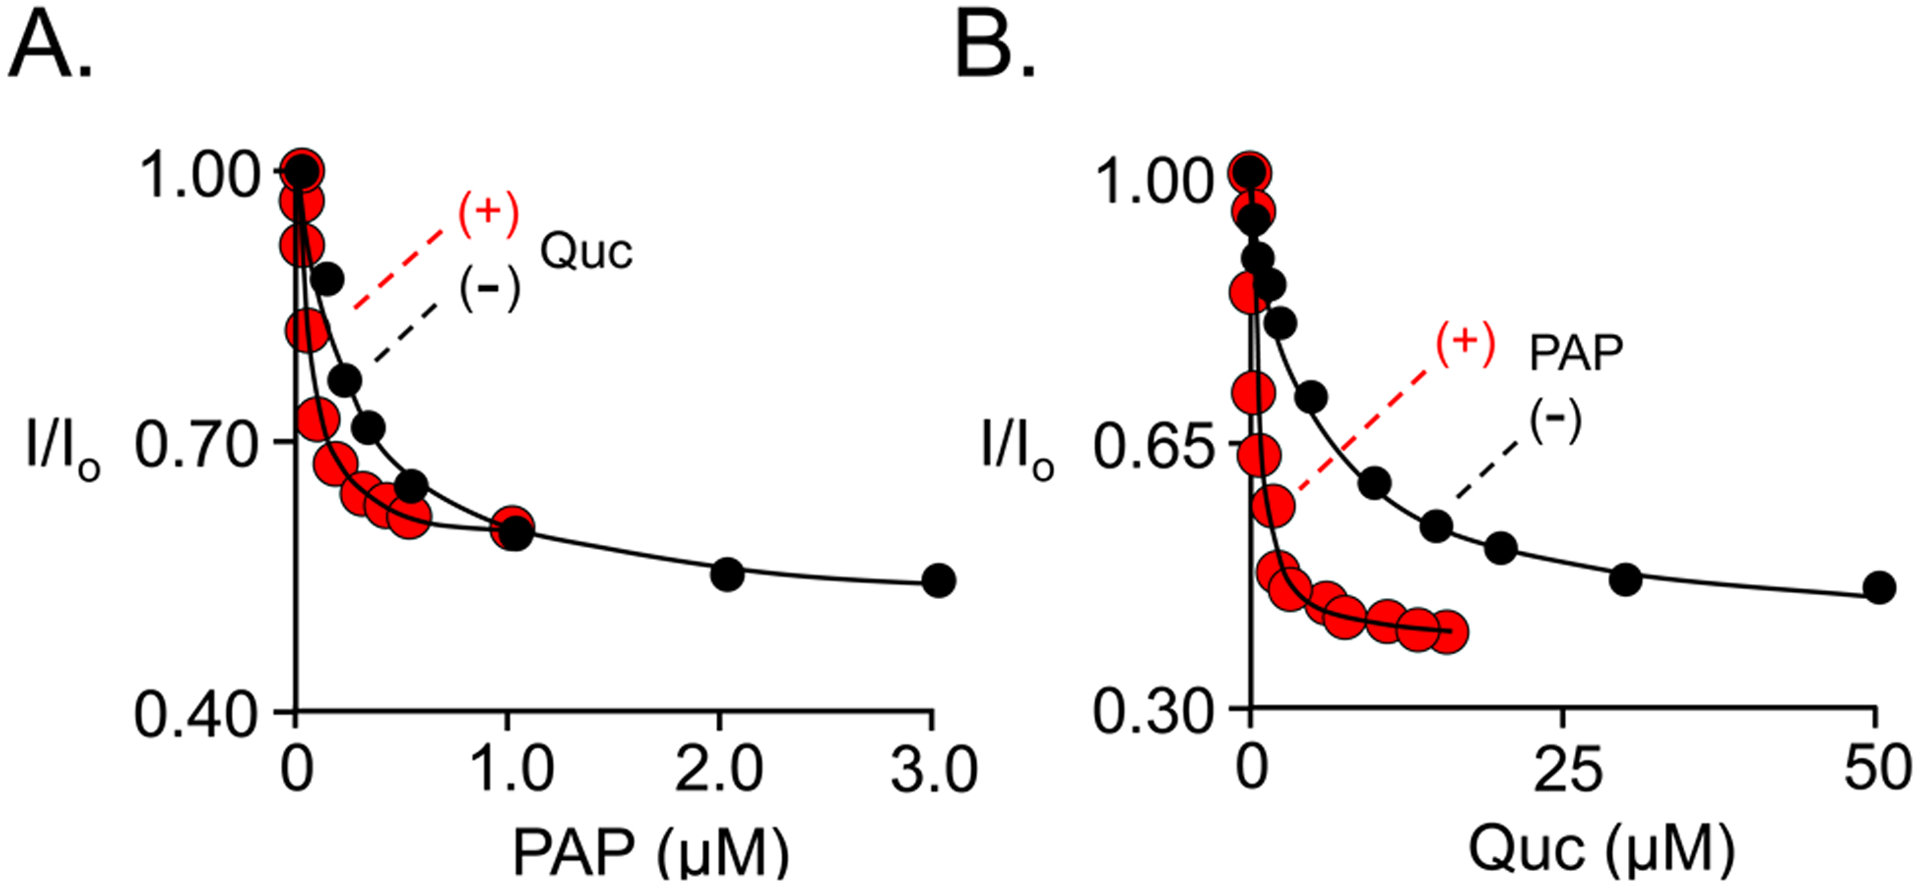
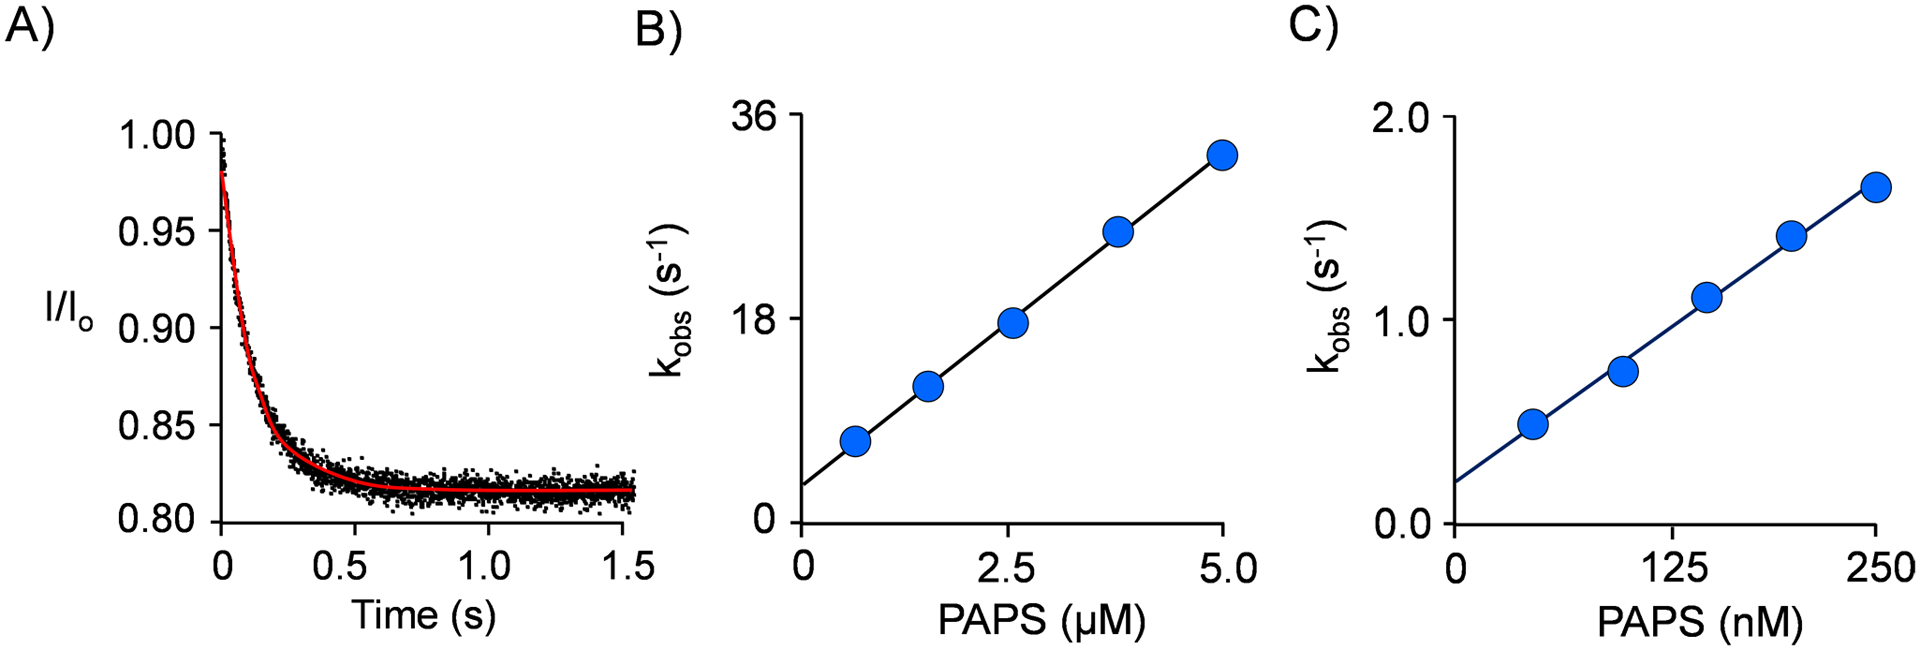
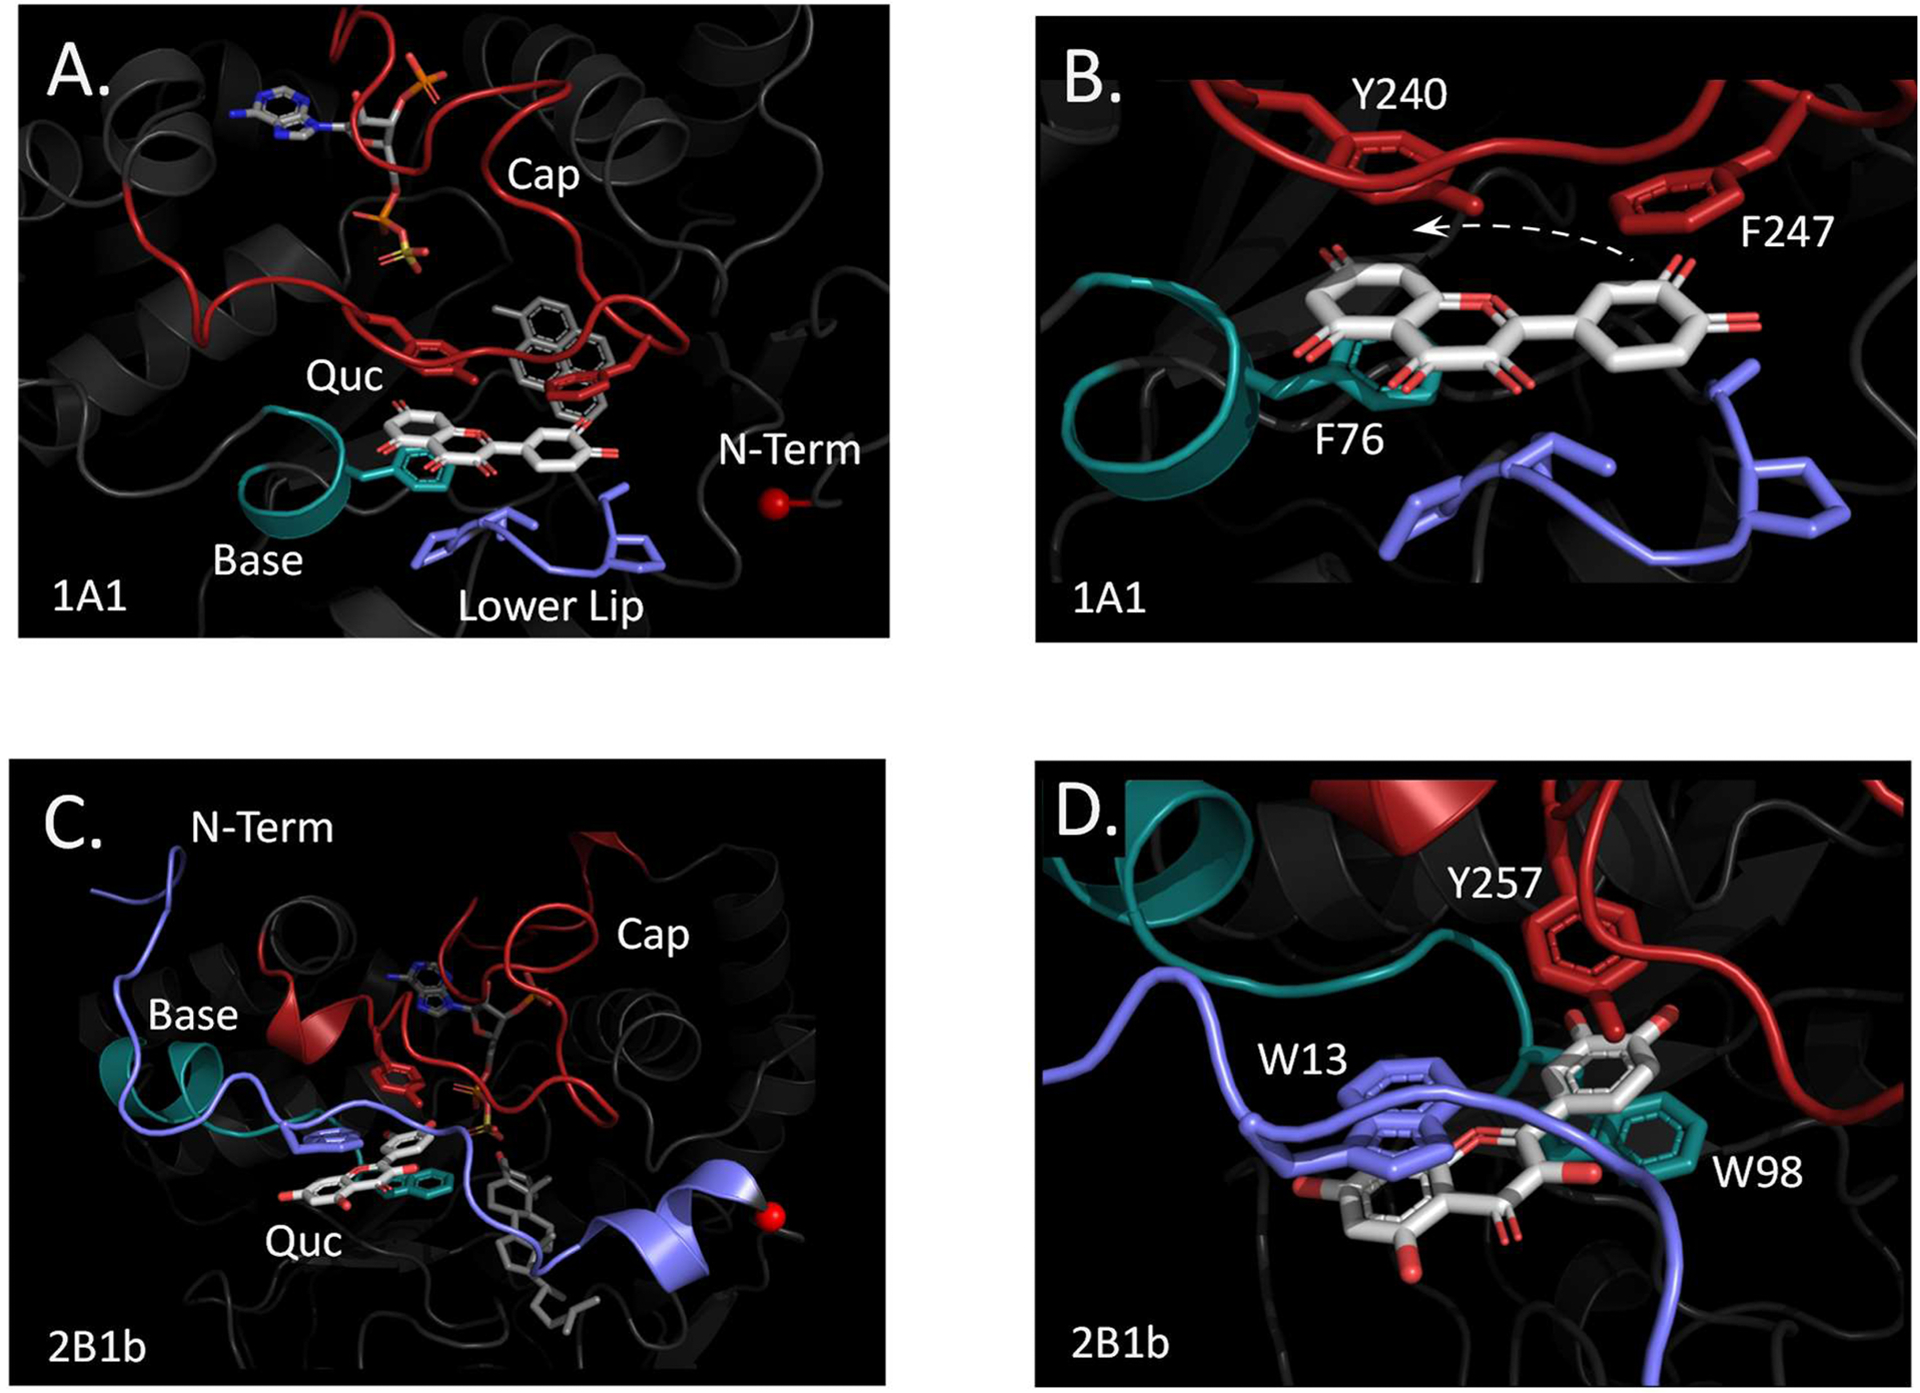
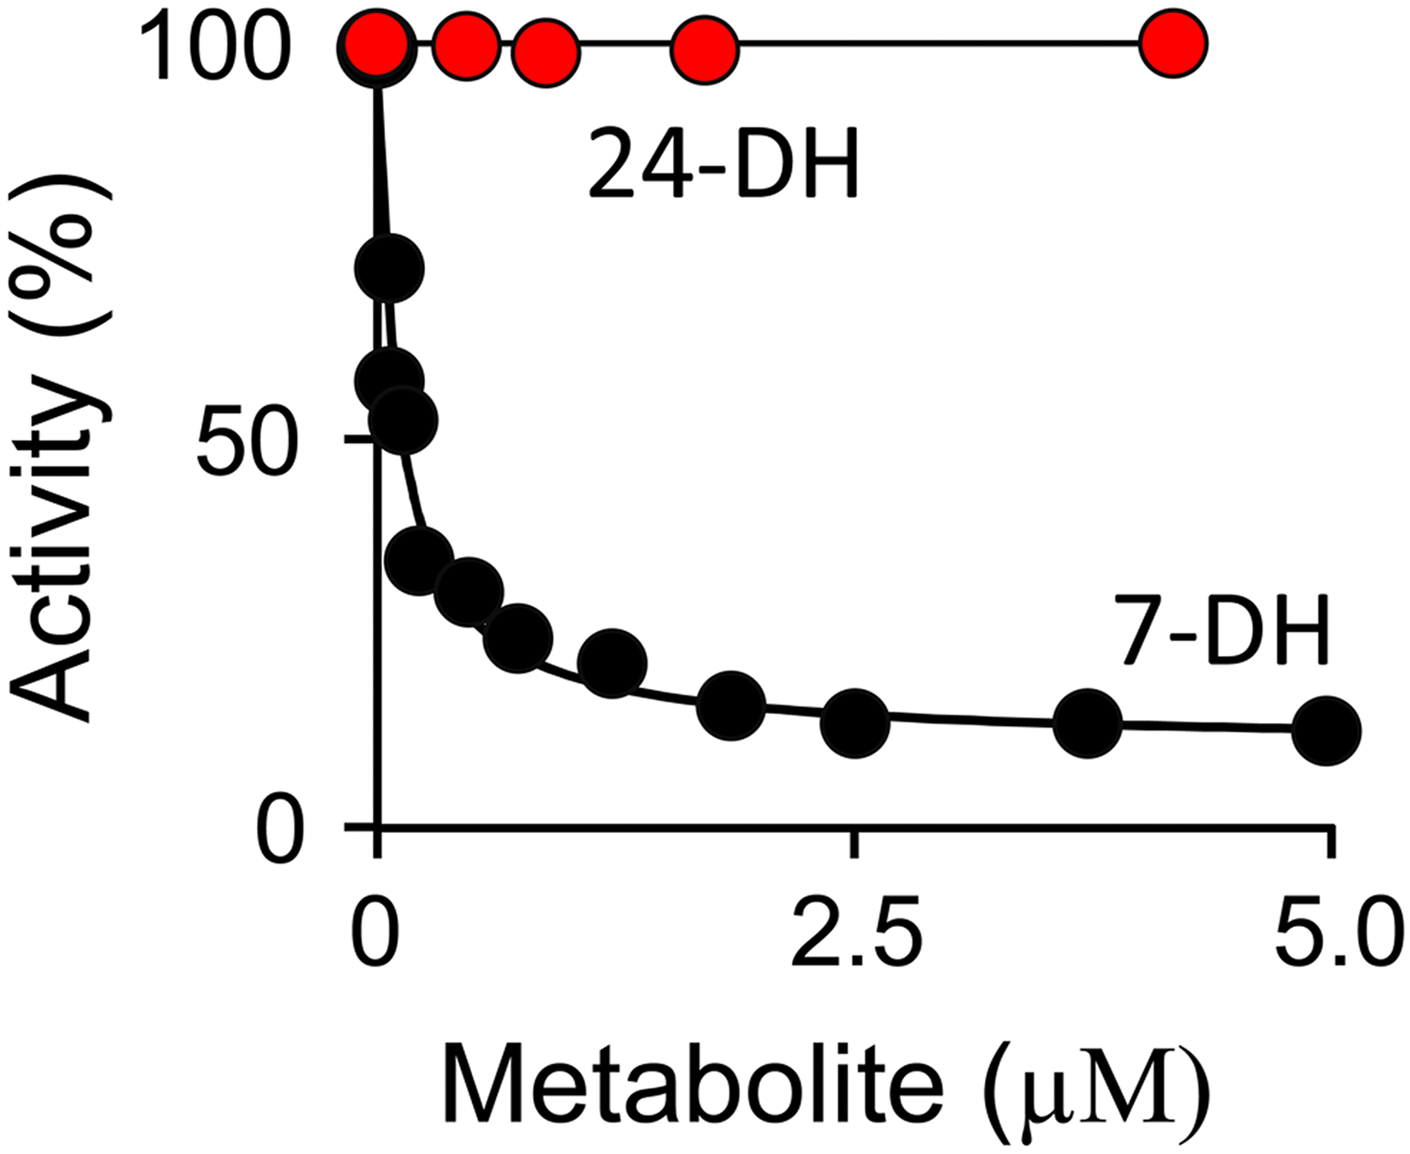
Among human cytosolic sulfotransferases, SULT2B1b is highly specific for oxysterols─oxidized cholesterol derivatives, including nuclear-receptor ligands causally linked to skin and neurodegerative diseases, cancer and atherosclerosis. Sulfonation of signaling oxysterols redirects their receptor-binding functions, and controlling these functions is expected to prove valuable in disease prevention and treatment. SULT2B1b is distinct among the human SULT2 isoforms by virtue of its atypically long N-terminus, which extends 15 residues beyond the next longest N-terminus in the family. Here, in silico studies are used to predict that the N-terminal extension forms an allosteric pocket and to identify potential allosteres. One such allostere, quercetin, is used to confirm the existence of the pocket and to demonstrate that allostere binding inhibits turnover. The structure of the pocket is obtained by positioning quercetin on the enzyme, using spin-label-triangulation NMR, followed by NMR distance-constrained molecular dynamics docking. The model is confirmed using a combination of site-directed mutagenesis and initial-rate studies. Stopped-flow ligand-binding studies demonstrate that inhibition is achieved by stabilizing the closed form of the enzyme active-site cap, which encapsulates the nucleotide, slowing its release. Finally, endogenous oxysterols are shown to bind to the site in a highly selective fashion─one of the two immediate biosynthetic precursors of cholesterol (7-dehydrocholesterol) is an inhibitor, while the other (24-dehydrocholesterol) is not. These findings provide insights into the allosteric dialogue in which SULT2B1b participates in in vivo and establishes a template against which to develop isoform-specific inhibitors to control SULT2B1b biology.


Figures

Figure 1.
Figure 1.. A Molecular Dynamics Model of SULT2B1b•PAPS•Cho.
The model was derived from an X-ray structure of the SULT2B1b•PAP•DHEA complex in which the N-terminus was truncated. The pocket is formed by the interactions of N-terminus, Base, and Cap is reminiscent of allostere-binding sites seen in other SULTs. The Tyr 16 α-carbon (orange sphere) sits near the center of the putative binding pocket and was used in docking studies as the center of an in-silico 20 Å diameter sphere that encompassed the pocket and limited ligand diffusion to the pocket’s vicinity. The model accurately predicts a previously validated interaction between Ile 20 (teal), located in the N-terminus, and cholesterol (Cho). The coordinate file for the model is available at ModelArchive (modelarchive.org) accession number ma-9p9jj.
Figure 2.
Figure 2.. Selective Inhibition of SULT2s by Quercetin.
Panel A. Initial-Rate Inhibition Studies. The initial rate of 1-HP sulfation is plotted vs quercetin concentration. Activity is reported as the percent turnover relative to the uninhibited enzyme. Sulfation was monitored via the sulfation dependent change in 1-HP fluorescence (λex = 325 nm, λex = 370 nm). Reaction conditions: enzyme (30 nM, active sites), PAPS (30 μM, 91 × Km), 1-HP 60 μM, 16, 21, and 33 × Km for 2B1b, 2B1a, and 2A1, respectively), MgCl2 (5.0 mM), KPO4 (50 mM), pH 7.5, 25 ± 2 °C. Less than 5% of the concentration-limiting substrate was consumed at the reaction endpoint was converted during the rate measurements. Each point is the average of three independent determinations. The lines passing through the data are the least-squares fits of the averaged data to a noncompetitive partial-inhibition model v/Vmax = (Ki + α•([I]/Ki))/(Ki +[I]) were Ki is the inhibitor affinity constant and α is the fraction turnover at saturation. No inhibition was detected with SULT2A1 or SULT2B1a, up to 100 μM quercetin. Panel B. The N-Termini of SULT2B1b and 2B1a. N-termini of both isoforms are compared. The SULT2B1b terminus is 15 residues longer than that of 2B21b and contains the tryptophan predicted to directly contact quercetin.
Figure 3.
Figure 3.. The Spin-Labeled SULT2B1b Constructs.
One subunit of the SULT2B1b dimer is shown. The α-carbon backbone is rendered in gray and the elements that form the putative binding site (the N-terminus, Cap and Base) are labeled and highlighted in blue and red. The small orange sphere marks the center of the binding site. The semitransparent white spheres center on the spin-label nitroxyl-oxygen atoms and their radii are set to 25 Å — the approximate maximum distance over which ligand/spin-label interactions can be detected. The spin-labels (teal) are positioned to “coat” the binding pocket in a paramagnetic field of sufficient strength to detect its effects on the solution NMR spectrum of allosteres without compromising the catalytic integrity of the enzyme.
Figure 4.
Figure 4.. The 1H-NMR Measurements.
Panel A. The 600-MHz 1H-NMR Spectrum of Quercetin. A 1D-proton spectrum of solution-phase quercetin was collected using a Bruker 600 MHz spectrometer equipped with a TCI H/F-cryogenic probe at 298 °K. Conditions: quercetin (100 μM), KPO4 (50 mM), pD 7.4, D2O (> 98%), T = 25 ± 1 °C. Quercetin proton assignments were obtained from the Human Metabolome Database and are indicated on the quercetin structure. Panel B. Spin-Label Effects on Quercetin’s H6-Proton Peak. The H6-proton peak is presented as a function of the percent quercetin bound to SULT2B1b S347D spin-labeled at position 247. Conditions: quercetin (100 μM, ≥ 13 × Ki quercetin), spin-label-247 SULT2B1b S347D (0 [blue], 5.0 [red], 10 [green], 20 [orange], and 50 [black] μM, active sites), PAP (300 μM, ≥ 710 × Km PAP), KPO4 (50 mM), pD 7.5, T = 25 ± 1 °C. Panel C. Line-Width vs Fraction-Quercetin-Bound. The effects of paramagnetic and diamagnetic labels on the H6-proton linewidth are plotted vs the fraction of enzyme-bound quercetin. Experimental conditions for each labeled protein (control, 21, 171, and 247) study were identical to those given in Panel B. The diamagnetic-control label is attached at position 247. Each point is the average of three independent determinations and the measurement errors fall within the dot diameters. Lines passing through data are linear least-squares fits of the averaged data. Spin-label/proton distances were calculated using the Solomon-Bloembergen equation (see, Methods) and are reported in Table 2.
Figure 5.
Figure 5.. The Refined Model of the Quercetin-Bound SULT2B1b Structure.
Panel A. The Binding Site. The quercetin binding site is composed of three structural elements — the N-terminus (blue), Cap (red) and Base (teal). Quercetin (Quc), cholesterol (Cho), and PAPS are labelled. Planer residues found in each of the elements are in direct contact with quercetin. Panel B. Quercetin Direct-Contact Interactions. The planar rings of quercetin are seen sandwiched by a π-stacking network composed of aromatic residues from each of the elements. The coordinate file for the model is available at ModelArchive (modelarchive.org) accession number ma-r4m3k. Panel C. Quercetin Induced Redistribution of Chemical Potential. The protein is color coded according to the g_energy (GROMACS) predicted changes in Helmholtz free energy that occur when quercetin binds. Red indicates stabilization; teal indicates no change — the scale correlates color and energy changes. The N-terminus and Cap were the only regions to undergo significant stabilization.
Figure 6.
Figure 6.. Quercetin/PAP Binding Interactions.
Binding was monitored via ligand-induced changes in SULT2B1b S347D intrinsic fluorescence (λex = 290 nm, λem = 345 nm). Fluorescence intensity is given relative to the intensity in the absence of titrant (i.e., I/I0) and is plotted vs titrant concentration. Panel A. PAP binding to E and E•Quc. Conditions: SULT2B1b S347D (10 nM, active sites), PAP (5.0 nM – 20 μM), quercetin (0 [black] or 150 μM [red] μM, 28 × Kd), KPO4 (50 mM), pH 7.5, 25 ± 2 °C. Panel B. Quercetin binding to E• and E•PAP. Conditions: SULT2B1b S347D (50 nM, active sites), quercetin (0.10 – 50 μM), PAP (0 [black] or 30 [red] μM, 91 × Kd), KPO4 (50 mM), pH 7.5, 25 ± 2 °C. Titrations were performed in triplicate and measurement errors fall within the data points. Lines through the data represent least-squares fits of the averaged data using a binding model that assumes one binding site per subunit. The resulting dissociation constants and errors are reported in Table 4.
Figure 7.
Figure 7.. Stopped-Flow PAPS-Binding Studies.
Panel A. Representative Progress Curve. SULT2B1b S347D was mixed against PAPS (2.0 μM). Panel B. kobs vs [PAPS]. Panel C. kobs vs [PAPS] at Saturating Quercetin. PAPS binding to SULT2B1b S437D was monitored via ligand-induced changes in SULT2B1b intrinsic fluorescence using an Applied Photophysics SX20 stopped-flow spectrofluorometer (λex = 290 nm, λem ≥ 330 nm (cutoff filter)). Reactions were initiated by rapidly mixing (1:1 v/v) a solution containing SULT2B1b S347D (10 nM, active sites), quercetin (0 or 170 μM), KCl (50 mM), KPO4 (50 mM), pH 7.5, 25 ± 2°C, with a solution that was identical except that it lacked enzyme and contained PAPS. All reactions were pseudo first order in PAPS. kobs values were obtained by fitting the average of five progress curves to a single exponential and were determined in triplicate. Errors in the kobs vs concentration plots fall within the data points, and the lines through the data are linear least-squares fits to the averaged values. kon and koff, obtained from slopes and y-intercepts of kobs vs concentration plots, can be found in Table 5.
Figure 8.
Figure 8.. The SULT1A1 and SULT2B1b Quercetin-Binding Sites.
Panels A and B. The SULT1A1 Binding Site. At-a-distance (Panel A) and close-up (Panel B) views of the SULT1A1 quercetin-binding site. The Base, Cap and Lower Lip of the binding site are color coded, as are the residues in these elements that directly contact quercetin. The N-terminal methionine α-carbon of SULT1A1 is presented as a small red sphere. The hyphenated arrow seen in Panel B indicates the reorientation undergone by quercetin in going from the SULT1A1 to 2A1 binding sites. Panels C and D. The SULT2B1b Binding Site. At-a-distance (Panel C) and close-up (Panel D) views of the SULT1A1 quercetin-binding site. Color coding is as described for Panels A and B. The small red sphere highlights the α-carbon of K26, which is the approximate endpoint of the SULT1A1 N-terminus.
Figure 9.
Figure 9.. Cholesterol Precursor Inhibition of SULT2B1b.
Initial rate turnover of SULT2B1b is plotted versus 7-deyhdrocholesterol (7-DH, black dots) or 24-deyhdrocholesterol (24-DH, red dots) concentration. Reactions were monitored via the sulfonation dependent change in 1-HP fluorescence (λex = 325 nm, λex = 370 nm). Activity is reported as percent turnover relative to the uninhibited enzyme. Reaction conditions: SULT2B1b (15 nM, active site), PAPS (30 μM, 91 × Km), 1-HP (100 μM, 26 × Km), MgCl2 (5.0 mM), KPO4 (50 mM), pH 7.5, 25 ± 2 °C. Less than 5% of the concentration-limiting substrate consumed at the reaction endpoint was converted during the rate measurements. Each point is the average of three independent determinations. The line passing through the 7-DH data is the behavior predicted by a least-squares fit of the averaged data to a noncompetitive partial-inhibition model (Ki is 110 ± 7 nM, α = 0.11 ± 0.02).

Similar articles

Cited by

References

    1. Mesiano S, and Jaffe RB (1997) Developmental and functional biology of the primate fetal adrenal cortex., Endocr Rev 18, 378–403. - PubMed
    1. Li L, and Falany CN (2007) Elevated hepatic SULT1E1 activity in mouse models of cystic fibrosis alters the regulation of estrogen responsive proteins, J Cyst Fibros 6, 23–30. - PubMed
    1. Cook IT, Duniac-Dmuchowski Z, Kocarek TA, Runge-Morris M, and Falany CN (2009) 24-Hydroxycholesterol Sulfation by Human Cytosolic Sulfotransferases: Formation of Monosulfates and Disulfates, Molecular Modeling, Sulfatase Sensitivity and Inhibition of LXR Activation, Drug Metab Dispos 37, 2069–2078. - PMC - PubMed
    1. Bai Q, Xu L, Kakiyama G, Runge-Morris MA, Hylemon PB, Yin L, Pandak WM, and Ren S (2011) Sulfation of 25-hydroxycholesterol by SULT2B1b decreases cellular lipids via the LXR/SREBP-1c signaling pathway in human aortic endothelial cells., Atherosclerosis 214, 350–356. - PMC - PubMed
    1. Sidharthan NP, Minchin RF, and Butcher NJ (2013) Cytosolic sulfotransferase 1A3 is induced by dopamine and protects neuronal cells from dopamine toxicity: role of D1 receptor-N-methyl-D-aspartate receptor coupling, J Biol Chem 288, 34364–34374. - PMC - PubMed

Publication types