. 2022 Aug 1:256:119277.
doi: 10.1016/j.neuroimage.2022.119277. Epub 2022 May 3.

Neurite Exchange Imaging (NEXI): A minimal model of diffusion in gray matter with inter-compartment water exchange

Affiliations

Neurite Exchange Imaging (NEXI): A minimal model of diffusion in gray matter with inter-compartment water exchange

Ileana O Jelescu et al. Neuroimage. .

Abstract

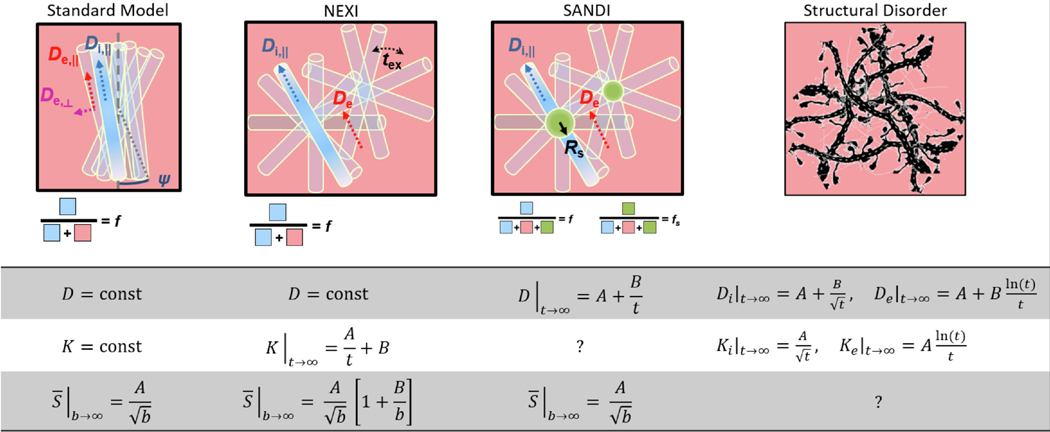
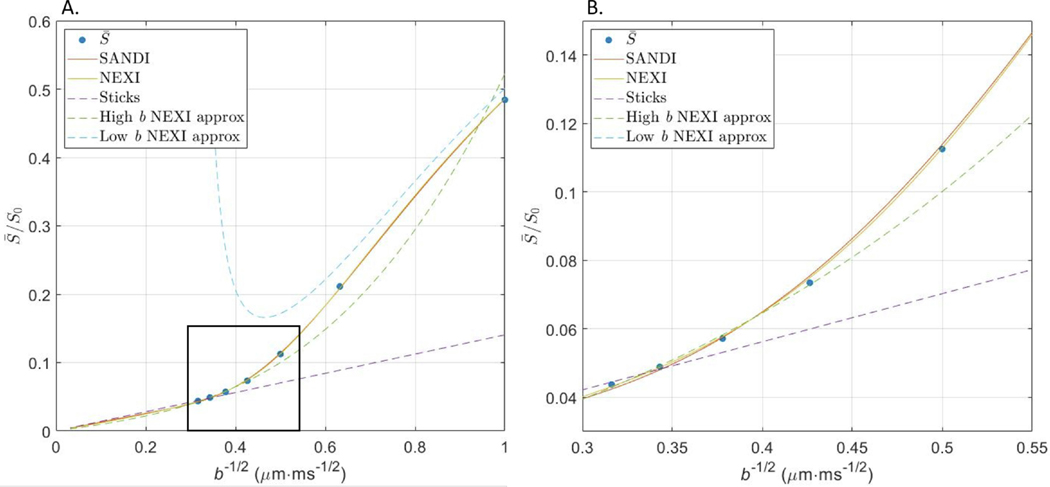
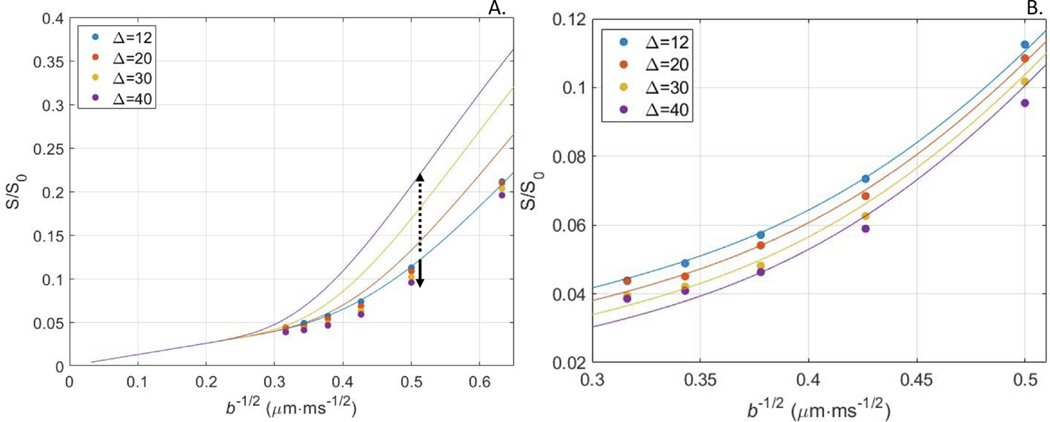
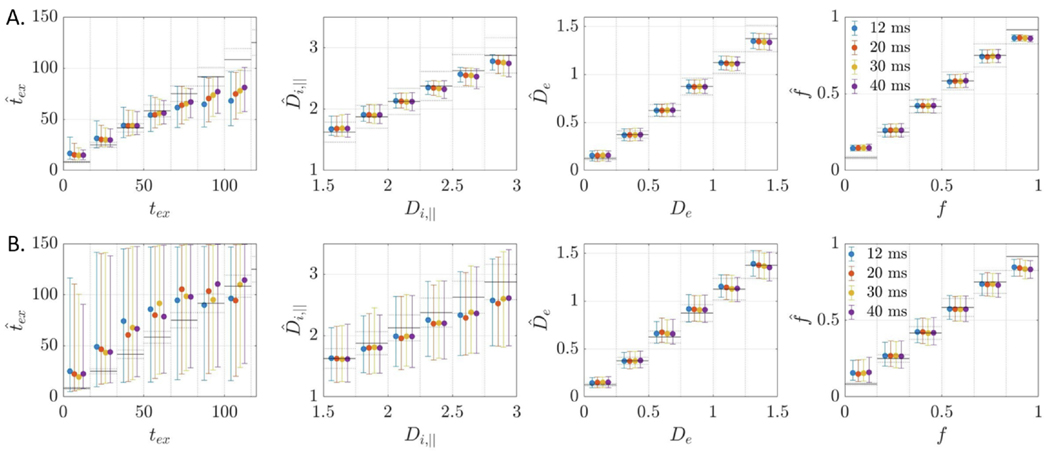
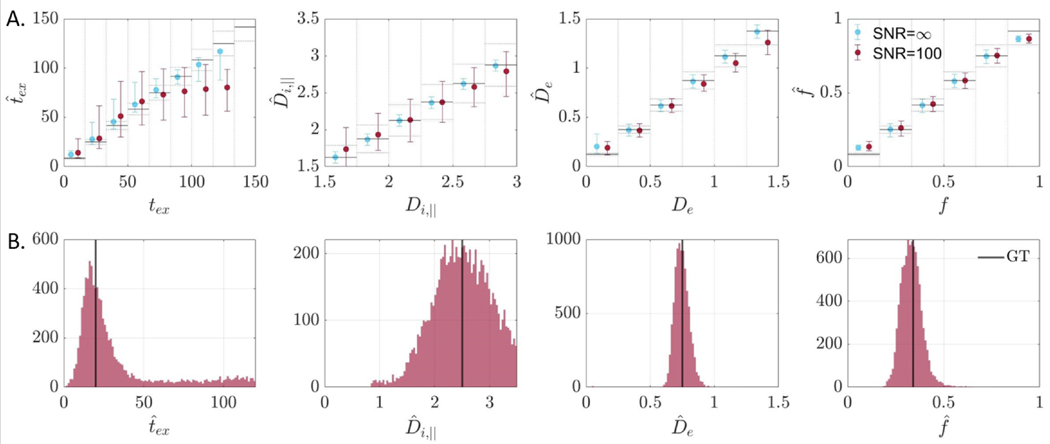
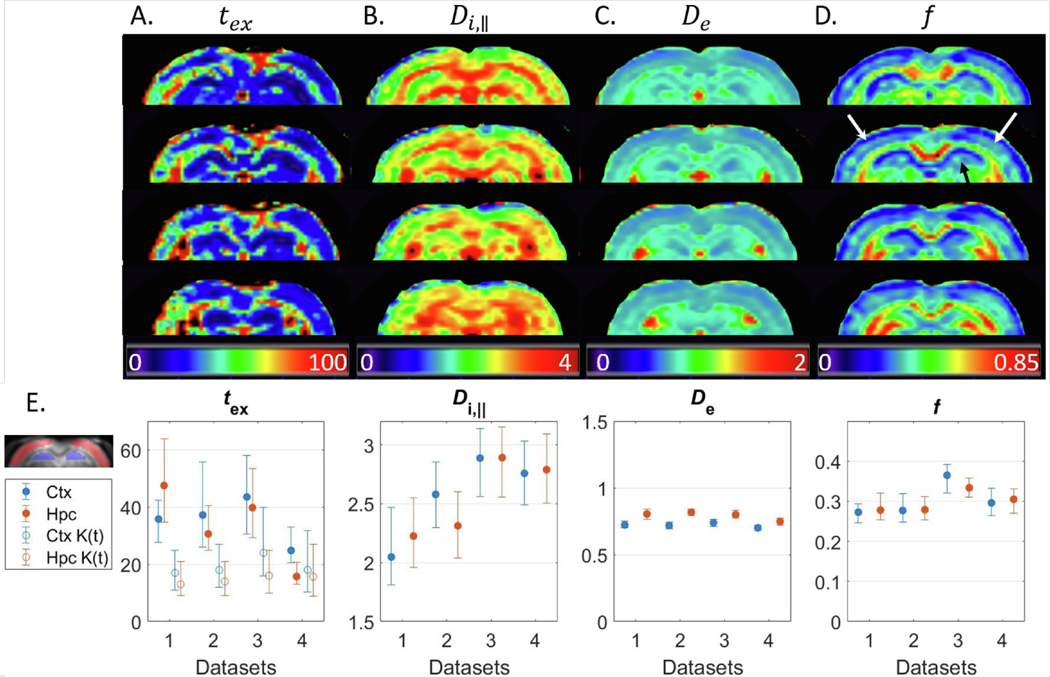
Biophysical models of diffusion in white matter have been center-stage over the past two decades and are essentially based on what is now commonly referred to as the "Standard Model" (SM) of non-exchanging anisotropic compartments with Gaussian diffusion. In this work, we focus on diffusion MRI in gray matter, which requires rethinking basic microstructure modeling blocks. In particular, at least three contributions beyond the SM need to be considered for gray matter: water exchange across the cell membrane - between neurites and the extracellular space; non-Gaussian diffusion along neuronal and glial processes - resulting from structural disorder; and signal contribution from soma. For the first contribution, we propose Neurite Exchange Imaging (NEXI) as an extension of the SM of diffusion, which builds on the anisotropic Kärger model of two exchanging compartments. Using datasets acquired at multiple diffusion weightings (b) and diffusion times (t) in the rat brain in vivo, we investigate the suitability of NEXI to describe the diffusion signal in the gray matter, compared to the other two possible contributions. Our results for the diffusion time window 20-45 ms show minimal diffusivity time-dependence and more pronounced kurtosis decay with time, which is well fit by the exchange model. Moreover, we observe lower signal for longer diffusion times at high b. In light of these observations, we identify exchange as the mechanism that best explains these signal signatures in both low-b and high-b regime, and thereby propose NEXI as the minimal model for gray matter microstructure mapping. We finally highlight multi-b multi-t acquisition protocols as being best suited to estimate NEXI model parameters reliably. Using this approach, we estimate the inter-compartment water exchange time to be 15 - 60 ms in the rat cortex and hippocampus in vivo, which is of the same order or shorter than the diffusion time in typical diffusion MRI acquisitions. This suggests water exchange as an essential component for interpreting diffusion MRI measurements in gray matter.

Keywords: Cell membrane permeability; Cortex; Diffusion MRI; Exchange; Gray matter; Microstructure.


Conflict of interest statement

Declaration of Competing Interest None.

Figures

Fig. 1.
Fig. 1.
Sketch of relevant features and parameters in the Standard Model, NEXI, SANDI and structural disorder models, along with the associated functional form for time-dependence in diffusivity D and kurtosis K, as well as the functional form of the signal decay in the high-b regime. Note that parameters A and B stand for constants that are different in each instance. The Standard Model considers a collection of impermeable sticks – occupying a relative signal fraction f – where diffusion is Gaussian and unidirectional with diffusivity Di, and an extra-neurite Gaussian anisotropic compartment with characteristic diffusivities De, and De, parallel and perpendicular to the local neurite orientation, respectively. ODF anisotropy can be characterized by the l=2 order rotational invariant p2 or its derived dispersion angle c2cos2ψ=2p2+13. NEXI considers a collection of randomly-oriented sticks – occupying a relative signal fraction f – where diffusion is unidirectional with diffusivity Di, and an extra-neurite Gaussian isotropic compartment with characteristic diffusivity De. The two compartments exchange with a characteristic time tex. SANDI considers a similar picture as NEXI, but accounts for a third compartment of spheres of radius Rs (occupying a relative fraction fs) and neglects inter-compartment exchange. The structural disorder model assumes a certain type of disorder (here short-range disorder) and its signature in diffusion and kurtosis time-dependence, also as a function of the spatial dimensionality in which the disorder is manifest (1D for intra-neurite water, 2D or 3D for extracellular water).
Fig. 2.
Fig. 2.
Time-dependence of SM parameters, also as a function of maximum b-value available, in two GM ROIs: cortex and hippocampus. Symbols: mean ± std across rats. Solid line: linear fits.
Fig. 3.
Fig. 3.
Mean diffusivity and kurtosis as a function of diffusion time, in the cortex (Ctx) and hippocampus (Hpc), averaged across animals. Fit parameters (mean ± std) for each functional form are collected in the tables. A: Fitting the power-law to MD yielded very large exponent ϑ (with high variability), mainly driven by the diffusion times 10–20 ms. B: The behavior of MK was markedly different, with a decay throughout the 10–45 ms span. As a result, the power-law fit to MK yielded exponent ϑ close to 1 (and with reduced variability). C-D: The direct fitting to either the KM kurtosis (imposing K=0) or the 1D structural disorder form (ϑ=1/2) showed both approaches fit the data similarly, though KM kurtosis captures the curve at the longest times (leftmost of x-axis) better. Releasing K=0 in the KM results in a similar curve to 1D disorder but with poorer parameter estimates (3 free parameters instead of 2). [The number of datasets N averaged for each diffusion time t is variable: t(N)=10(2), 11(1), 12(3), 15(2), 20(5), 25(3), 30(5), 35(1), 40(5), 45(2), see also Table 1].
Fig. 4.
Fig. 4.
Time-dependence of SANDI model parameters for the ROI in the cortex and hippocampus. Open symbols: mean value; error bars: standard deviation over all the voxels within the ROI for each investigated rat. Note that data from Rat #1–3 were acquired at higher resolution (blue, red, yellow – voxel size 0.2 × 0.2 × 0.5 mm3) and different diffusion times than Rat #4 (purple – voxel size 0.25 × 0.25 × 0.8 mm3). See Table 1 for further details on the acquisition.
Fig. 5.
Fig. 5.
A. Various models were fit to the average signal in the cortex (Rat #2) at t=12ms: SANDI, Eq. (10), and NEXI, Eq. (6), covering the full b-value range; the impermeable stick approximation (Callaghan’s model); NEXI approximation at high b, Eq. (8); and the NEXI-derived diffusivity + kurtosis approximation at low b (Appendix). B. Zoom-in of the black framed region in panel A. Both SANDI and NEXI explain the data at a single diffusion time well. Callaghan’s model does not describe diffusion signal decay in the cortex appropriately due to the signal’s notable curvature with respect to b1/2, cf Eq. (8). The NEXI low-b and high-b approximations are reasonable in their respective regimes. It should be noted the low-b approximation is derived from NEXI parameter estimates obtained over the entire b-value range available hence some mismatch with the experimental datapoints. The mismatch is reduced for longer diffusion times, where the Gaussian compartment approximation may be more suitable (Fig. S10). Estimated model parameters, underlying the plotted curves: SANDI: f=0.22; fs=0.41; Di,=2.3; Rs=9.3; De=0.54; NEXI: f=0.35; Di,=3; De=0.73; tex=20; Sticks: f=0.25; Di,=2.4; High b NEXI approx.: f=0.29; Di,=1.9; De=0.35; tex=12.
Fig. 6.
Fig. 6.
A. The SANDI model was fit to the average signal in the cortex (Rat #2) at t=12ms. Estimated model parameters [f=0.22; fs=0.41; Di,=2.3; Rs=9.3; De=0.54] were used to predict the signal for longer diffusion times (solid lines), as suggested by Olesen et al. (2021). Qualitatively, SANDI predicted higher signal at longer diffusion times, which was opposite to the experimental pattern of increasingly reduced signal with longer diffusion time (dots). B. The NEXI model of exchange was fit to data from all diffusion times jointly (solid lines). The estimated model parameters were [f=0.29; Di,=2.5; De=0.74; tex=44]. This model explained decay curves at different diffusion times well, though the agreement was poorer at the highest b-values, potentially due to an imperfect correction for Rician noise floor or to soma. All units in μm, ms and μm2/ms.
Fig. 7.
Fig. 7.
Simulation results fitting multi-shell data for each diffusion time separately using NLLS, without noise (A) or with SNR = 100 (B). Displayed is the ground truth (GT) vs estimation for 104 set of random parameters. Markers correspond to the median & IQR in the corresponding intervals. Black lines are the ideal estimation ± 10% error. In all cases, the precision is good on De and acceptable on f. However, in a finite SNR case, Di, and tex cannot be estimated, irrespective of the diffusion time.
Fig. 8.
Fig. 8.
Simulation results fitting multi-shell multi-td data jointly using NLLS, for random GT (A) or fixed to [texth,Di,th,Deth,fth]=[20,2.5,0.75,0.34] (B). A: Displayed are the medians & IQR in each bin. Black lines: ideal estimation ± 10% error. Without noise, NLLS fits all parameters with high accuracy and precision. At SNR = 100, uncertainty increases primarily for Di, and tex and sensitivity to high tex values is lost but the performance is much improved compared to single td fits (Fig. 7). B: At SNR = 100, good accuracy is achieved for all NEXI parameters. For Di, the precision is poor. Black solid line: ground truth.
Fig. 9.
Fig. 9.
A–D: Four coronal slices of NEXI parametric maps calculated using NLLS from a multi-shell multi-t dataset. The maps enable a good differentiation between GM & WM as well as between different cortical layers (white arrows) or hippocampal subfields (black arrow). E: Median & IQR of model parameters in the cortex and hippocampus ROIs across the four datasets. The exchange time estimate is also compared with texK(t), Eq. (7). Experimental trends agree with the simulations. Regarding texK(t), the estimation agrees with tex very well for Dataset #4, which had the highest SNR (larger voxels), and is otherwise shorter.
Fig. 10.
Fig. 10.
Features of NEXI neurite density map features as compared to cellular components obtained from histological stainings: neurofilaments (orange), astrocytes (blue), neuron nuclei (green) and microglia (red). The WM is outlined in fine dotted lines for legibility; cortex lies above, hippocampus below. Higher NEXI neurite density in central cortical layers agrees with higher density of neurofilament staining (dashed lines). Higher NEXI neurite density in the central part of the hippocampus (dorsal dendate gyrus) agrees especially with higher density of astrocytes but also neurofilaments (long-dashed contour). Neuron soma and microglia do not seem to contribute to NEXI neurite density contrast.

Similar articles

Cited by

References

    1. Afzali M, Nilsson M, Palombo M, Jones DK, 2021. SPHERIOUSLY? The challenges of estimating sphere radius non-invasively in the human brain from diffusion MRI. Neuroimage 237, 118183. doi: 10.1016/j.neuroimage.2021.118183. - DOI - PMC - PubMed
    1. Aggarwal M, Smith MD, Calabresi PA, 2020. Diffusion-time dependence of diffusional kurtosis in the mouse brain. Magn. Reson. Med. 84, 1564–1578. doi: 10.1002/mrm.28189. - DOI - PMC - PubMed
    1. Alexander DC, Hubbard PL, Hall MG, Moore EA, Ptito M, Parker GJM, Dyrby TB, 2010. Orientationally invariant indices of axon diameter and density from diffusion MRI. Neuroimage 52, 1374–1389. doi: 10.1016/j.neuroimage.2010.05.043. - DOI - PubMed
    1. Andersson M, Kjer HM, Rafael-Patino J, Pacureanu A, Pakkenberg B, Thiran JP, Ptito M, Bech M, Dahl AB, Dahl VA, Dyrby TB, 2020. Axon morphology is modulated by the local environment and impacts the noninvasive investigation of its structure–function relationship. PNAS 117, 33649–33659. doi: 10.1073/pnas.2012533117. - DOI - PMC - PubMed
    1. Arbabi A, Kai J, Khan AR, Baron CA, 2020. Diffusion dispersion imaging: mapping oscillating gradient spin-echo frequency dependence in the human brain. Magn. Reson. Med. 83, 2197–2208. doi: 10.1002/mrm.28083. - DOI - PubMed

Publication types