

Peripheral sTREM2-Related Inflammatory Activity Alterations in Early-Stage Alzheimer's Disease
- PMID: 35523454
- PMCID: PMC9117433
- DOI: 10.4049/jimmunol.2100771
Peripheral sTREM2-Related Inflammatory Activity Alterations in Early-Stage Alzheimer's Disease
Abstract
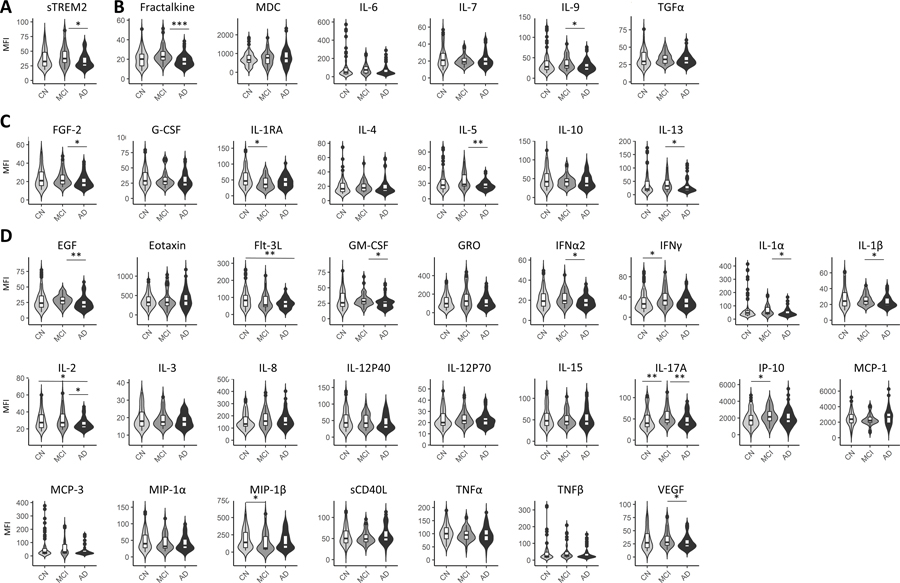
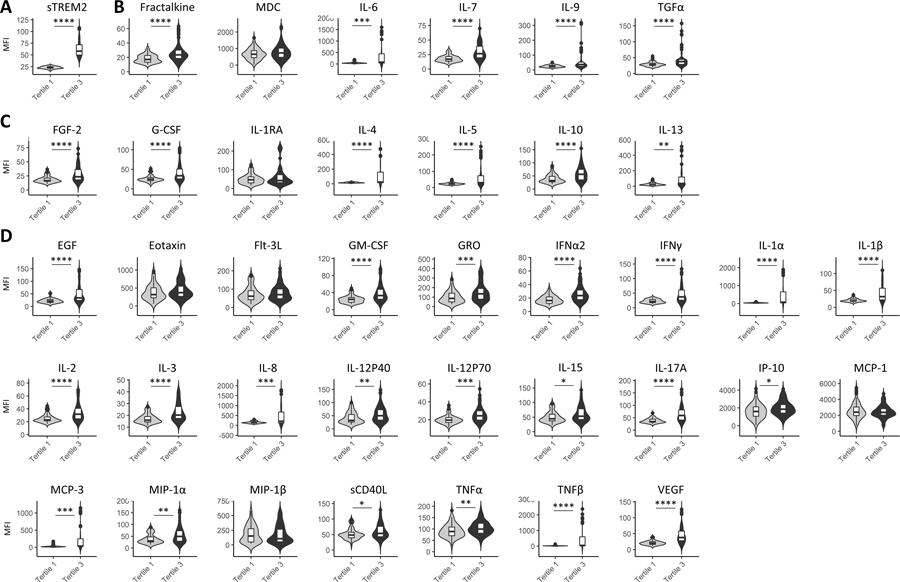
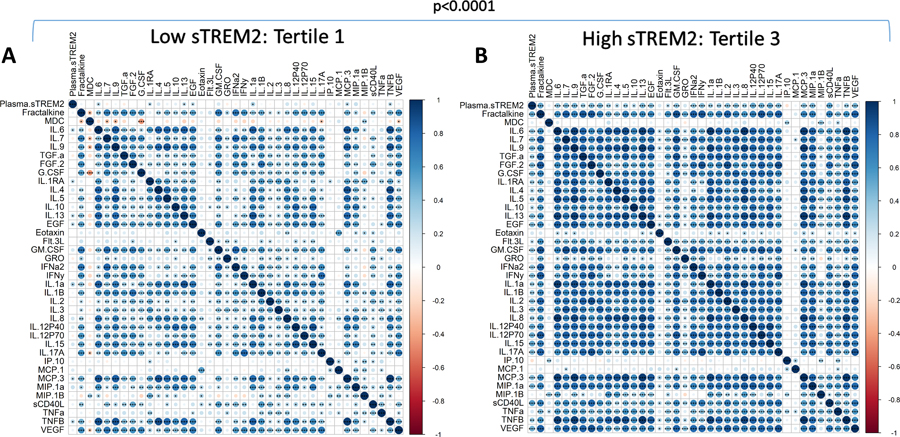
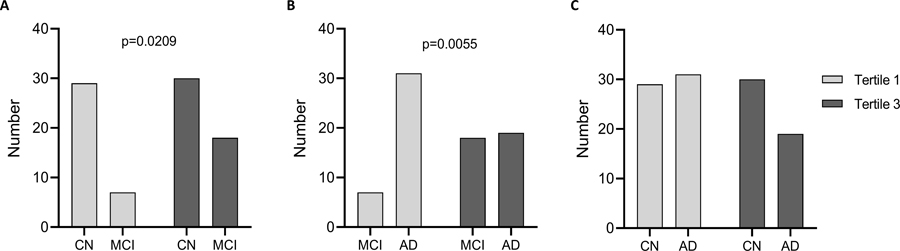
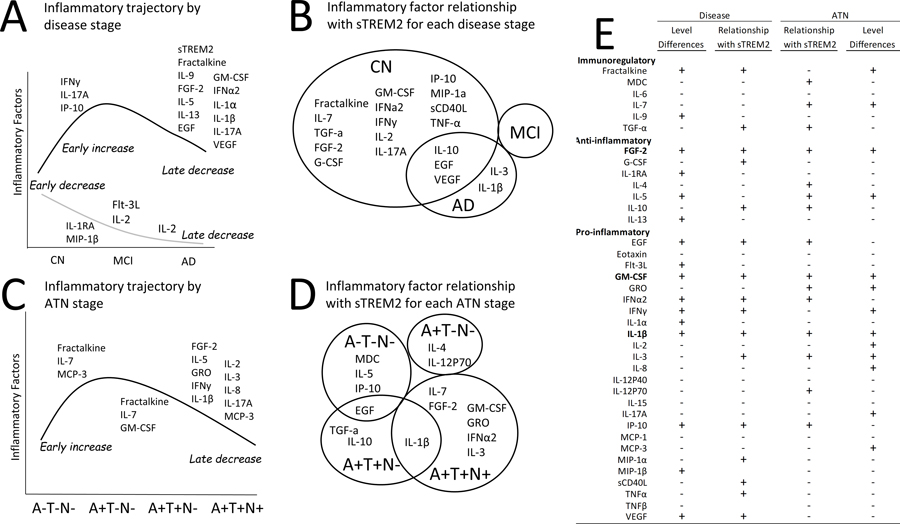
Alzheimer's disease (AD) has been linked to multiple immune system-related genetic variants. Triggering receptor expressed on myeloid cells 2 (TREM2) genetic variants are risk factors for AD and other neurodegenerative diseases. In addition, soluble TREM2 (sTREM2) isoform is elevated in cerebrospinal fluid in the early stages of AD and is associated with slower cognitive decline in a disease stage-dependent manner. Multiple studies have reported an altered peripheral immune response in AD. However, less is known about the relationship between peripheral sTREM2 and an altered peripheral immune response in AD. The objective of this study was to explore the relationship between human plasma sTREM2 and inflammatory activity in AD. The hypothesis of this exploratory study was that sTREM2-related inflammatory activity differs by AD stage. We observed different patterns of inflammatory activity across AD stages that implicate early-stage alterations in peripheral sTREM2-related inflammatory activity in AD. Notably, fractalkine showed a significant relationship with sTREM2 across different analyses in the control groups that was lost in later AD-related stages with high levels in mild cognitive impairment. Although multiple other inflammatory factors either differed significantly between groups or were significantly correlated with sTREM2 within specific groups, three inflammatory factors (fibroblast growth factor-2, GM-CSF, and IL-1β) are notable because they exhibited both lower levels in AD, compared with mild cognitive impairment, and a change in the relationship with sTREM2. This evidence provides important support to the hypothesis that sTREM2-related inflammatory activity alterations are AD stage specific and provides critical information for therapeutic strategies focused on the immune response.
Copyright © 2022 by The American Association of Immunologists, Inc.
Conflict of interest statement
Declarations:
• Competing interests: The authors declare that they have no competing interests
Figures
Similar articles
-
Soluble TREM2 Concentrations in the Cerebrospinal Fluid Correlate with the Severity of Neurofibrillary Degeneration, Cognitive Impairment, and Inflammasome Activation in Alzheimer's Disease.Neurol Int. 2023 Jul 7;15(3):842-856. doi: 10.3390/neurolint15030053. Neurol Int. 2023. PMID: 37489359 Free PMC article.
-
Soluble TREM2 levels associate with conversion from mild cognitive impairment to Alzheimer's disease.J Clin Invest. 2022 Dec 15;132(24):e158708. doi: 10.1172/JCI158708. J Clin Invest. 2022. PMID: 36519540 Free PMC article.
-
Temporal Ordering of Inflammatory Analytes sTNFR2 and sTREM2 in Relation to Alzheimer's Disease Biomarkers and Clinical Outcomes.Front Aging Neurosci. 2021 Jun 29;13:676744. doi: 10.3389/fnagi.2021.676744. eCollection 2021. Front Aging Neurosci. 2021. PMID: 34276339 Free PMC article.
-
Association of soluble TREM2 with Alzheimer's disease and mild cognitive impairment: a systematic review and meta-analysis.Front Aging Neurosci. 2024 May 22;16:1407980. doi: 10.3389/fnagi.2024.1407980. eCollection 2024. Front Aging Neurosci. 2024. PMID: 38841103 Free PMC article.
-
TREM2 ectodomain and its soluble form in Alzheimer's disease.J Neuroinflammation. 2020 Jul 7;17(1):204. doi: 10.1186/s12974-020-01878-2. J Neuroinflammation. 2020. PMID: 32635934 Free PMC article. Review.
Cited by
-
Early Diagnosis of Alzheimer's Disease: Moving Toward a Blood-Based Biomarkers Era.Clin Interv Aging. 2023 Mar 6;18:353-358. doi: 10.2147/CIA.S394821. eCollection 2023. Clin Interv Aging. 2023. PMID: 36911809 Free PMC article. No abstract available.
-
TREM2-Mediated Myeloid Cells Protect Against Pathological Choroidal Neovascularization.FASEB J. 2025 Jul 31;39(14):e70881. doi: 10.1096/fj.202501793R. FASEB J. 2025. PMID: 40716081 Free PMC article.
-
Soluble TNFR1 has greater reproducibility than IL-6 for the assessment of chronic inflammation in older adults: the case for a new inflammatory marker in aging.Geroscience. 2024 Apr;46(2):2521-2530. doi: 10.1007/s11357-023-01006-x. Epub 2023 Nov 23. Geroscience. 2024. PMID: 37993568 Free PMC article.
-
Advances in the Understanding of the Correlation Between Neuroinflammation and Microglia in Alzheimer's Disease.Immunotargets Ther. 2024 Jun 12;13:287-304. doi: 10.2147/ITT.S455881. eCollection 2024. Immunotargets Ther. 2024. PMID: 38881647 Free PMC article. Review.
-
Microglia, Trem2, and Neurodegeneration.Neuroscientist. 2025 Apr;31(2):159-176. doi: 10.1177/10738584241254118. Epub 2024 May 20. Neuroscientist. 2025. PMID: 38769824 Free PMC article. Review.
References
-
- 2020. 2020 Alzheimer’s disease facts and figures. Alzheimer’s & dementia : the journal of the Alzheimer’s Association. - PubMed
-
- Jack CR Jr., Knopman DS, Jagust WJ, Petersen RC, Weiner MW, Aisen PS, Shaw LM, Vemuri P, Wiste HJ, Weigand SD, Lesnick TG, Pankratz VS, Donohue MC, Trojanowski JQ. 2013. Tracking pathophysiological processes in Alzheimer’s disease: an updated hypothetical model of dynamic biomarkers. Lancet neurology. 12: 207–216. - PMC - PubMed
-
- Kidd PM 2008. Alzheimer’s disease, amnestic mild cognitive impairment, and age-associated memory impairment: current understanding and progress toward integrative prevention. Altern Med Rev. 13: 85–115. - PubMed
Publication types
MeSH terms
Substances
Grants and funding
LinkOut - more resources
Full Text Sources
Medical
Research Materials
