. 2022 Jun;33(6):1154-1171.
doi: 10.1681/ASN.2021070997. Epub 2022 May 6.

Tumor Lysis Syndrome and AKI: Beyond Crystal Mechanisms

Affiliations

Tumor Lysis Syndrome and AKI: Beyond Crystal Mechanisms

Marine Arnaud et al. J Am Soc Nephrol. 2022 Jun.

Abstract

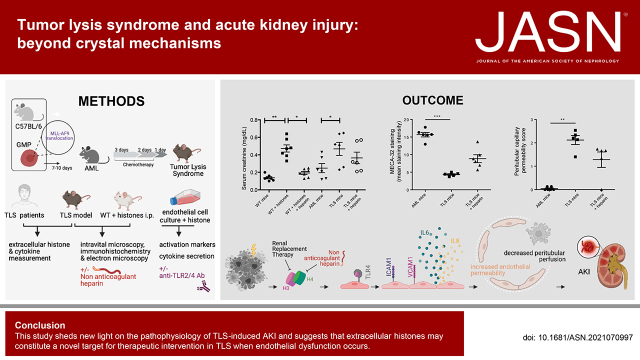
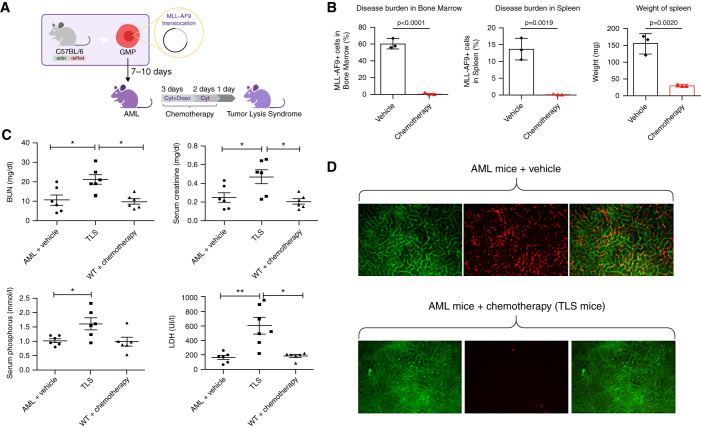
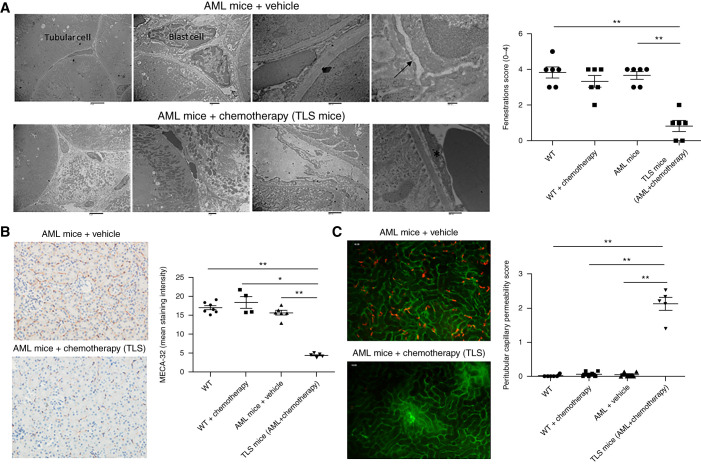
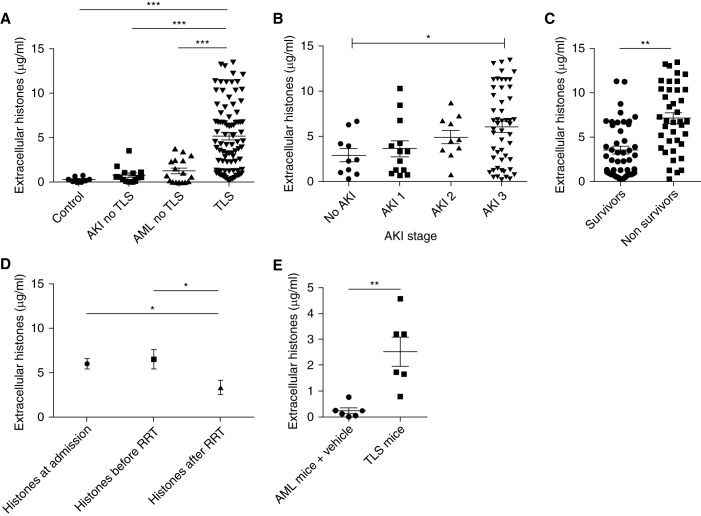
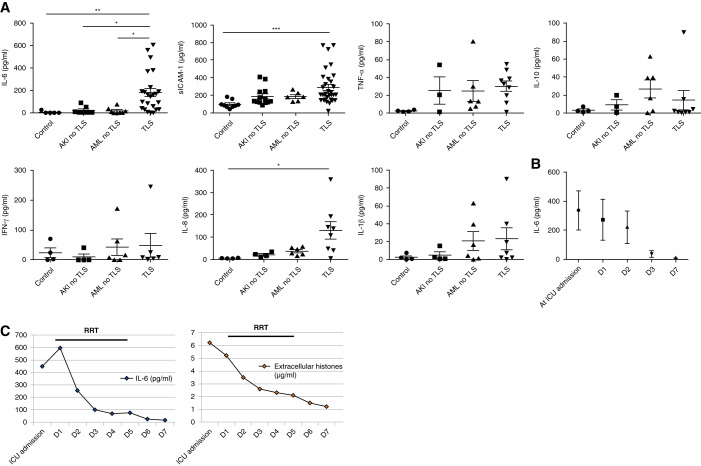
Background: The pathophysiology of AKI during tumor lysis syndrome (TLS) is not well understood due to the paucity of data. We aimed to decipher crystal-dependent and crystal-independent mechanisms of TLS-induced AKI.

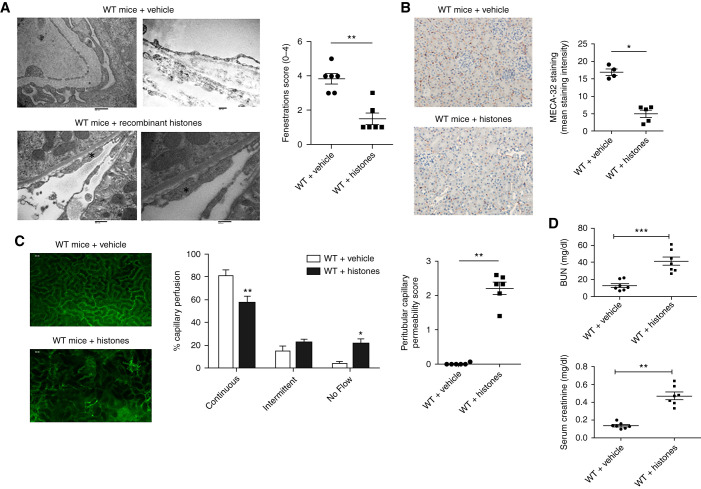
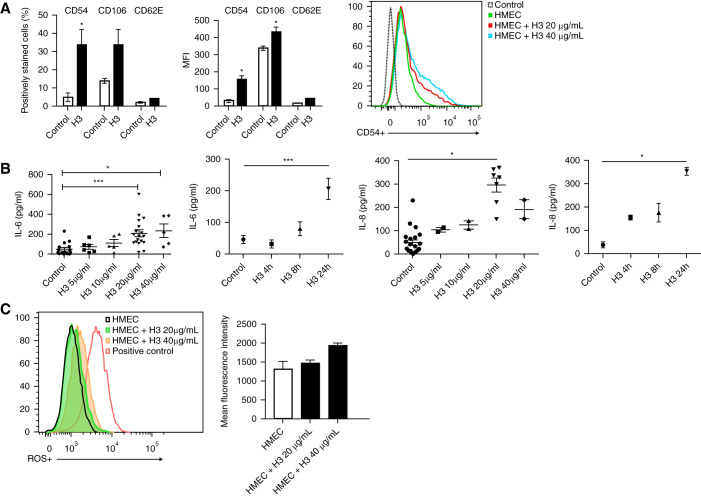
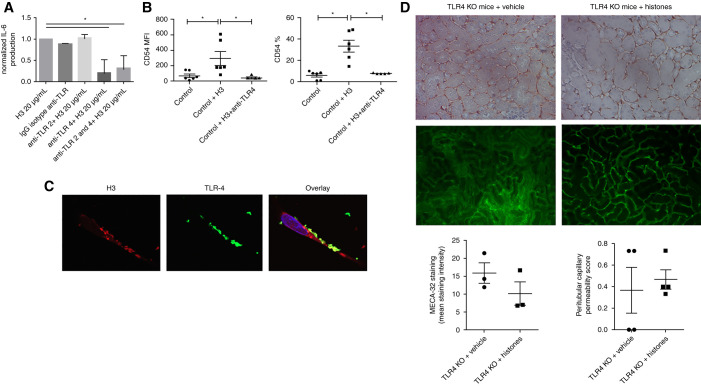
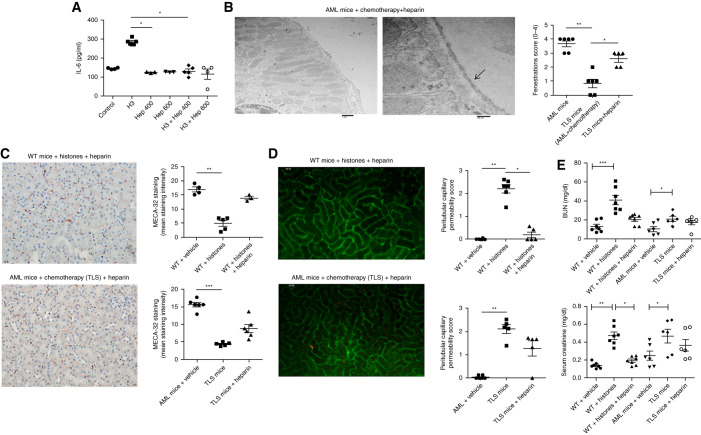
Methods: Crystalluria, plasma cytokine levels, and extracellular histones levels were measured in two cohorts of patients with TLS. We developed a model of TLS in syngeneic mice with acute myeloid leukemia, and analyzed ultrastructural changes in kidneys and endothelial permeability using intravital confocal microscopy. In parallel, we studied the endothelial toxicity of extracellular histones in vitro. RESULTS: The study provides the first evidence that previously described crystal-dependent mechanisms are insufficient to explain TLS-induced AKI. Extracellular histones that are released in huge amounts during TLS caused profound endothelial alterations in the mouse model. The mechanisms of histone-mediated damage implicates endothelial cell activation mediated by Toll-like receptor 4. Heparin inhibits extracellular histones and mitigates endothelial dysfunction during TLS.

Conclusion: This study sheds new light on the pathophysiology of TLS-induced AKI and suggests that extracellular histones may constitute a novel target for therapeutic intervention in TLS when endothelial dysfunction occurs.

Keywords: acute renal failure; endothelium; histones; tumor lysis syndrome.


Figures

None
Graphical abstract
Figure 1.
Figure 1.
Biochemical and microscopic analysis of a mouse model of AML mice show significant TLS after administration of chemotherapy. (A) Model of TLS in AML mice. (B) Disease (percent MLL-AF9+ blasts) in the bone marrow and spleen of MLL-AF9 mice after treatment with vehicle or with chemotherapy (24 hours after treatment). n=3 per group. (C) BUN, LDH, serum creatinine, and phosphate were measured in AML mice treated with vehicle (n=6) or chemotherapy (cytarabine + doxorubicin; n=6) and WT mice treated with chemotherapy (n=6) 24 hours after treatment. (D) In vivo renal intravital microscopy in MLL-AF9 mice that received vehicle or chemotherapy. MLL-AF9 leukemic blasts are DsRED positive and visible in renal peritubular capillaries. After chemotherapy, blast cell infiltration is no longer visible. All data are presented as mean±SEM *P<0.05, **P<0.01 versus vehicle, Mann–Whitney test.
Figure 2.
Figure 2.
Peritubular endothelium is significantly altered in TLS leukemic mice. (A) Peritubular capillaries undergo ultrastructural alterations in TLS mice. Details of peritubular capillaries in transmission electron are shown for MLL-AF9 mice and TLS mice. Capillaries from MLL-AF9 kidneys had a flat endothelium with regular contours and multiple fenestrations (arrows). During TLS, the capillary shape became more irregular and the endothelium became swollen and lost fenestrations (asterisk). Leukemic blasts infiltrating the peritubular capillaries are seen in MLL-AF9 mice. A semiquantitative analysis showed that, compared with WT, MLL-AF9, and WT+chemotherapy kidneys, the capillary area with fenestrations was significantly decreased in TLS mice (n=6 per group). Scales bars, 6 μm in left, 1 μm in middle-left, 500 nm in middle-right, 200 nm in right panel. (B) Kidneys from WT mice treated with vehicle, WT mice receiving chemotherapy, and AML mice receiving chemotherapy (TLS mice) or vehicle were immunostained with a panendothelial cell antigen antibody (MECA-32). Decreased peritubular capillary staining was observed in TLS (peritubular capillary density, as quantified by computer image analysis of MECA-32 immunostaining). n=6 per group. Original magnification, 200×. (C) Peritubular capillary permeability in WT mice treated with vehicle, WT mice receiving chemotherapy, TLS mice, or AML mice. Analysis of interstitial leakage of albumin-FITC was performed using confocal videomicroscopy. Representative still images from the captured videos at 10 minutes in AML mice and TLS mice are presented in (C). Increased peritubular capillary permeability was observed after TLS. n=5–6 per group. *P<0.05, **P<0.01, Mann–Whitney test.
Figure 3.
Figure 3.
Circulating histones are elevated in patient plasma during TLS and in a mouse model of TLS. (A) Plasma histone concentrations were determined in four independent cohorts of patients. n=84 patients with TLS, n=8 controls, n=14 patients with AKI without TLS, n=17 patients with acute leukemia without TLS (Kruskal–Wallis test with Dunn post-test). (B) Plasma histone concentrations are shown according to AKI stage in patients with TLS-AKI (Kruskal–Wallis test with Dunn post-test). (C) Plasma histone concentrations in survivors and nonsurvivors at day 28 (paired t test). (D) Kinetic of plasma histones concentrations in patients who required RRT (hemodialysis; n=24) before and after a single session of 6 hours of RRT (Kruskal–Wallis test with Dunn post-test). (E) Extracellular histone concentrations in the AML mouse model with or without TLS. n=6 per group (Mann–Whitney test). All data are presented as mean±SEM. *P<0.05, **P<0.01, ***P<0.001.
Figure 4.
Figure 4.
Recombinant histones induce endothelial dysfunction in vivo. (A) Peritubular capillaries undergo ultrastructural alterations in mice injected with recombinant histones (25 mg/kg). Twenty-four hours after histone injection, the endothelium became swollen and lost fenestrations (asterisk). A semiquantitative analysis showed that, compared with WT mice, the capillary area with fenestrations was significantly decreased. n=6 per group. Scale bars, 600 nm in left panel, 400 nm in right panel. (B) Kidneys from WT mice receiving vehicle and histones were immunostained with anti-mouse panendothelial cell antigen antibody (MECA-32). Decreased peritubular capillary staining was observed 24 hours after recombinant histone injection. Peritubular capillary density was quantified by computer image analysis of MECA-32 immunostaining. n=5 per group. Original magnification, 200×. (C) Representative still images from the captured videos of peritubular capillaries in WT mice injected with vehicle or recombinant histones at 25 mg/kg. Analysis of interstitial leakage of albumin-FITC and capillary perfusion were performed using confocal videomicroscopy. Increased peritubular capillary permeability was observed 24 hours after histone exposure. Capillary perfusion also decreased in some areas of the kidney after histone exposure. n=6 per group. (D) BUN and serum creatinine were measured in WT mice treated with vehicle (n=7) or recombinant histones (n=7) 24 hours after treatment. *P<0.05, **P<0.01, ***P<0.001, compared with WT mice, Mann–Whitney test.
Figure 5.
Figure 5.
Endothelial cells are activated by extracellular histones in vitro. (A) CD54, CD106, and CD62E expression were assessed in ECs activated with recombinant histones. Mean fluorescence intensity (MFI) and percentage of CD54+, CD106+, and CD62E+positive ECs nonactivated or activated with 20 μg/ml histones over 24 hours. Representative plots for CD54 expression are gated on microvascular ECs (HMECs). Mean±SEM is shown from four to six independent experiments. Mann–Whitney test. (B) IL-6 and IL-8 levels in the supernatant of HMEC treated with histones at the indicated concentrations (5, 10, 20, 40 μg/ml) and different time points at 20 μg/ml. Mean±SEM is shown from four to ten independent experiments. Kruskal–Wallis test with Dunn post-test. (C) Effect of histones on reactive oxygen species (ROS) production. HMECs were treated with histones at the indicated concentrations. Production of ROS by live cells was analyzed by flow cytometry using the CellROX™ Green Flow Cytometry Assay Kit. Tert-butyl hydroperoxide (THBP) solution, an inducer of ROS, was used as positive control. Kruskal–Wallis test with Dunn post-test. *P<0.05, ***P<0.001.
Figure 6.
Figure 6.
TLR4, but not TLR2, was implicated in histone-mediated activation of ECs. (A) HMECs were preincubated with mouse isotype control IgG (Iso-IgG, 50 μg/ml), mouse anti-human TLR2 (anti-TLR2, 50 μg/ml), and/or anti-human TLR4 (anti-TLR4, 50 μg/ml) for 60 minutes, and then stimulated with 20 μg/ml histones (H3) for 24 hours. The secretion of IL-6 was then determined by ELISA. Data are presented as mean±SEM from four different experiments. (B) HMECs were preincubated with anti-TLR4 for 60 minutes (TAK-242, 1 μM) and stimulated with 20 μg/ml histones (H3) for 24 hours. Mean fluorescence intensity (MFI) and percentage of CD54-positive ECs after histones ±TAK-242 exposure. Data are presented as mean±SEM from six different experiments. (C) TLR4 and extracellular H3 colocalize in ECs. Confocal images showed the localization of histones H3 (red) and TLR4 (green) in ECs. 4′,6-Diamidino-2-phenylindole (blue) was used to stain the nuclei. (D) MECA-32 staining by immunohistochemistry and peritubular capillary permeability (intravital confocal microscopy) in TLR4 knockout (TLR4 KO) mice injected with vehicle or histones (24 hours after injection of 25 mg/kg of recombinant histones). No difference was observed between the two groups (Mann–Whitney test). n=4 per group. *P<0.05, Mann–Whitney test.
Figure 7.
Figure 7.
Endothelial dysfunction markers were elevated in plasma of patients with TLS. (A) Plasma cytokine concentrations (multiplex analysis) in four independent cohorts of patients: n=7–27 patients with TLS, n=4–9 controls, n=3–13 patients with AKI without TLS, and n=6–8 patients with acute leukemia without TLS. Values are expressed as mean±SEM. (B) Time course of plasma IL-6 concentrations in nine patients with TLS. (C) Time course of IL-6 and extracellular histones concentrations. The left panel shows the kinetic of plasma IL-6 concentration in one patient with TLS from ICU admission to day 7 (D7) and the parallel decrease of extracellular histones concentrations from ICU admission to D7. *P<0.05, **P<0.01, ***P<0.001, Kruskal–Wallis test with Dunn post-test.
Figure 8.
Figure 8.
Heparin mitigates the effect of extracellular histones and TLS on renal endothelial dysfunction. (A) IL-6 in the supernatant of ECs (HRGECs/HMECs) treated with 20 μg/ml histones and heparin at the indicated concentrations (400 and 600 μg/ml) for 24 hours. Mean±SEM is shown from four to ten independent experiments. *P<0.05, Mann–Whitney test. (B) Peritubular capillaries were examined by transmission electron microscopy in MLL-AF9 mice and TLS mice, having received chemotherapy and heparin 3 mg/kg twice a day 24 hours before and during the administration of chemotherapy. Capillaries from these mice have a flat endothelium with multiple fenestrations (arrows). A semiquantitative analysis showed that, compared with TLS mice without heparin, the capillary area with fenestrations was significantly increased. n=6 per group. Scale bars, 1 μm in left panel, 200 nm in right panel. *P<0.05, **P<0.01, Mann–Whitney test. (C) Kidneys from WT mice injected with histones and heparin (left panel) and TLS mice receiving heparin (right panel) were immunostained with panendothelial cell antigen antibody (MECA-32). Decreased peritubular capillary staining was observed after TLS or histone exposure, but not after heparin administration. Peritubular capillary density was quantified by computer image analysis of MECA-32 immunostaining. n=4–6 per group. Original magnification, 200×. **P<0.01, Mann–Whitney test. (D) Representative still images extracted after 10 minutes from videos of peritubular capillaries of WT mice injected with recombinant histones and heparin (left panel) and from TLS mice injected with heparin (right panel). Analysis of interstitial leakage of albumin-FITC and capillary perfusion were performed by confocal videomicroscopy. Increased peritubular capillary permeability was observed after TLS or exposure to histones, but not after heparin administration. n=5–6 per group. *P<0.05, **P<0.01, Mann–Whitney test. (E) BUN and serum creatinine were measured in WT mice treated with vehicle (n=7) or recombinant histones with (n=7) or without (n=7) heparin, in AML mice treated with vehicle (n=6), and TLS mice treated with (n=6) or without heparin (n=6). Nonanticoagulant heparin significantly decreased creatininemia of WT mice injected with histones. *P<0.005, **P<0.001, ***P<0.0001, Kruskal–Wallis test with Dunn post-test. Hep, heparin.

Comment in

Similar articles

Cited by

References

    1. Howard SC, Jones DP, Pui C-H: The tumor lysis syndrome. N Engl J Med 364: 1844–1854, 2011 - PMC - PubMed
    1. Zafrani L, Canet E, Darmon M: Understanding tumor lysis syndrome. Intensive Care Med 45: 1608–1611, 2019 - PubMed
    1. Soares M, Feres GA, Salluh JIF: Systemic inflammatory response syndrome and multiple organ dysfunction in patients with acute tumor lysis syndrome. Clinics (São Paulo) 64: 479–481, 2009 - PMC - PubMed
    1. Darmon M, Vincent F, Camous L, Canet E, Bonmati C, Braun T, et al. ; Groupe de Recherche en Réanimation Respiratoire et Onco-Hématologique (GRRR-OH) : Tumour lysis syndrome and acute kidney injury in high-risk haematology patients in the rasburicase era. A prospective multicentre study from the Groupe de Recherche en Réanimation Respiratoire et Onco-Hématologique. Br J Haematol 162: 489–497, 2013 - PubMed
    1. Boles JM, Dutel JL, Briere J, Mialon P, Robasckiewicz M, Garre M, et al. : Acute renal failure caused by extreme hyperphosphatemia after chemotherapy of an acute lymphoblastic leukemia. Cancer 53: 2425–2429, 1984 - PubMed

Publication types

LinkOut - more resources