. 2022 May 18;9(3):ENEURO.0074-22.2022.
doi: 10.1523/ENEURO.0074-22.2022. Print 2022 May-Jun.

Glutamate Transporters EAAT2 and EAAT5 Differentially Shape Synaptic Transmission from Rod Bipolar Cell Terminals

Affiliations

Glutamate Transporters EAAT2 and EAAT5 Differentially Shape Synaptic Transmission from Rod Bipolar Cell Terminals

Fu-Sheng Tang et al. eNeuro. .

Abstract

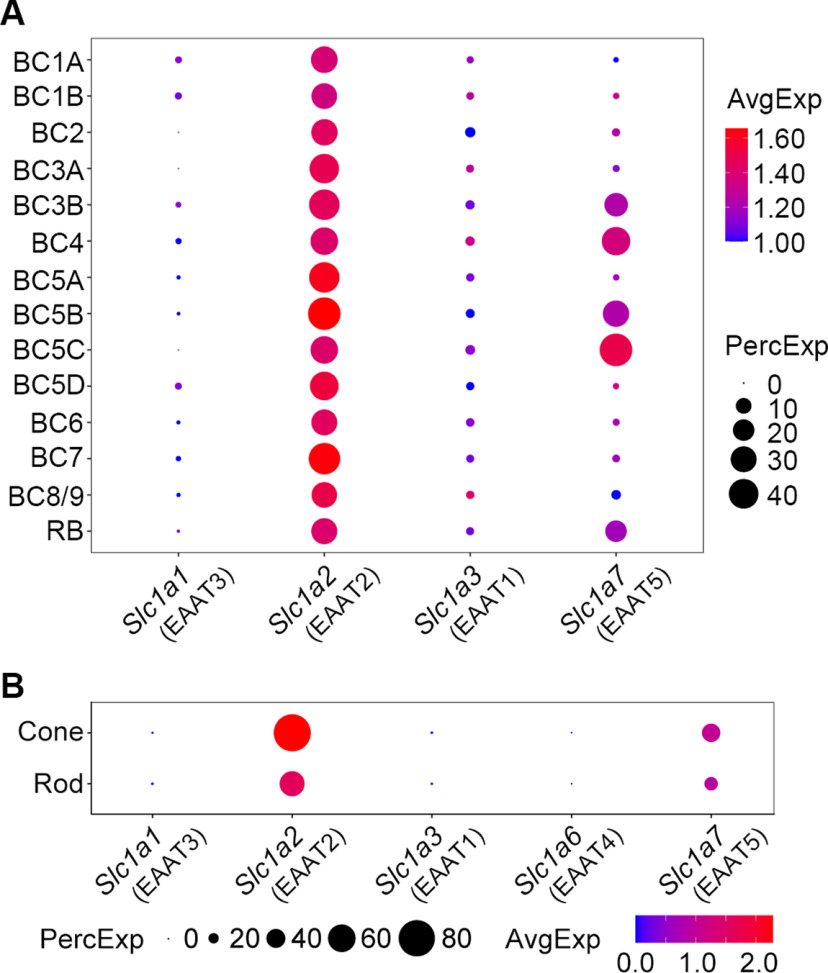
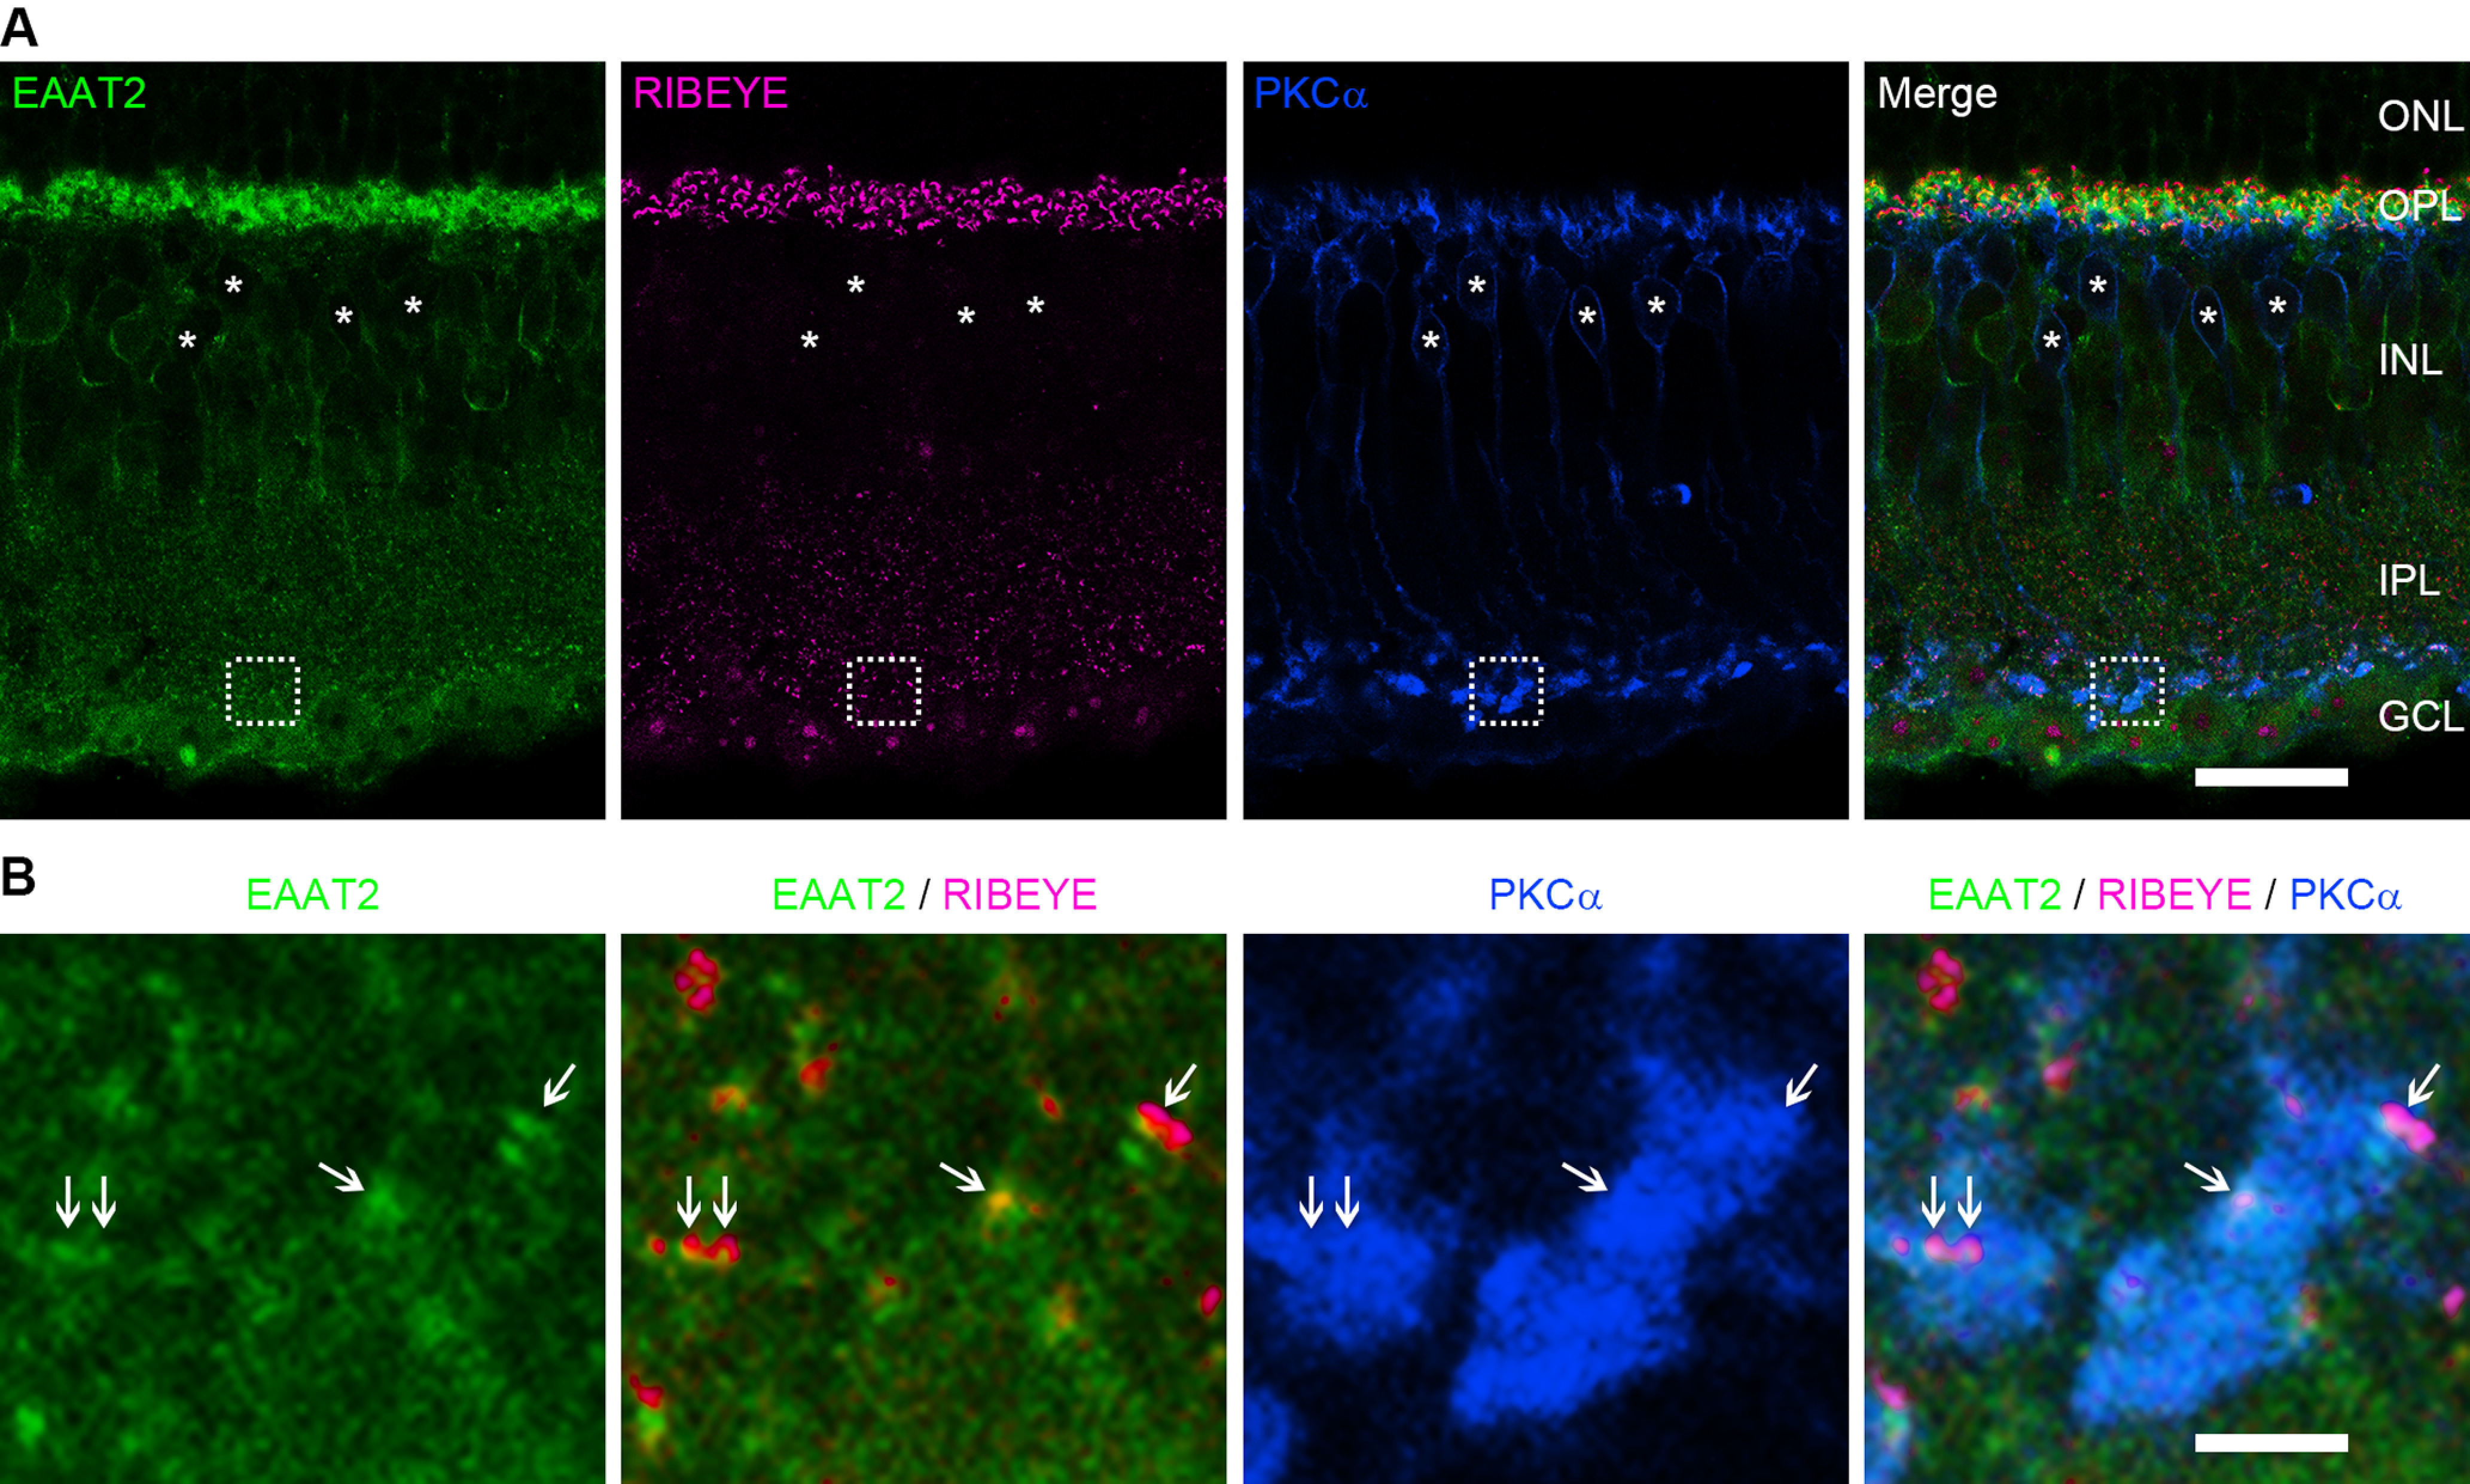
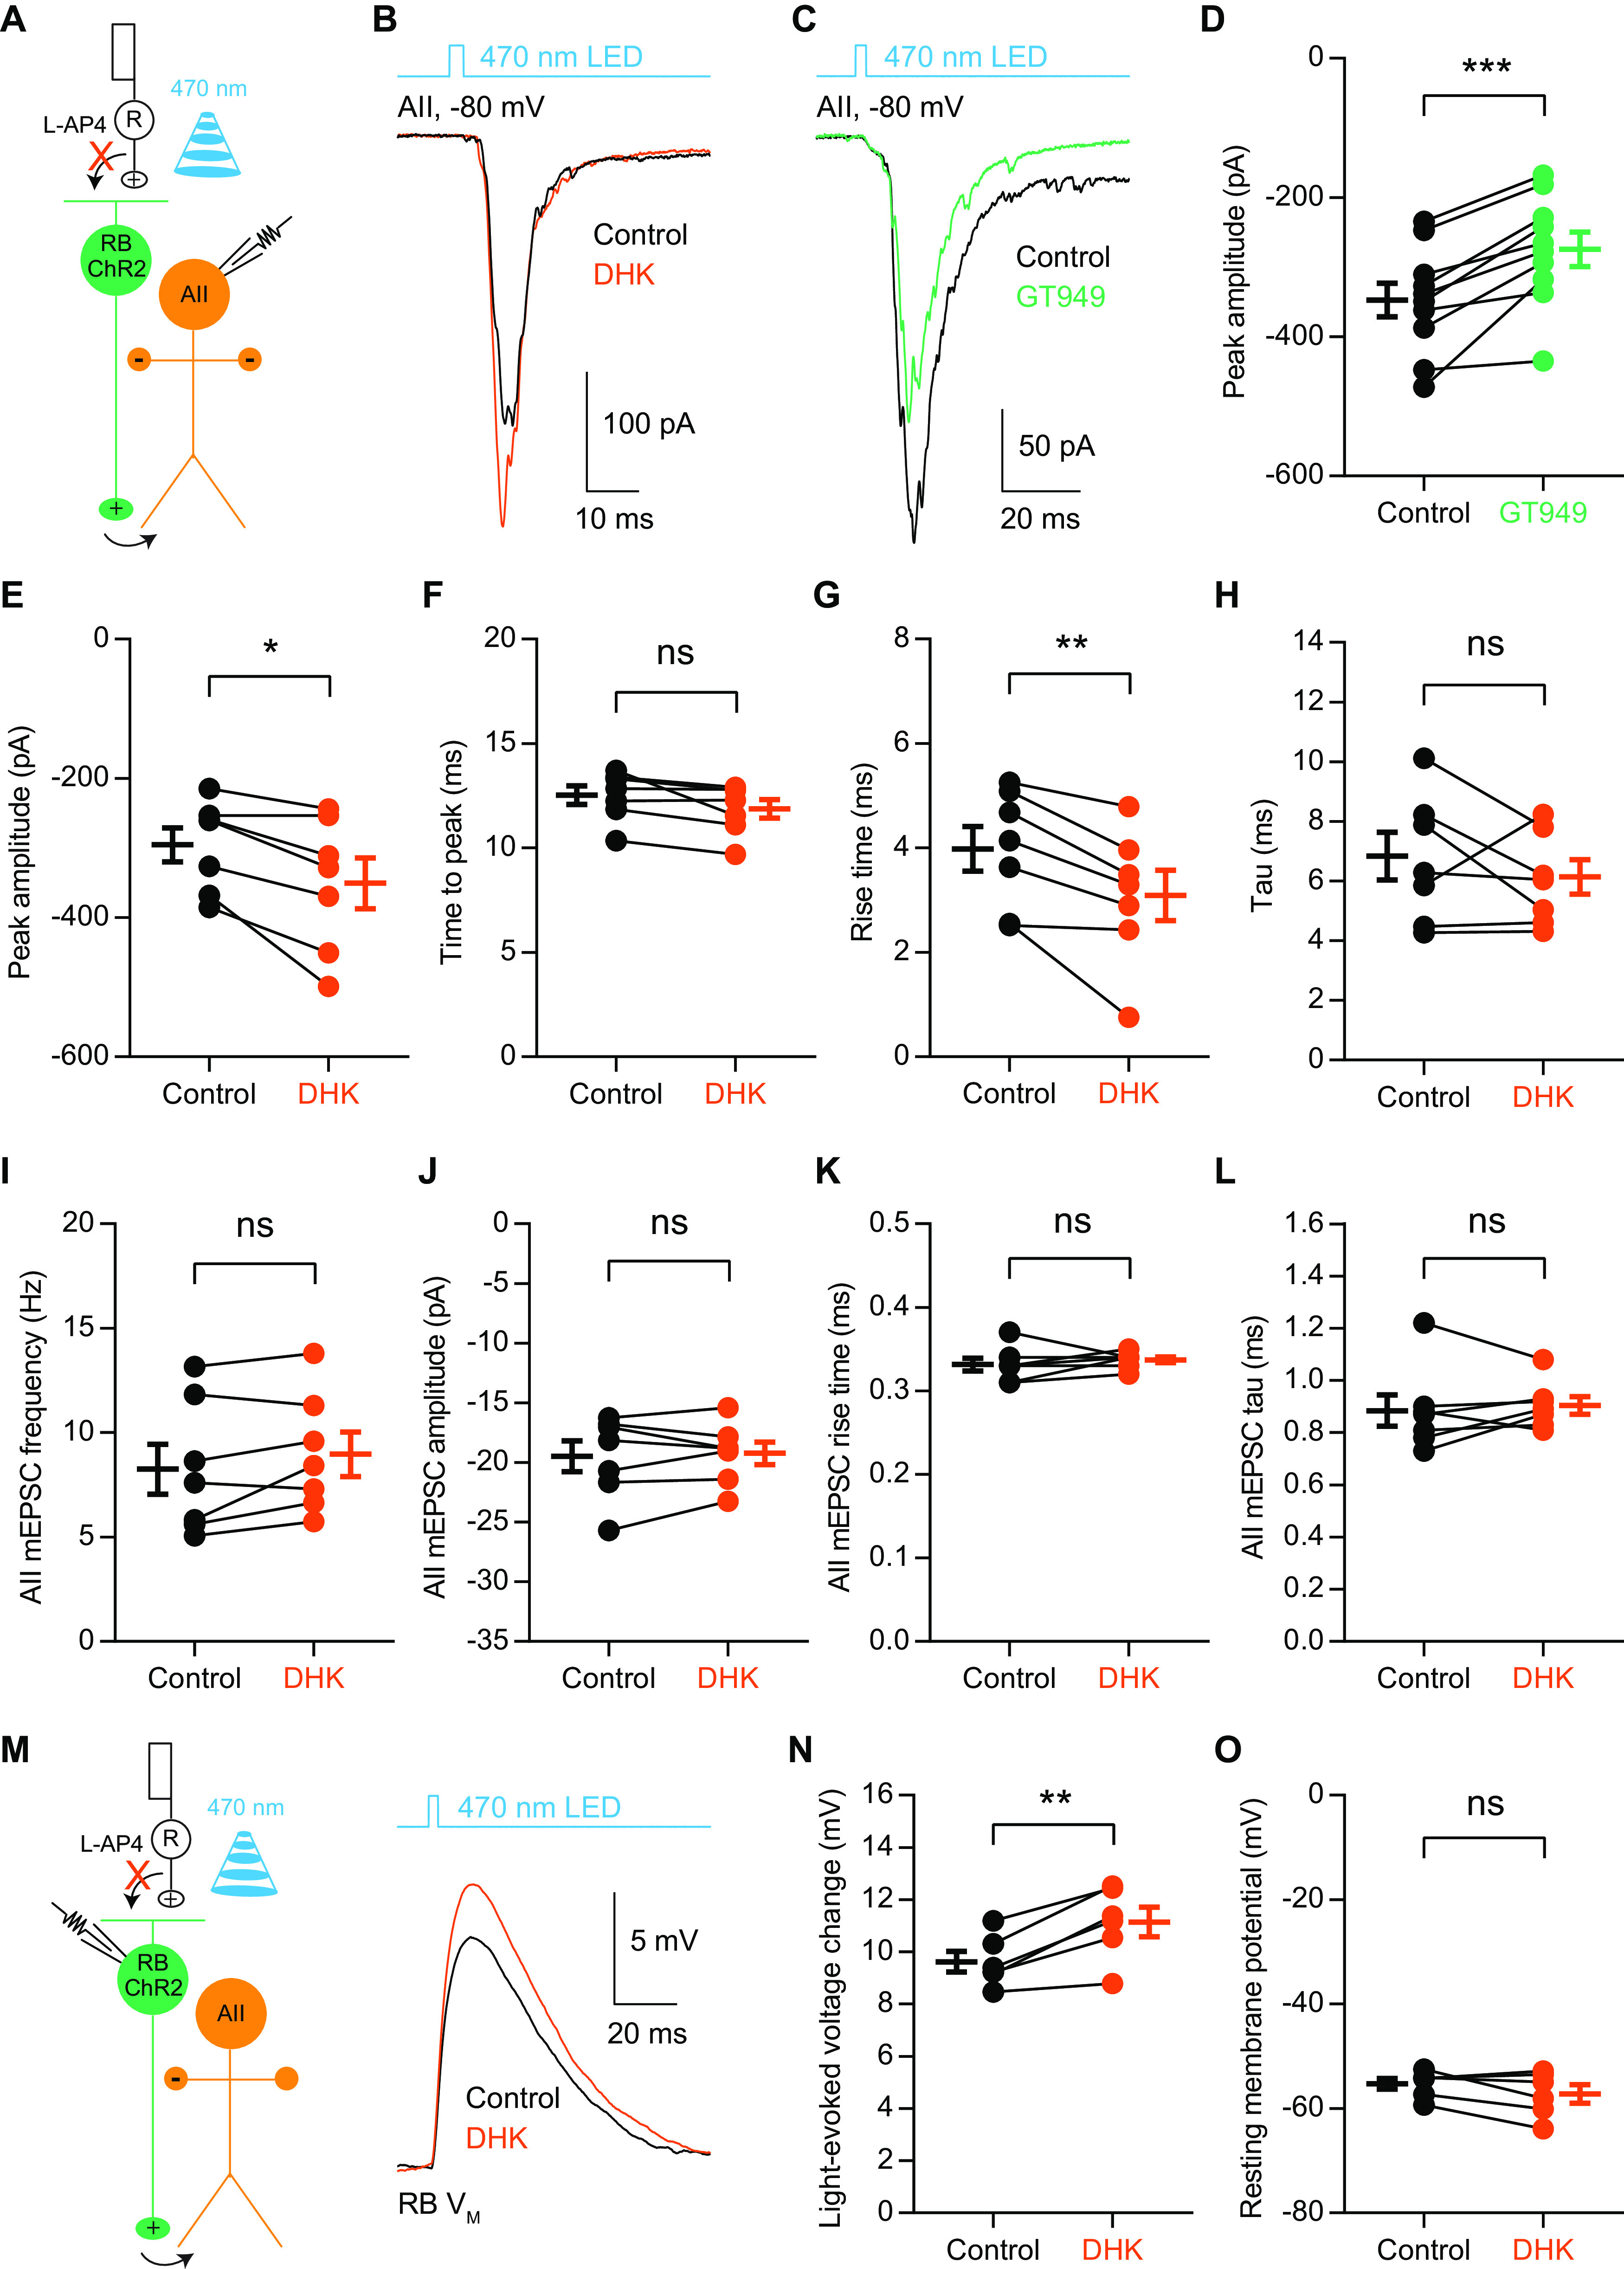
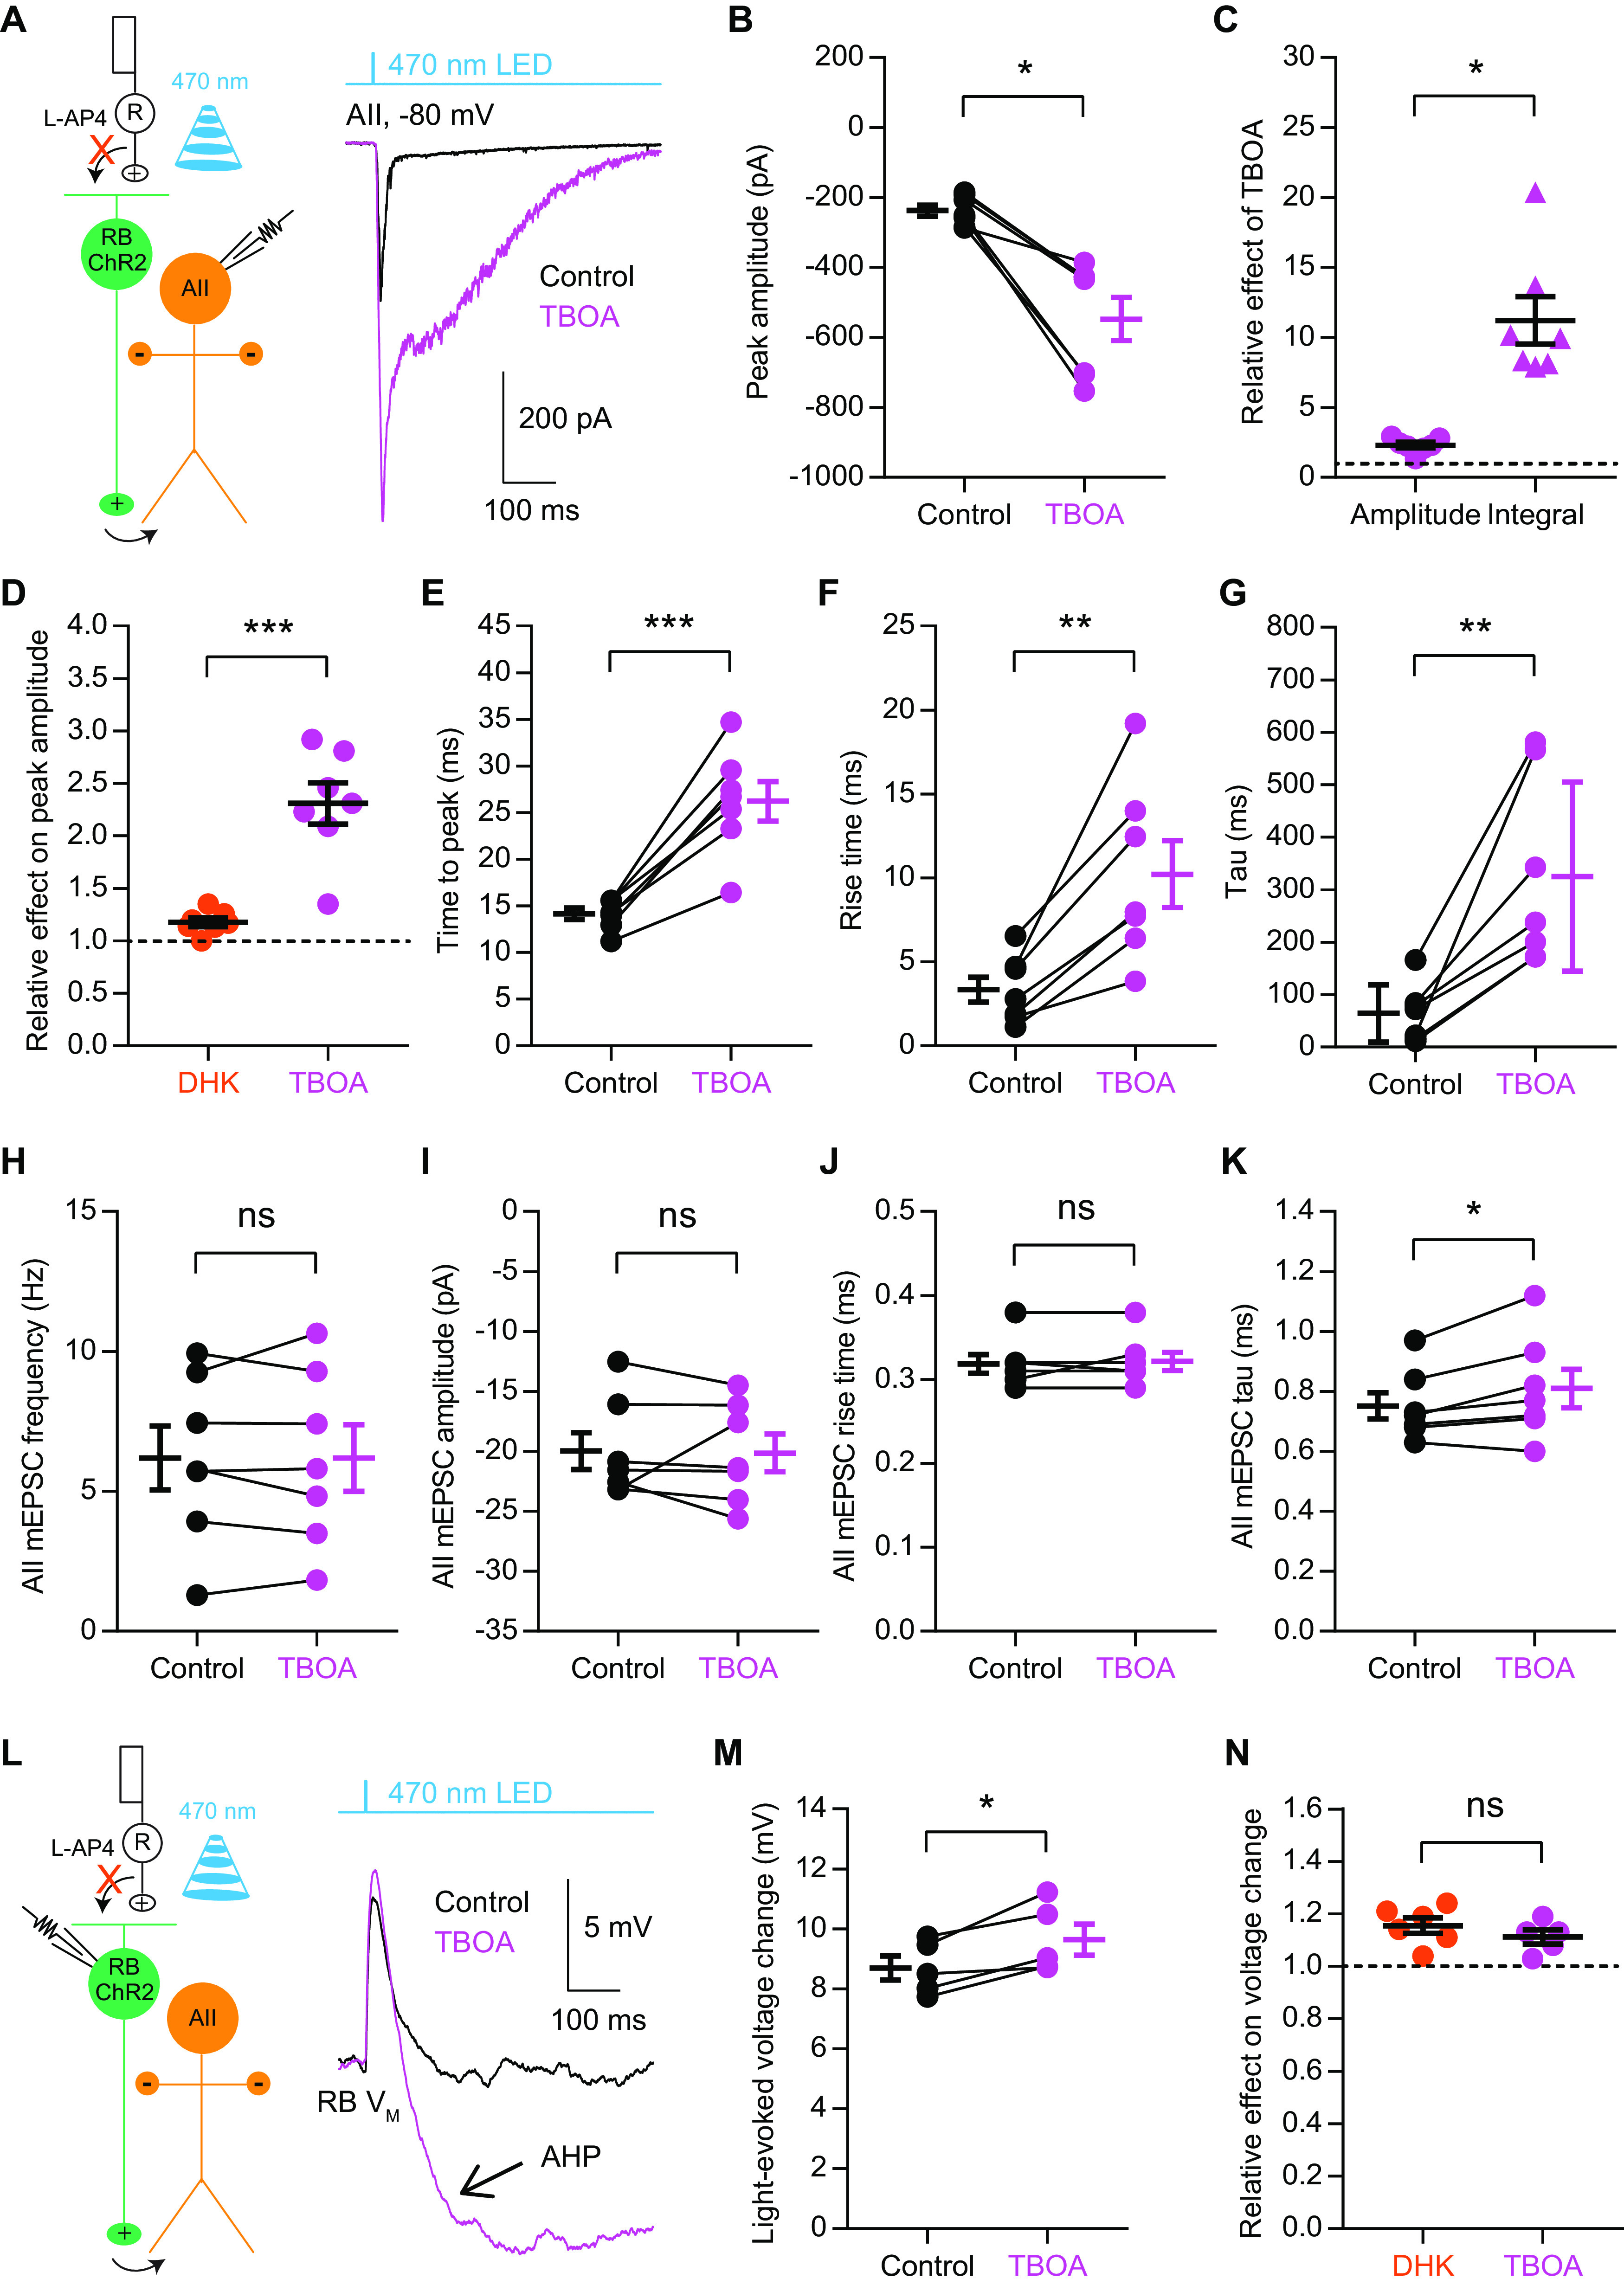
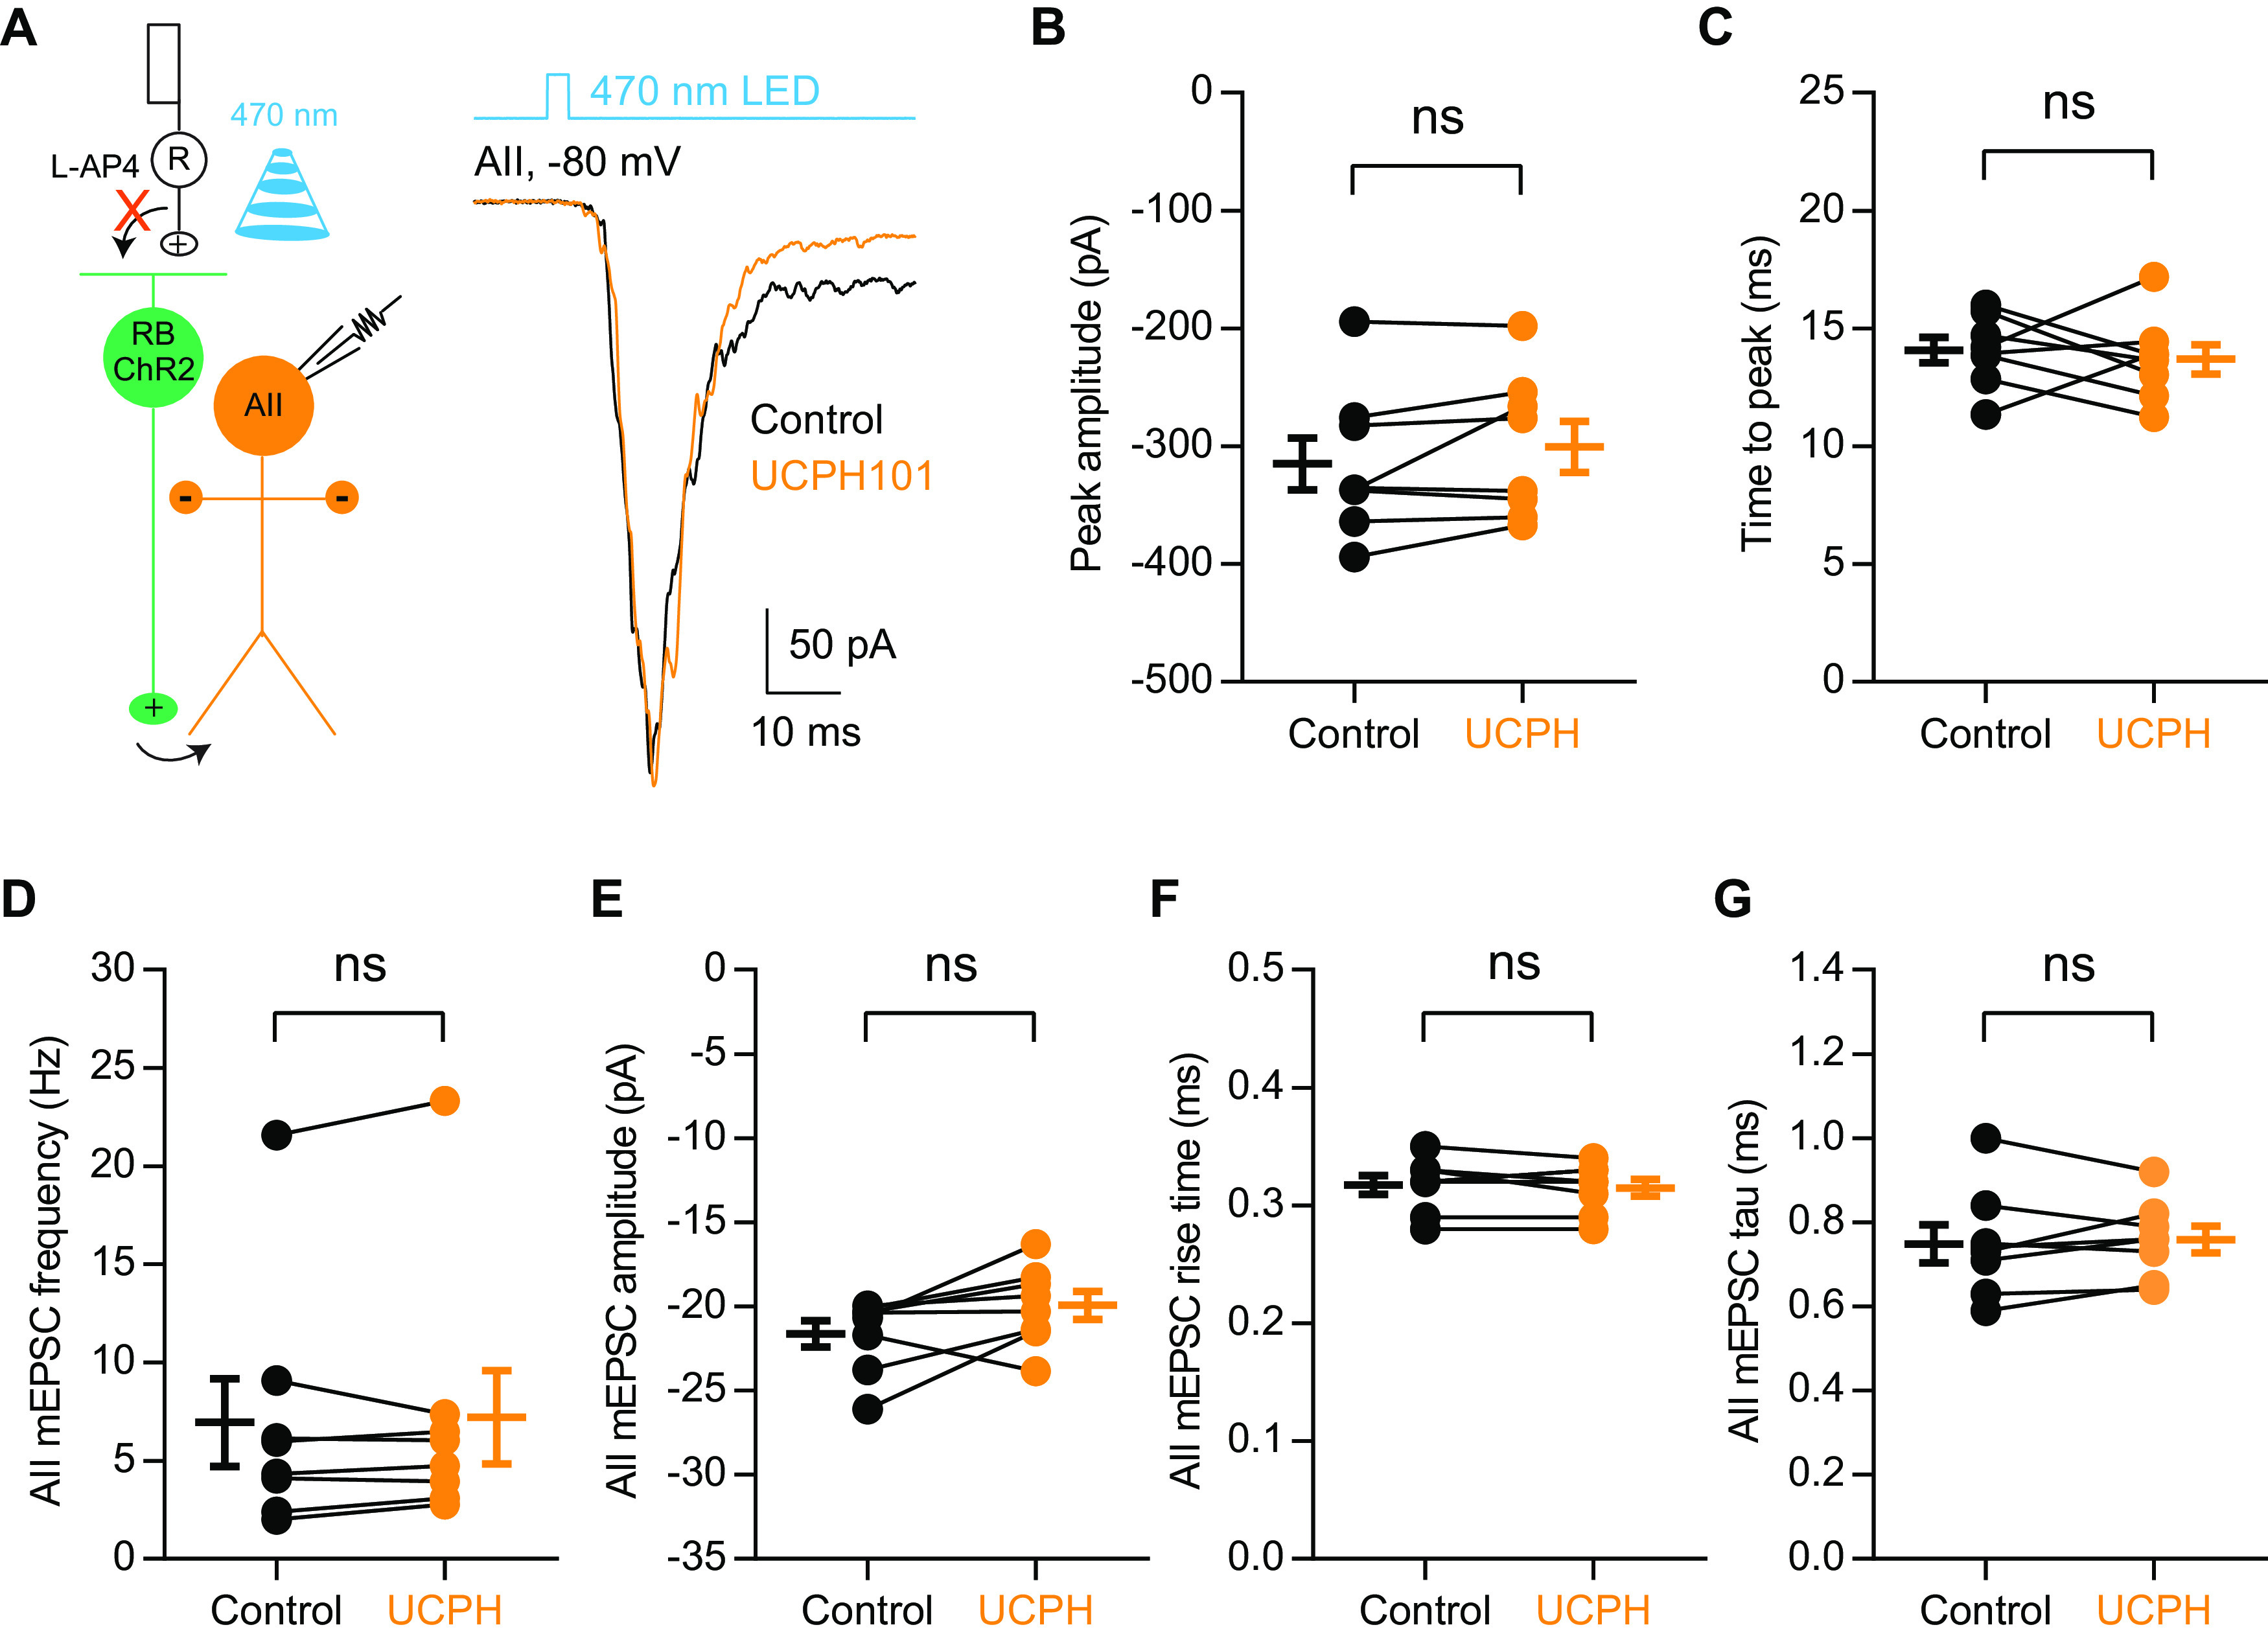
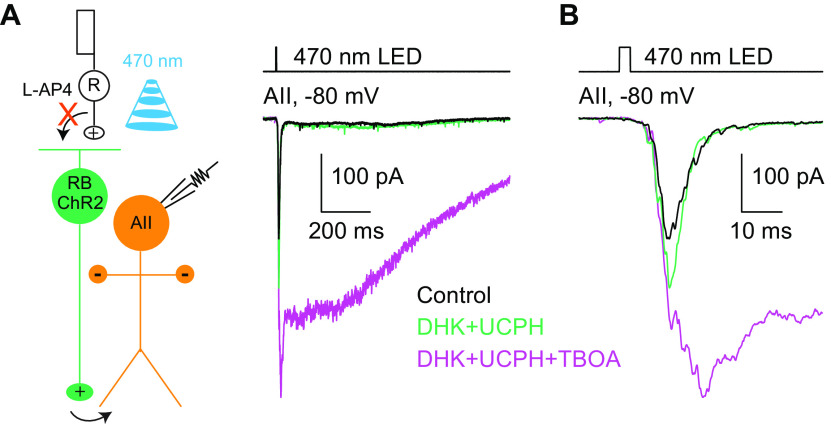
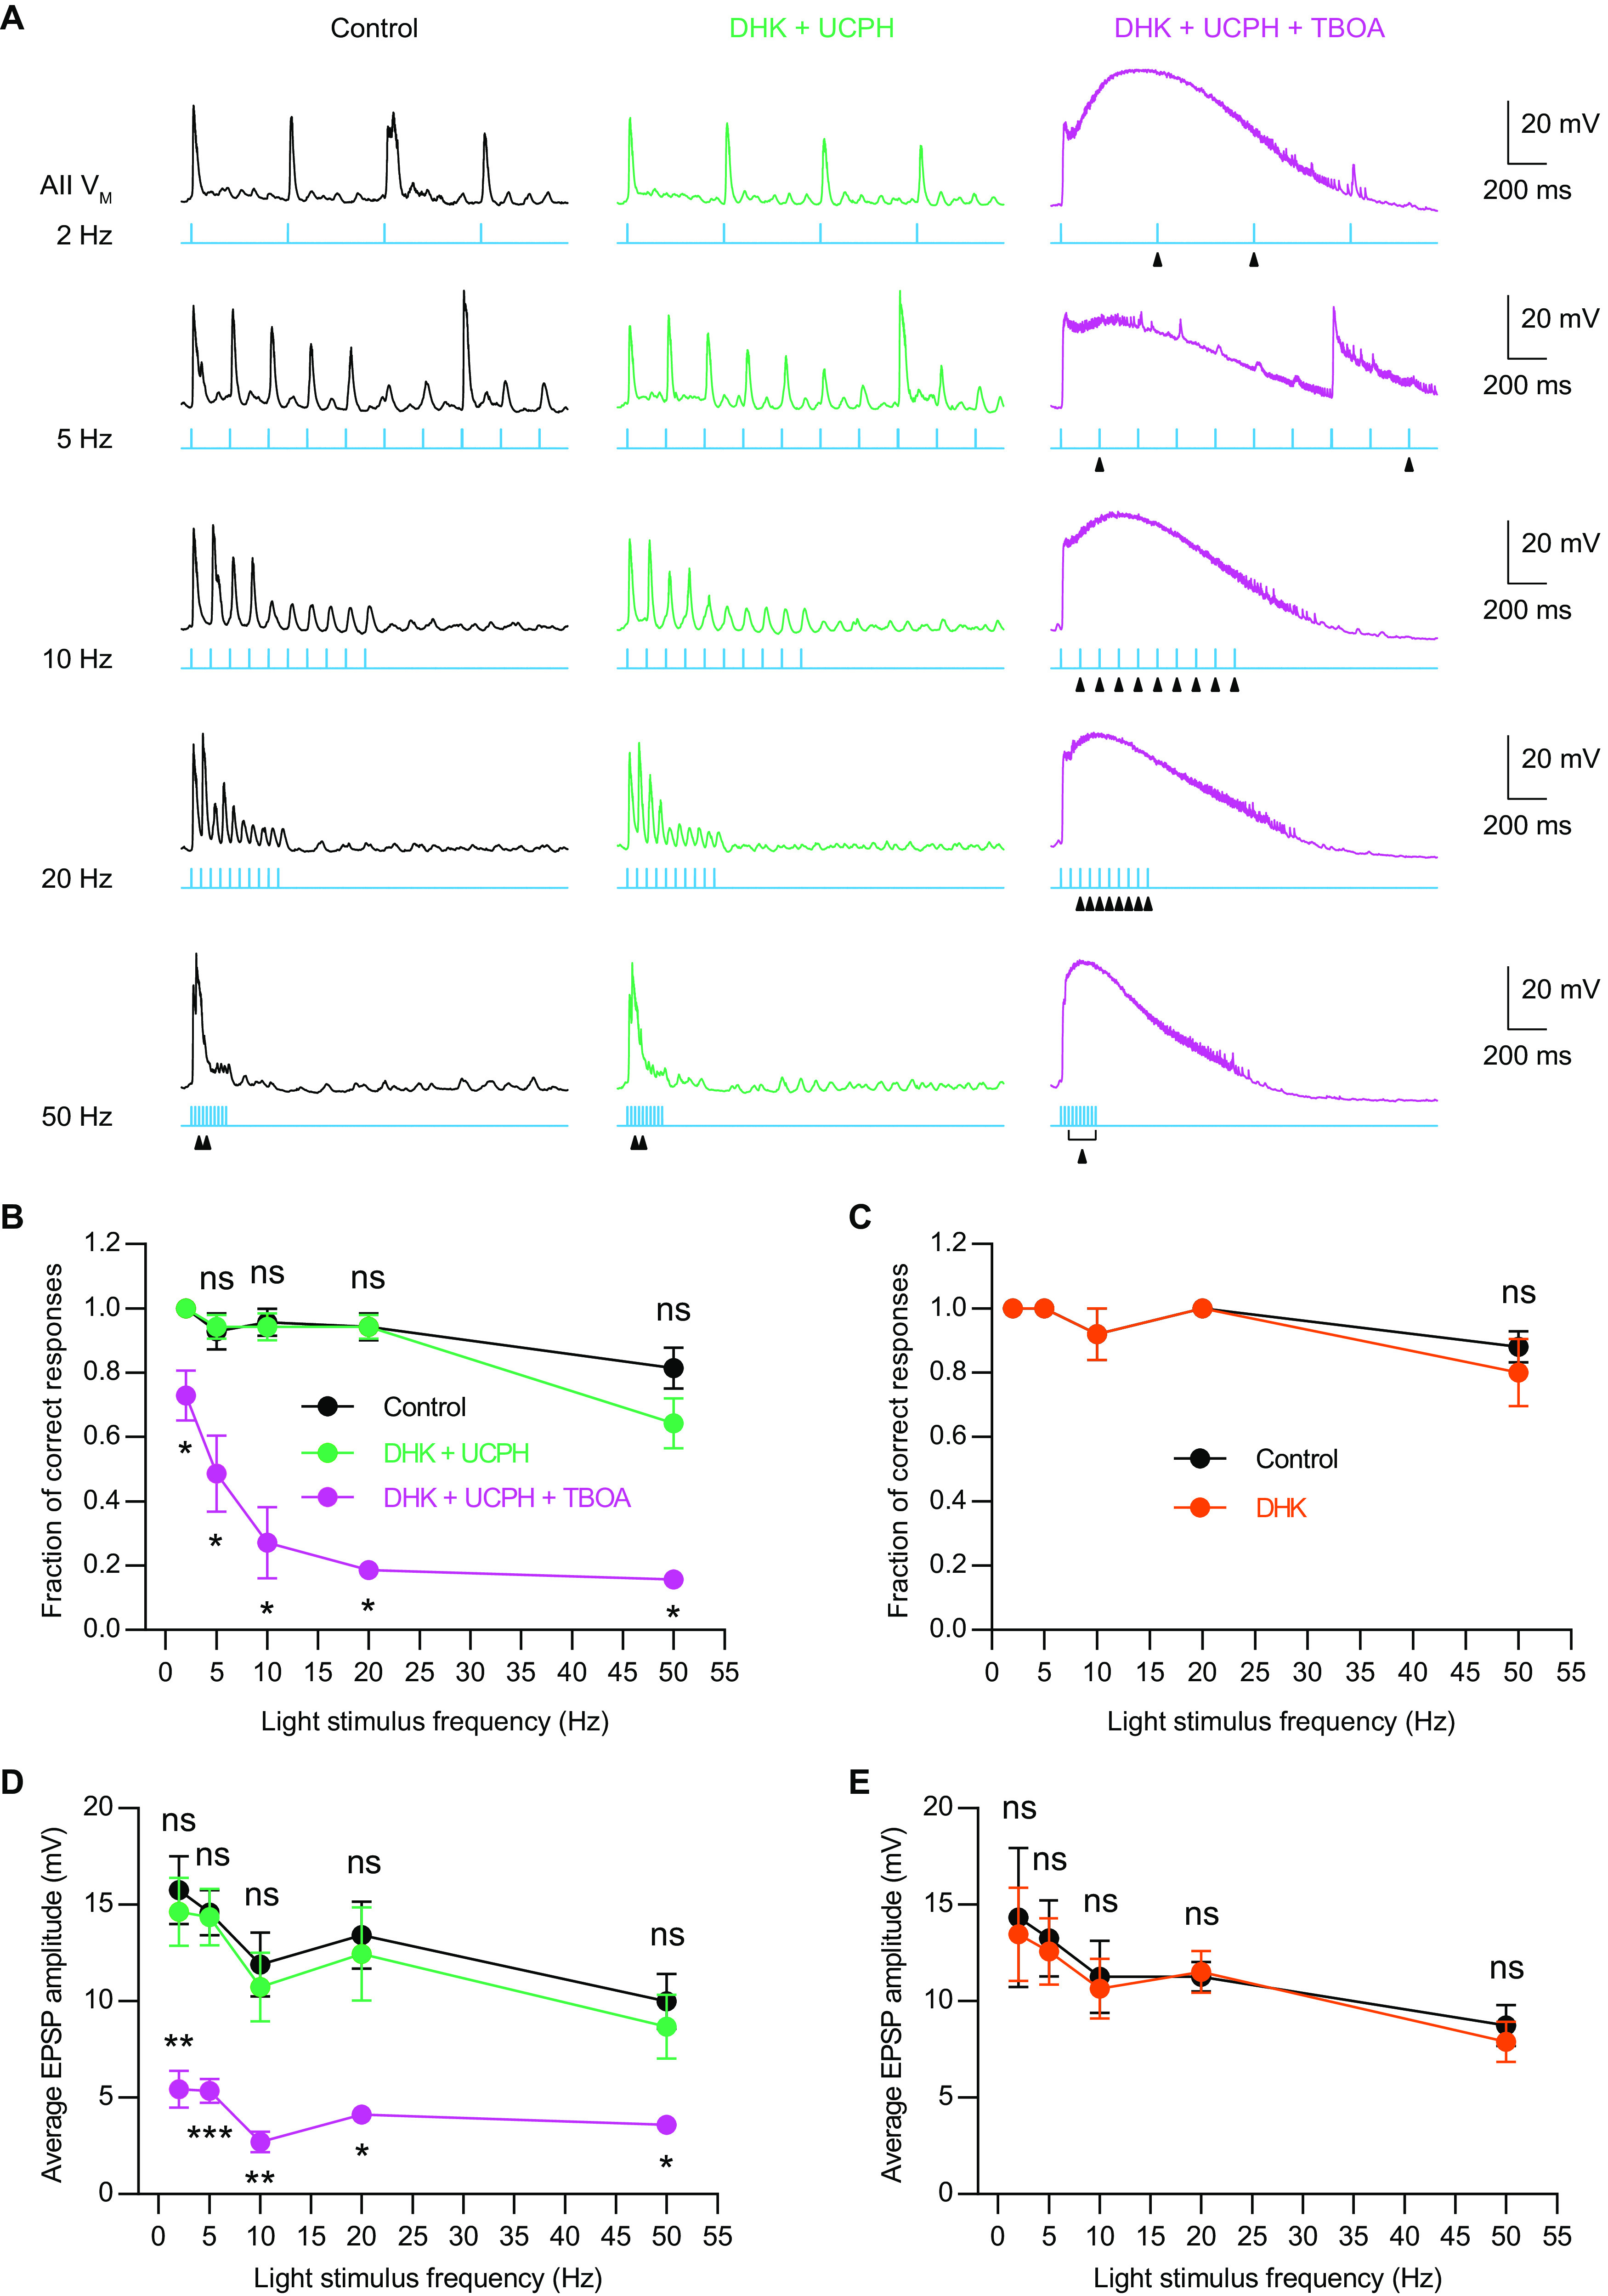
Excitatory amino acid transporters (EAATs) control visual signal transmission in the retina by rapidly removing glutamate released from photoreceptors and bipolar cells (BCs). Although it has been reported that EAAT2 and EAAT5 are expressed at presynaptic terminals of photoreceptors and some BCs in mammals, the distinct functions of these two glutamate transporters in retinal synaptic transmission, especially at a single synapse, remain elusive. In this study, we found that EAAT2 was expressed in all BC types while coexisting with EAAT5 in rod bipolar (RB) cells and several types of cone BCs from mice of either sex. Our immunohistochemical study, together with a recently published literature (Gehlen et al., 2021), showed that EAAT2 and EAAT5 were both located in RB axon terminals near release sites. Optogenetic, electrophysiological and pharmacological analyses, however, demonstrated that EAAT2 and EAAT5 regulated neurotransmission at RB→AII amacrine cell synapses in significantly different ways: EAAT5 dramatically affected both the peak amplitude and kinetics of postsynaptic responses in AIIs, whereas EAAT2 had either relatively small or opposite effects. By contrast, blockade of EAAT1/GLAST, which was exclusively expressed in Müller cells, showed no obvious effect on AII responses, indicating that glutamate uptake by Müller cells did not influence synaptic transmission from RB terminals. Furthermore, we found that temporal resolution at RB→AII synapses was reduced substantially by blockade of EAAT5 but not EAAT2. Taken together, our work reveals the distinct functions of EAAT2 and EAAT5 in signal transmission at RB ribbon synapses.

Keywords: amacrine cell; bipolar cell; glutamate transporter; retina; synaptic transmission; temporal resolution.


Figures

Figure 1.
Figure 1.
scRNA-seq data analysis reveals gene expression of EAAT2 in all mouse retinal BCs and co-expression with EAAT5 in several BC types. A, Gene expression patterns of EAATs in different types of BCs. The protein that each gene encodes is given in parentheses. The size of each circle represents the percentage of cells in the group (PercExp) in which the gene expression is detected. The color represents the average transcript count in expressing cells (AvgExp). BC, bipolar cell; RB, rod bipolar cell. B, Co-expression of EAAT2 and EAAT5 in cone and rod photoreceptors.
Figure 2.
Figure 2.
Co-expression of EAAT2 and EAAT5 in mouse retinal RBs is confirmed by scRT-PCR analysis. A, scRT-PCR analyses of EAAT2 and EAAT5 mRNA expression in a single RB cell from a P17 mouse retina and the other RB from an adult mouse retina. Co-expression of EAAT2 and EAAT5 could be seen in both RBs. A ladder with DNA fragments between 100 and 1000 bp is shown on the left. B, The percentages of EAAT2 and EAAT5 expression in individual RBs from both P17 and adult mice. See also Table 2. C, Schematic diagrams illustrating the molecular heterogeneity for EAAT2 and EAAT5 expression in individual RBs from P17 and adult mice. The percentages of either subtype and a combination of EAAT2 and EAAT5 are shown, and the exact cell numbers are given in parentheses. See also Table 3.
Figure 3.
Figure 3.
EAAT2 is located near ribbons in the axon terminals of RBs. A, Confocal images showing immunofluorescence triple labeling of EAAT2 (green), RIBEYE (magenta), and PKCα (blue) in a frozen mouse retinal section. EAAT2 was expressed strongly in the OPL, and moderately in the INL, IPL, and GCL. Note that, in the INL, EAAT2 was expressed in the somata of some cone bipolar cells but not RB cells labeled by PKCα (asterisks). ONL, outer nuclear layer; OPL, outer plexiform layer; INL, inner nuclear layer; IPL, inner plexiform layer; GCL, ganglion cell layer. Scale bar: 20 μm. B, Magnification of the images in the dashed line frames of A. EAAT2 was expressed in RB axon terminals at sites near ribbons (arrows). Scale bar: 2.5 μm.
Figure 4.
Figure 4.
EAAT2 regulates signal transmission at RB→AII ribbon synapses. A, A schematic diagram showing the optogenetic study of neurotransmission between RBs and AII amacrine cells. ChR2 was expressed predominantly in RBs by cre-dependent recombination in adult Pcp2-cre::Ai32 mouse retinas. With all the synaptic transmission between photoreceptors and BCs is blocked pharmacologically, brief flashes of 470-nm LED light can directly activate ChR2+ RBs and induce postsynaptic responses in AIIs, which mainly reflect neurotransmitter release from RBs. The electrical coupling between ChR2+ ON cone bipolar cells and AIIs is negligible under this experimental condition (Liang et al., 2021). R, rod. B, The EPSCs recorded in AIIs, which were evoked by 470-nm LED light stimulation, were enhanced by 200 μm DHK, a selective EAAT2 blocker. Vhold = −80 mV. C, The ChR2-evoked EPSCs were reduced by 10 μm GT949, a positive allosteric modulator of EAAT2. D, E, Summary data showing the effects of GT949 (n = 10) and DHK (n = 7) on the peak amplitude of AII EPSCs. F, DHK reduced the time to peak of EPSCs slightly, but not significantly (n = 7, p = 0.0531). G, DHK reduced the rise time of EPSCs (n = 7). H, DHK did not change the decay time (tau) of EPSCs (n = 7). I–L, DHK did not affect the frequency, amplitude, rise time, or tau of mEPSCs recorded in AIIs (n = 7). mEPSCs, miniature EPSCs. M, The voltage changes in ChR2+ RBs, which were evoked by brief flashes of 470-nm LED light, were increased by 200 μm DHK. N, DHK increased the voltage changes in RBs evoked by light flashes (n = 6). O, DHK did not influence the resting membrane potentials of RBs (n = 6). The data were represented as mean ± SEM. Wilcoxon signed-rank test or Student’s t test was used where appropriate. *p < 0.05, **p < 0.01; ns, not significantly different. See also Table 4.
Figure 5.
Figure 5.
Pharmacological blockade of all EAATs has a significant effect on signal transmission at RB→AII synapses. A, The EPSCs recorded in AII amacrine cells, which were evoked by activating ChR2+ RBs with 470-nm LED light stimulation, were enhanced by 50 μm TBOA, a nonselective blocker of all EAATs. Vhold = −80 mV. R, rod; RB, rod bipolar cell; ChR2, channelrhodopsin-2. B, TBOA increased the peak amplitude of ChR2-evoked EPSCs (n = 7). C, The relative effects of TBOA on the peak amplitude and current integral of AII EPSCs (n = 7). The peak amplitudes/integrals were normalized to the peak amplitude/integral under control condition in each cell before averaging across cells. D, Comparison of the relative effects of DHK (n = 7), a selective EAAT2 blocker, and TBOA (n = 7) on the peak amplitude of AII EPSCs. E–G, TBOA changed the time to peak, rise time and tau of EPSCs (n = 7). H–K, TBOA did not influence the frequency, amplitude, or rise time of mEPSCs recorded in AIIs while increasing the tau slightly (n = 7). mEPSCs, miniature EPSCs. L, The voltage changes in ChR2+ RBs, which were evoked by brief flashes of 470-nm LED light, were increased by 50 μm TBOA. Note that, in the presence of TBOA, a large, long-lasting AHP (arrow) could be recorded in each RB following the light-evoked depolarization. M, TBOA increased the initial voltage changes in RBs evoked by light flashes (n = 5). N, Comparison of the relative effects of DHK (n = 6) and TBOA (n = 5) on light-evoked voltage changes in RBs. The data were represented as mean ± SEM. Wilcoxon signed-rank test or Student’s t test was used where appropriate. *p < 0.05, **p < 0.01, ***p < 0.001; ns, not significantly different. See also Table 5.
Figure 6.
Figure 6.
EAAT1 in Müller cells does not influence neurotransmission at RB→AII synapses. A, The EPSCs recorded in AII amacrine cells, which were evoked by activating ChR2+ RBs with 470-nm LED light stimulation, were not affected by 50 μm UCPH101, a selective blocker of EAAT1 expressed exclusively in Müller cells. Vhold = −80 mV. R, rod; RB, rod bipolar cell; ChR2, channelrhodopsin-2. B, C, UCPH101 did not change the peak amplitude or time to peak of ChR2-evoked EPSCs (n = 8). D–G, UCPH101 did not influence the frequency, amplitude, rise time, or tau of mEPSCs recorded in AIIs (n = 8). mEPSCs, miniature EPSCs. The data were represented as mean ± SEM. Wilcoxon signed-rank test or Student’s t test was used where appropriate. ns, not significantly different. See also Table 6.
Figure 7.
Figure 7.
EAAT5 plays a predominant role in regulating neurotransmission at RB→AII synapses. A, The EPSCs recorded in AII amacrine cells, which were evoked by 470-nm LED light stimulation of ChR2-expressing RBs, were increased slightly by co-application of DHK (200 μm) and UCPH101 (50 μm; n = 8), selective blockers of EAAT2 and EAAT1, respectively, and then enhanced more strongly by application of TBOA (50 μm; n = 3), a nonselective blocker of all EAATs. Vhold = −80 mV. R, rod; RB, rod bipolar cell; ChR2, channelrhodopsin-2. B, Magnification of the traces shown in A.
Figure 8.
Figure 8.
Blockade of presynaptic EAAT5 but not EAAT2 reduces temporal resolution at RB→AII synapses. A, Representative traces showing the EPSPs recorded in AII amacrine cells, which were evoked by activating ChR2-expressing RBs with 470-nm LED light stimulation. The frequencies of light stimulation were in the range of 2–50 Hz. Under the control condition, the membrane potentials of AIIs could follow the 10 consecutive flashes very well even at stimulus frequency as high as 25 Hz (left panel). Co-application of 50 μm UCPH101, a selective EAAT1 blocker, and 200 μm DHK, a selective EAAT2 blocker, did not significantly influence AIIs’ responses to flashes (middle panel). But in the presence of 50 μm TBOA, a nonselective blocker of EAATs, AIIs failed to response to some individual flashes (marked by triangles; right panel), especially at stimulus frequencies higher than 10 Hz. B, Summary data showing the fractions of correct responses for AIIs under three different experimental conditions. The fraction of correct responses was plotted as a function of light stimulus frequency. Application of 50 μm TBOA significantly reduced the fraction of correct responses at various stimulus frequencies (n = 7). C, Summary data showing the fractions of correct responses for AIIs under control and DHK conditions. Application of 200 μm DHK did not significantly change the fraction of correct responses (n = 5). D, Summary data showing the average amplitudes of AII EPSPs under three different experimental conditions. The average EPSP amplitude was plotted as a function of light stimulus frequency. Application of 50 μm TBOA significantly reduced the average EPSP amplitude at various stimulus frequencies (n = 7). E, Summary data showing the average amplitudes of AII EPSPs under control and DHK conditions. Application of 200 μm DHK did not significantly change the average EPSP amplitude (n = 5). The data were represented as mean ± SEM. Wilcoxon signed-rank test or paired t test was used for comparison. *p < 0.05, **p < 0.01, ***p < 0.001; ns, not significantly different. See also Tables 7 and 8.

Similar articles

Cited by

References

    1. Arriza JL, Eliasof S, Kavanaugh MP, Amara SG (1997) Excitatory amino acid transporter 5, a retinal glutamate transporter coupled to a chloride conductance. Proc Natl Acad Sci U S A 94:4155–4160. 10.1073/pnas.94.8.4155 - DOI - PMC - PubMed
    1. Barnett NL, Pow DV (2000) Antisense knockdown of GLAST, a glial glutamate transporter, compromises retinal function. Invest Ophthalmol Vis Sci 41:585–591. - PubMed
    1. Bligard GW, DeBrecht J, Smith RG, Lukasiewicz PD (2020) Light-evoked glutamate transporter EAAT5 activation coordinates with conventional feedback inhibition to control rod bipolar cell output. J Neurophysiol 123:1828–1837. 10.1152/jn.00527.2019 - DOI - PMC - PubMed
    1. Blondel VD, Guillaume JL, Lambiotte R, Lefebvre E (2008) Fast unfolding of communities in large networks. J Stat Mech 2008:P10008. 10.1088/1742-5468/2008/10/P10008 - DOI
    1. Cho S, von Gersdorff H (2012) Ca(2+) influx and neurotransmitter release at ribbon synapses. Cell Calcium 52:208–216. 10.1016/j.ceca.2012.06.004 - DOI - PMC - PubMed

Publication types

MeSH terms

Substances