. 2022 Jul;6(7):e2101327.
doi: 10.1002/adbi.202101327. Epub 2022 May 6.

Sars-Cov-2 Spike Protein-Induced Damage of hiPSC-Derived Cardiomyocytes

Affiliations

Sars-Cov-2 Spike Protein-Induced Damage of hiPSC-Derived Cardiomyocytes

Xiaochen Huang et al. Adv Biol (Weinh). 2022 Jul.

Abstract

Sars-Cov-2 may trigger molecular and functional alterations of cardiomyocytes (CMs) of the heart due to the presence of receptor angiotensin-converting enzyme 2 (ACE2) of the host cells. While the endocytic itinerary of the virus via cleavage of the spike protein of Sars-Cov-2 is well understood, the role of the remaining part of the spike protein subunit and ACE2 complex is still elusive. Herein, the possible effects of this complex are investigated by using synthetic spike proteins of Sars-Cov-2, human-induced pluripotent stem cells (hiPSC), and a culture device made of an arrayed monolayer of cross-linked nanofibers. hiPSCs are first differentiated into CMs that form cardiac tissue-like constructs with regular beating and expression of both ACE2 and gap junction protein Connexin 43. When incubated with the spike proteins, the hiPSC-CMs undergo a rhythmic fluctuation with overstretched sarcomere structures and dispersed gap junction proteins. When incubated with the spike proteins and supplementary angiotensin II, the damage of the spike protein on hiPSC-CMs is enhanced due to downregulated ACE2, chromatin margination, altered Connexin 43 expression, sarcomere disruption, and beating break. This discovery may imply latent effects of the spike proteins on the heart.

Keywords: ACE2; Ang II; Sars-Cov-2; cardiomyocytes; hiPSC; spike protein.


Conflict of interest statement

The authors declare no conflict of interest.

Figures

Figure 1
Figure 1
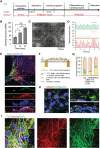
Overview of possible ends of shedding spike protein and evaluation process. A) After endocytosis of Sars‐Cov‐2, the spike‐ACE2 complex may: 1) Enter into the cytoplasm; 2) Totally or partially shed from the cell membrane; 3) Stay on the cell membrane. B) Workflow of cardiac patch fabrication and spike protein testing. hiPSCs are first differentiated to cardiomyocytes on a culture patch made of arrayed nanofiber membrane. They are then incubated with synthetic spike protein with or without supplementary Ang II. The beating behavior, cellular structure, and nuclear morphology of the cells are analyzed to evaluate the effect of the spike protein of Sars‐Cov‐2.
Figure 2
Figure 2
Fabrication and characterization of the cardiac patch. A) Timeline of hiPSC differentiation toward cardiomyocytes (CM). CHIR represents CHIR99021, a GSK3 inhibitor; IWP2 is a WNT inhibitor. B27: B27 minus insulin supplement, E8 flex: Essential 8 Flex Medium, RPMI: RPMI 1640 medium. B) Beating frequency of the hiPSC‐CMs as a function of incubation time. The BPM value at each timepoint is the average of beating frequency from five positions of three independent experiments. C) Spatial segmentation of time‐lapse images of mature hiPSC‐CMs on day 64. D) Beating waveforms of three types of segmented areas of (C). Over 30 segmented areas, 26 exhibited regular and high magnitude beating (green). E) Immunostaining images of a selected area showing tissue‐like organization with multilayer and multicellular types. The dash lines indicate the borders of the nanofiber membrane. Green: SMA (α‐smooth muscle actin), Red: TnT (troponin T), Blue: Nuclei. Scale bar: 20 µm. F) Schematic of the cell organization. G) Percentages of the cells expressing TnT and/or SMA. The stack image (XZ) of (E) was divided vertically on average into three parts (top, middle, bottom shown in (F)). 10 XZ cross‐section positions were analyzed. H) Immunofluorescent images of ACE2 (red) and Connexin 43 (Con43, green) marked hiPSC‐CMs. Blue: Nuclei. Scale bar: 5 µm. I) Maximum intensity projection of Z‐stack, fluorescence confocal image of TnT (green) and α‐actinin (red) marked hiPSC‐CMs. Blue: Nuclei. Scale bar: 5 µm. Zoomed areas display more clearly the sarcomere structures. Scale bar: 5 µm.
Figure 3
Figure 3
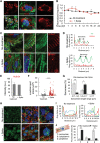
Effect of spike protein on hiPSC‐CMs. A) Immunofluorescent images of actin (green) and spike protein (red) marked hiPSC‐CMs. Blue: Nuclei. Scale bar: 15 µm. Two zoomed areas show the spike protein around the nuclei (up) and in the cytoplasm (bottom). White arrows indicate the striated structure of sarcomeric actin. Scale bar: 5 µm. B) Beating frequency variation as a function of incubation time during the first 24 h. The normalized frequency was the average one from five positions. C) Immunofluorescent images of TnT (green) and α‐actinin (red) marked hiPSC‐CMs. Magenta symbols indicate sarcomere structures with and without spike protein treatment, showing different lengths between neighboring TnT segments. Scale bar: 5 µm. D) Intensity profiles of TnT (green) and α‐actinin (red) fluorescence along cyan lines in (C). E) Mean intensity of α‐actinin fluorescence from cells of eight different positions per condition. F) The graph shows the distribution of the α‐actinin spot area from cells of ten different positions. G) Statistic of the sarcomere length of in untreated and spike protein treated hiPSC‐CMs. Two hundred fifty‐two sarcomeres of cells from 12 different positions per condition were analyzed. H) Immunofluorescent images of connexin 43 (green) and actin (red) marked cells. Blue: Nuclei. Scale bar: 5 µm. I) Intensity profiles of connexin 43 (green) and actin (red) fluorescence along cyan lines in (H). J) Percentage of connexin 43 fluorescent areas in different zones as defined on the left. 50 cells from five different positions per condition were analyzed.
Figure 4
Figure 4
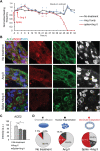
Beating arrest and nuclear distortion of hiPSC‐CMs. A) Comparison of the rhythmic activity of hiPSC‐CMs incubated for 54 h, with or without spike protein and Ang II. Spike protein (1 µg mL‐1) was added at −3 h, 100 ng mL‐1 Ang II was added after another 3 h. Data were obtained from five positions under each condition. The blue and red significant symbols indicate the difference of the group “Ang II only/No treatment” and the group “Spike+Ang II/No treatment,” respectively. B) Immunofluorescent images of hiPSC‐CMs, showing expression of ACE2 (Green), Actin (Red) and Nucleus (Gray or Blue) under different conditions. Yellow full arrows point to cells with nuclear fragmentation while yellow hollow arrows point to cells with chromatin margining. Scale bar: 5 µm. C) The bar graph shows the mean intensity of ACE2 fluorescence from cells of 8 different positions. D) Schematic figures to show different nuclear morphology and data statistical analyses, showing quantitatively the changes in chromatin distribution. The nuclei of 120–150 cells from ten positions per condition were analyzed.
Figure 5
Figure 5
Degradation of the cellular structures of hiPSC‐CMs. A) Immunofluorescent images of hiPSC‐CMs, showing the expression of TnT (Green), Actinin (Red) under different conditions. Scale bar: 5 µm. B,C) Bar graphs at left show the mean intensity of TnT (B) and Actinin (C) fluorescence, bar graph at right shows the distribution of TnT (B) and Actinin (C) fluorescence spot areas with no treatment, spike protein or spike protein, and supplementary Ang II. D) Immunostaining images of connexin 43 (Green) and Actin (Red). Scale bar: 5 µm. E) Mean intensity of the connexin 43 fluorescence. All the data of α‐actinin, troponin T, or connexin 43 were from five different positions per condition.
Figure 6
Figure 6
Schematic summaries of the effects of spike protein on hiPSC‐CMs. A) Sarcomere structures with and without spike protein treatment. Without spike protein, myosin slides along actin to contract the hiPSC‐CMs. With spike protein, the distribution of α‐actinin proteins might be disturbed and the overlap between myosin and actin became shortened. B) Damage effects of the spike protein on cells. Without spike protein, the cell‐cell contact with the help of gap junction proteins (connexin 43) enables coordinated contraction of the cardiac tissue. With spike protein, the gap junction disappeared due to mislocalization of connexin 43. When incubated with supplementary Ang II, the spike protein‐induced changes became fatal in terms of ACE2 downregulation, chromatin margination, connexin 43 expression, and sarcomere disruption, leading to cell death.

Similar articles

Cited by

References

    1. Wiersinga W. J., Rhodes A., Cheng A. C., Peacock S. J., Prescott H. C., Pathophysiology, T. , JAMA 2020, 324, 782. - PubMed
    1. Maghool F., Valiani A., Safari T., Emami M. H., Mohammadzadeh S., Scand. J. Immunol. 2021, 93, e12999. - PMC - PubMed
    1. Raghavan S., Gayathri R., Kancharla S., Kolli P., Ranjitha J., Shankar V., Front. Cardiovasc. Med. 2021, 8, 670659. - PMC - PubMed
    1. Sato K., Sinclair J. E., Sadeghirad H., Fraser J. F., Short K. R., Kulasinghe A., Clin. Transl. Immunol. 2021, 10, e1343. - PMC - PubMed
    1. Bearse M., Hung Y. P., Krauson A. J., Bonanno L., Boyraz B., Harris C. K., Helland T. L., Hilburn C. F., Hutchison B., Jobbagy S., Marshall M. S., Shepherd D. J., Villalba J. A., Delfino I., Mendez‐Pena J., Chebib I., Newton‐Cheh C., Stone J. R., Mod. Pathol. 2021, 34, 1345. - PMC - PubMed

Publication types

MeSH terms