. 2022 May 6;8(1):253.
doi: 10.1038/s41420-022-01044-y.

The AMPK-related kinase NUAK2 suppresses glutathione peroxidase 4 expression and promotes ferroptotic cell death in breast cancer cells

Affiliations

The AMPK-related kinase NUAK2 suppresses glutathione peroxidase 4 expression and promotes ferroptotic cell death in breast cancer cells

Tanu Singh et al. Cell Death Discov. .

Abstract

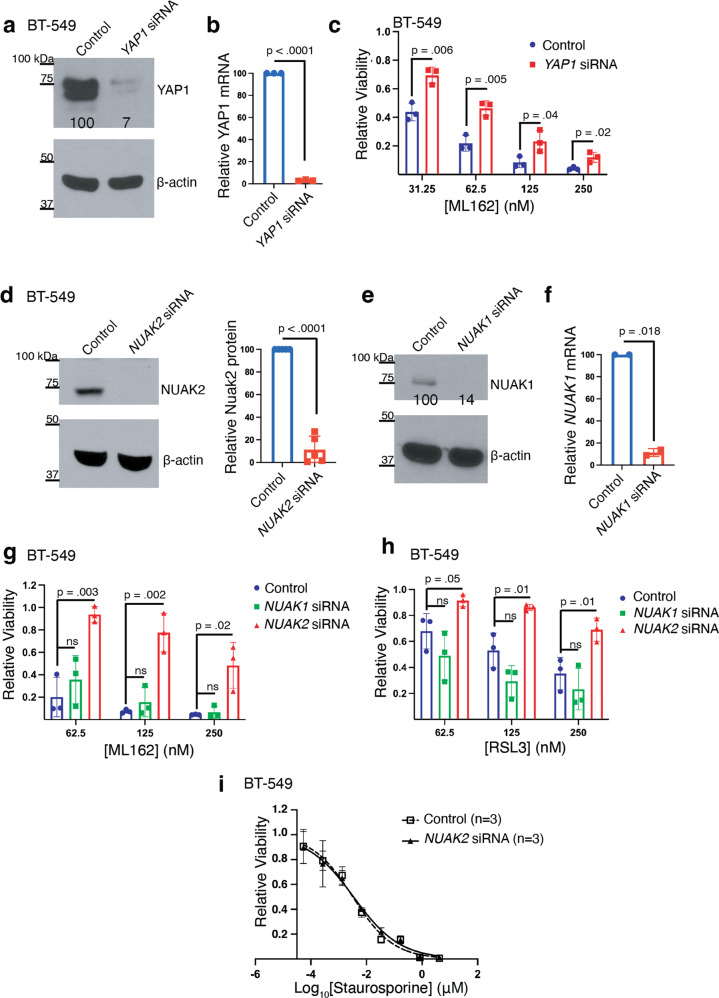
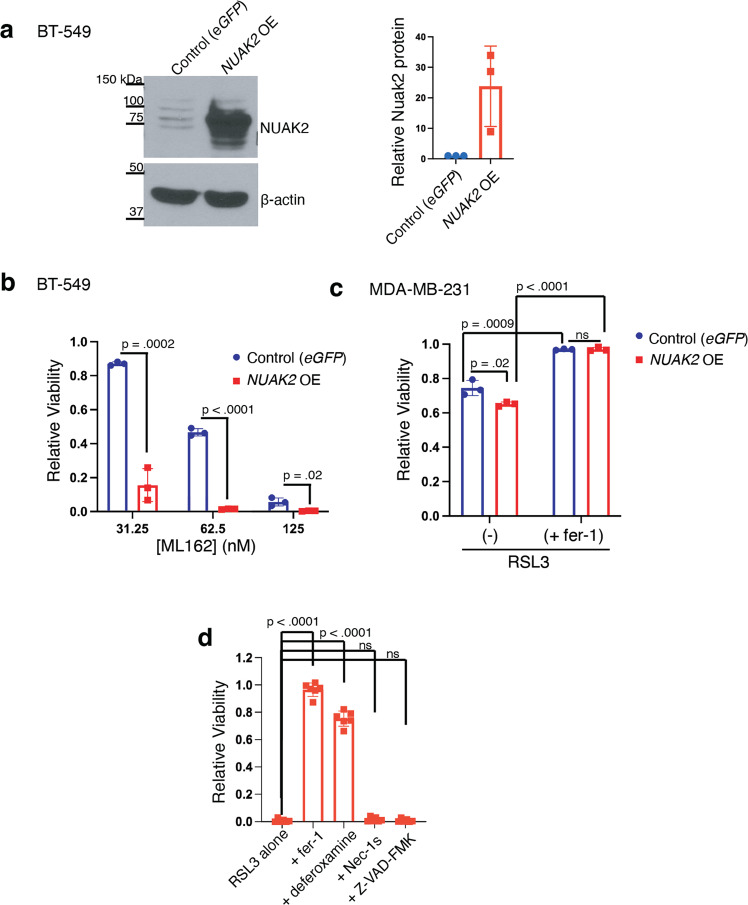
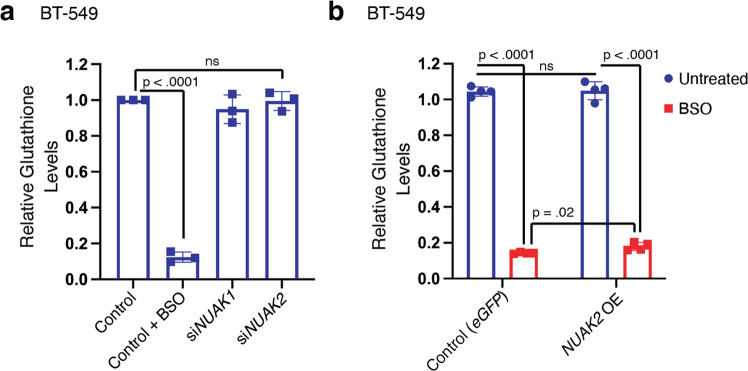
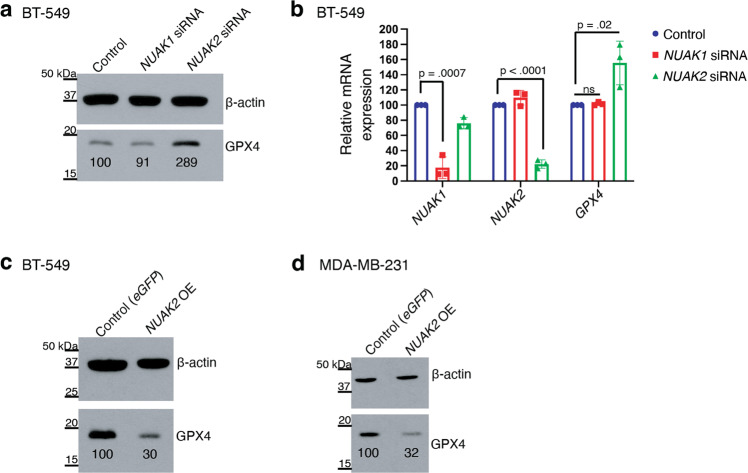
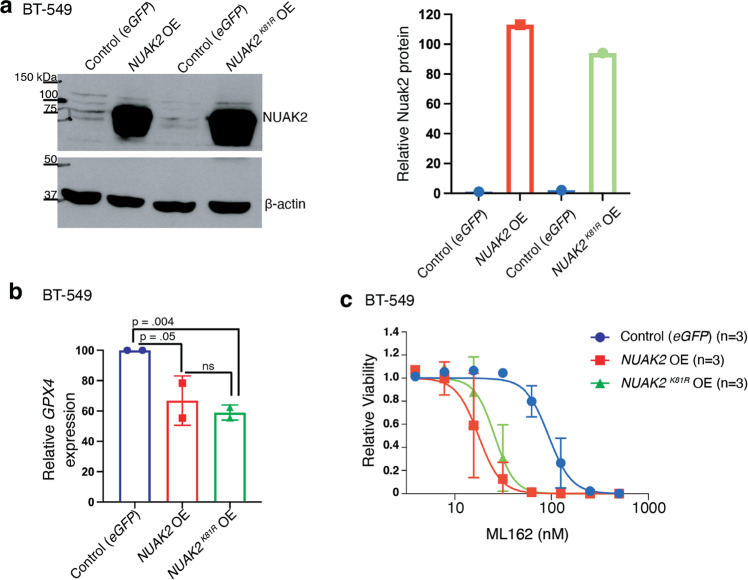
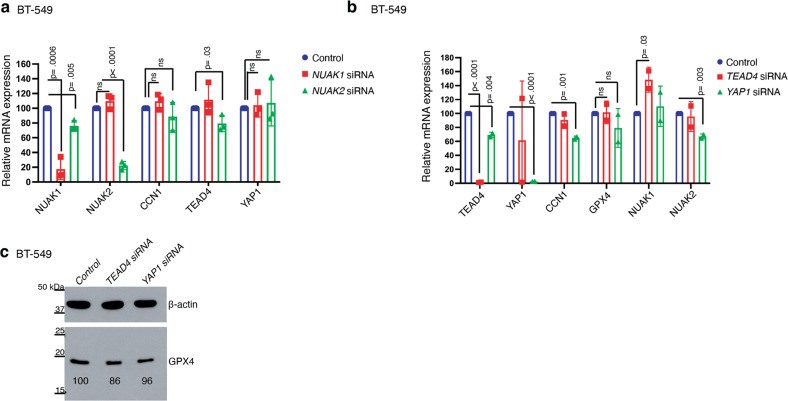
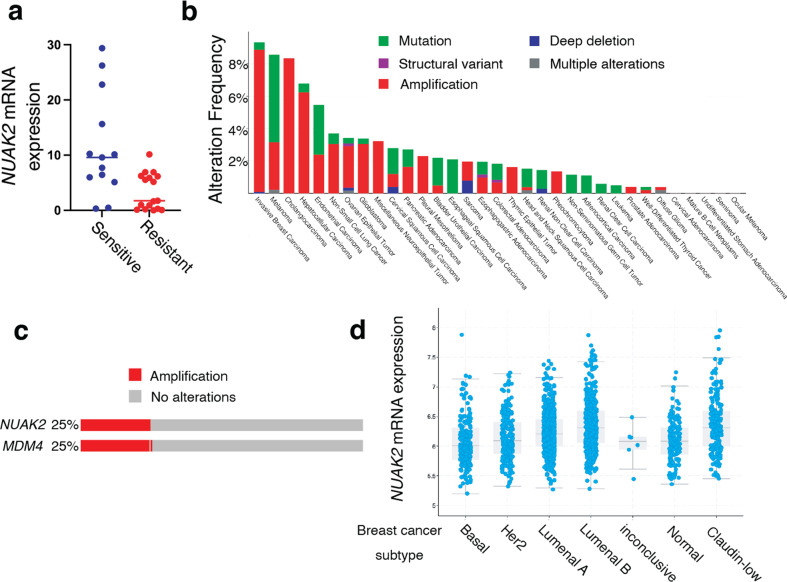
Ferroptosis is a caspase-independent form of regulated cell death strongly linked to the accumulation of reactive lipid hydroperoxides. Lipid hydroperoxides are neutralized in cells by glutathione peroxidase 4 (GPX4) and inhibitors of GPX4 are potent ferroptosis inducers with therapeutic potential in cancer. Here we report that siRNA-mediated silencing of the AMPK-related kinase NUAK2 suppresses cell death by small-molecule inducers of ferroptosis but not apoptosis. Mechanistically we find that NUAK2 suppresses the expression of GPX4 at the RNA level and enhances ferroptosis triggered by GPX4 inhibitors in a manner independent of its kinase activity. NUAK2 is amplified along with MDM4 in a subset of breast cancers, particularly the claudin-low subset, suggesting that this may predict vulnerability to GPX4 inhibitors. These findings identify a novel pathway regulating GPX4 expression as well as ferroptotic sensitivity with potential as a biomarker of breast cancer patients that might respond to GPX4 inhibition as a therapeutic strategy.


Conflict of interest statement

The authors declare no competing interests.

Figures

Fig. 1
Fig. 1. Silencing NUAK2, but not NUAK1, partially protects TNBC cells from cell death by ferroptosis inducers.
a Western blot showing YAP1 protein levels in BT-549 cells 72 hours after transfection with a pool of YAP1-targeting siRNA or non-targeting siRNA. β-actin is the loading control for this and the subsequent western blots unless otherwise specified. (n = 1 independent experiment). Normalized YAP1 protein levels are show beneath the band. b Quantitative RT-PCR of YAP1 mRNA from YAP1-siRNA or nontargeting siRNA in BT-549 cells similar to (a). n = 3 independent experiments and a one sample t test was used to test the difference from control YAP1 mRNA levels (p-value shown above the comparator bar). Error bars, here and in the subsequent panels denote standard deviation centered on the mean. c Relative viability of BT-549 cells 72 h after transfection with the pool of YAP1-targeting or non-targeting siRNA followed by 48-h treatment with the indicated dose of ML162. p-values above comparator bars in this and subsequent panels are from two-sided Student’s t-tests unless noted. (n = 3 independent experiments). d Western blot showing NUAK2 protein level in BT-549 cells 72 h after transfection with a pool of NUAK2-targeted siRNA or nontargeting siRNA (n = 3 independent experiments). The right panel shows the quantitation of relative NUAK2 protein levels from the 3 experiments and the p-value from a one sample t test. e Western blot showing NUAK1 protein level in BT-549 cells after NUAK1 silencing as in (d). n = 1 f Quantitative RT-PCR of NUAK1 mRNA from NUAK1-siRNA or nontargeting siRNA in BT-549 cells similar to (e). n = 2 independent experiments and a one sample t test was used to test the difference from control NUAK1 mRNA levels. g Relative viability of BT-549 cells 72 h after transfection with either NUAK1-targeting, NUAK2-targeting, or nontargeting siRNA followed by 48-h treatment with indicated dose of (g) ML162 or (h) RSL3 (n = 3 independent experiments). i Cell viability dose-response curves in BT-549 cells 72 h after transfection with a pool of NUAK2-targeted siRNA or nontargeting siRNA followed by 48 h incubation with the indicated dose of staurosporine, calculated EC50 values were 3.2 nM (95% CI, 2–4 nM) for nontargeting siRNA, 3.4 nM (95% CI, 2–5 nM for NUAK2-targeted siRNA (n = 3 independent experiments).
Fig. 2
Fig. 2. Overexpression of NUAK2 enhances ferroptosis on GPX4 inhibition.
a Western blot of BT-549 cells transfected with vectors encoding wild-type NUAK2 or control cell line expressing eGFP (representative of n = 3 independent experiments). Right panel shows quantification of relative NUAK2 protein levels from the 3 experiments. Error bars, here and below, denote standard deviation centered on the mean. b Relative viability of these cells after 72 h incubation with the indicated dose of ML162 (n = 3). p-values from two-tailed Student’s t-tests are shown here and below. c Bar chart showing the relative viability of MDA-MB-231 cells expressing either eGFP or NUAK2 following incubation for 72 h with 62.5 nM RSL3 and co-treatment with either DMSO vehicle (-) or 2 µM ferrostatin-1 (+fer-1) (n = 3 independent experiments). d Relative viability of NUAK2 overexpressing MDA-MB-231 cells following incubation for 72 h with 125 nM RSL3 and co-treatment with either DMSO vehicle, 2 µM ferrostatin-1, 50 µM deferoxamine, 50 µM Necrostatin-1s or 20 µM Z-VAD-FMK.
Fig. 3
Fig. 3. NUAK2 does not enhance ferroptosis by depleting glutathione.
a Relative glutathione levels (oxidized plus reduced forms) from BT-549 cells 72 h after transfection with either NUAK1-targeting, NUAK2-targeting, or nontargeting siRNA (control) and 24 h treatment with either vehicle or 20 µM buthionine sulfoximine (BSO) (n = 3 independent experiments). b Relative glutathione levels from BT-549 cells exogenously expressing NUAK2 or eGFP (controls) 24 h after treatment with either vehicle (untreated) or 20 µM BSO. (n = 4 technical replicates). Glutathione levels were normalized to total viable cells (CellTiter-Glo). Error bars denote standard deviation centered on the mean. The numbers above the brackets are p values from Student’s t-tests (two-sided), ns denotes not significant.
Fig. 4
Fig. 4. NUAK2 suppresses GPX4 expression at the RNA level.
a Western blot showing GPX4 protein levels in BT-549 cells 72 h after transfection with a pool of NUAK1 or NUAK2-targeting siRNA or non-targeting siRNA. β-actin is the loading control. (representative of n = 3 independent experiments). Relative GPX4 protein levels are show beneath the band. b Relative mRNA expression of NUAK1, NUAK2 and GPX4 by qPCR in BT-549 cells 72 h after transfection with the indicated pool of NUAK1, NUAK2 siRNA or non-targeting siRNA (control) (n = 3 independent experiments). Error bars denote standard deviation centered on the mean. The numbers above the brackets are p values from Student’s t-tests (two-sided), ns denotes not significant. c Western blot showing GPX4 protein levels in (c) BT-549 and (d) MDA-MB-231 cells, stably over-expressing NUAK2 compared to the control line expressing eGFP (representative of n = 2 independent experiments for BT-549 and n = 3 for MDA-MB-231). Relative GPX4 protein levels are show beneath the band.
Fig. 5
Fig. 5. NUAK2 regulation of GPX4 is independent of its kinase activity.
a Western blot of BT-549 cells transfected with cDNA encoding wild-type NUAK2 (NUAK2 OE) or kinase-dead NUAK2 (NUAK2 OEK81R) compared to control cells expressing eGFP. β-actin is the loading control (representative of n = 2 independent experiments). Quantification of normalized NUAK2 protein levels are shown in the right panel. b Relative mRNA expression of GPX4 by RT-PCR in BT-549 cells overexpressing either wild-type NUAK2 or NUAK2 K81R compared to eGFP-expressing controls (n = 2 independent experiments). Numbers above the brackets are p values from Student’s t-tests (one-sided). c Cell viability for these cells treated with the indicated dose of ML162 for 72 h. Calculated EC50 values were 94 nM (95% CI, 83−105 nM) for controls (eGFP), 18 nM (95% CI, 15–22 nM for NUAK2 OE and 26 nM (95% CI, 22-30 nM for NUAK2K81R OE (n = 3 independent experiments).
Fig. 6
Fig. 6. NUAK2 does not affect GPX4 expression via YAP/TAZ.
a Relative mRNA expression of the indicated genes quantified by qPCR in BT-549 cells 72 h after transfection with the indicated siRNA pool (n = 3 independent experiments). Error bars denote standard deviation centered on the mean. p values from Student’s t-tests (two-sided) are shown over brackets, ns denotes not significant. b qPCR quantitation of the indicated genes in BT-549 cells 72 hours after transfection with the indicated siRNA pool (n = 2 independent experiments). Error bars denote standard deviation centered on the mean. The numbers above the brackets are p values from Student’s t-tests (one-sided). c Western blot showing GPX4 protein levels in BT-549 cells 72 h after silencing of TEAD4 or YAP1. β-actin is the loading control, (n = 1). Relative GPX4 protein levels are show beneath the band.
Fig. 7
Fig. 7. NUAK2 is frequently amplified in breast cancers, is highly expressed in the claudin-low subtype and is associated with sensitivity to GPX4 inhibition.
a 100 human cancer cell lines were treated with ML162 or RSL3 at multiple doses for 48 h and cell viability was measured. Cell lines sensitive to GPX4 inhibitors (13 cell lines; blue) were defined based on an area under the dose-response curve (AUC) of >0.15. Resistant cell lines (17 cell lines; red) were defined on the basis of an AUC of 0. NUAK2 expression was extracted from the Cancer Cell Line Encyclopedia database and is plotted for each GPX4 inhibitor-sensitive or resistant cell line. The p value for the between-group comparison (Student’s t-test) is p < 0.00001. b Alterations in the NUAK2 gene across 10,953 cancer patients from TCGA Pan Cancer Data c Oncoprint of 2,173 breast cancer patients from the METABRIC data set [27] showing amplification of NUAK2 and/or MDM4. In (d) mRNA expression (microarray) of NUAK2 in these patients is broken down according to PAM50 breast cancer subtype.

Similar articles

Cited by

References

    1. Forcina GC, Dixon SJ. GPX4 at the Crossroads of Lipid Homeostasis and Ferroptosis. Proteomics. 2019;19:e1800311. doi: 10.1002/pmic.201800311. - DOI - PubMed
    1. Friedmann Angeli JP, Miyamoto S, Schulze A. Ferroptosis: The Greasy Side of Cell Death. Chem Res Toxicol. 2019;32:362–9. doi: 10.1021/acs.chemrestox.8b00349. - DOI - PubMed
    1. Stockwell BR, Friedmann Angeli JP, Bayir H, Bush AI, Conrad M, Dixon SJ, et al. Ferroptosis: A Regulated Cell Death Nexus Linking Metabolism, Redox Biology, and Disease. Cell. 2017;171:273–85. doi: 10.1016/j.cell.2017.09.021. - DOI - PMC - PubMed
    1. Yang WS, Stockwell BR. Ferroptosis: Death by Lipid Peroxidation. Trends Cell Biol. 2016;26:165–76. doi: 10.1016/j.tcb.2015.10.014. - DOI - PMC - PubMed
    1. Conrad M, Friedmann Angeli JP. Glutathione peroxidase 4 (Gpx4) and ferroptosis: what’s so special about it? Mol Cell Oncol. 2015;2:e995047. doi: 10.4161/23723556.2014.995047. - DOI - PMC - PubMed