. 2022 May 6;13(1):2497.
doi: 10.1038/s41467-022-30103-2.

Transmembrane stem cell factor protein therapeutics enhance revascularization in ischemia without mast cell activation

Affiliations

Transmembrane stem cell factor protein therapeutics enhance revascularization in ischemia without mast cell activation

Eri Takematsu et al. Nat Commun. .

Abstract

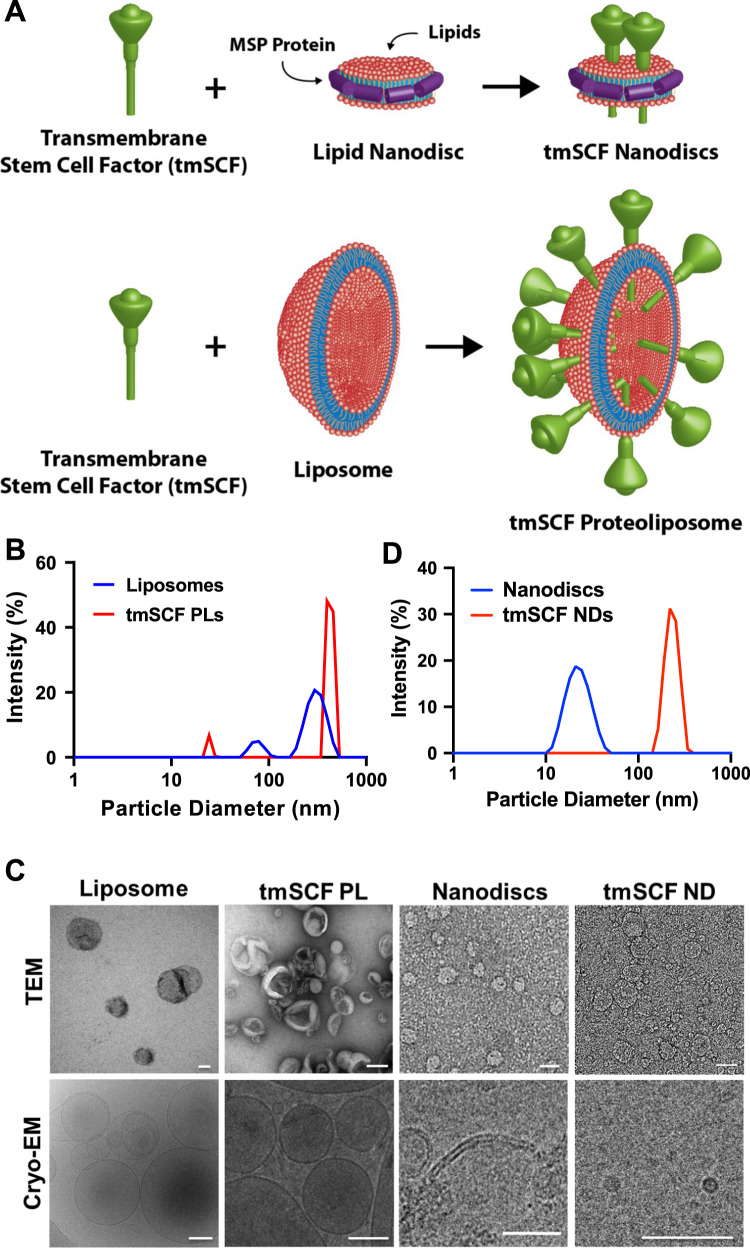
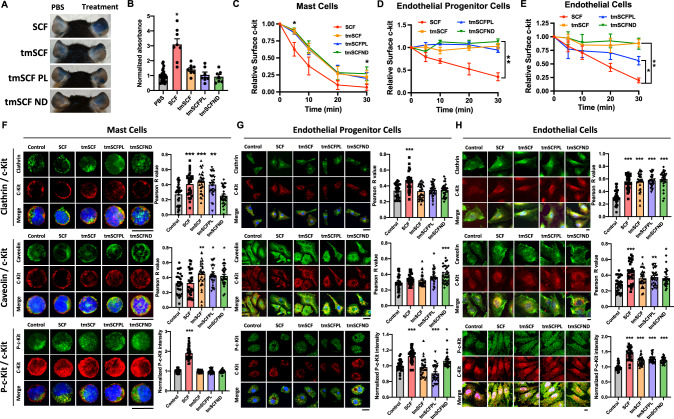
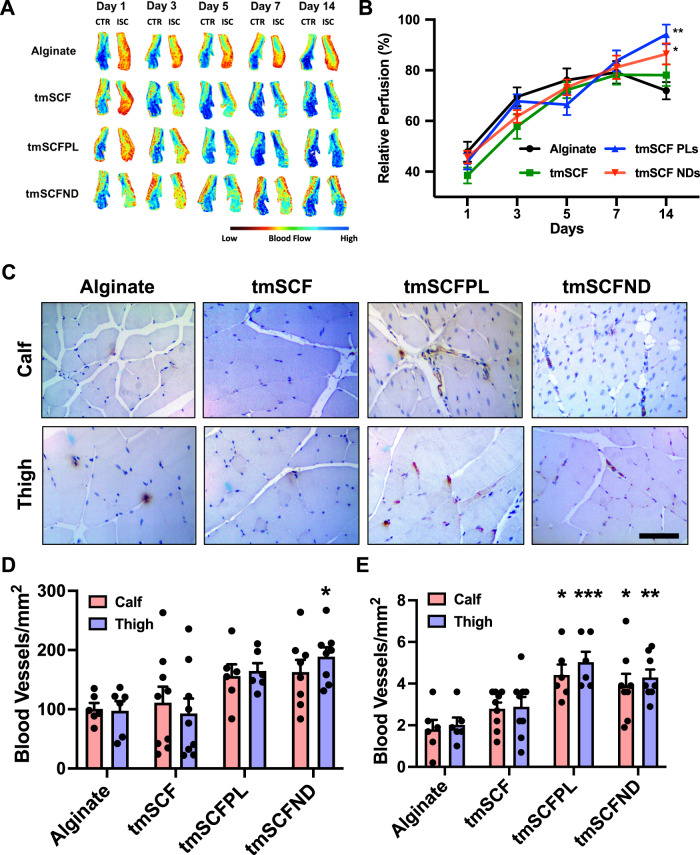
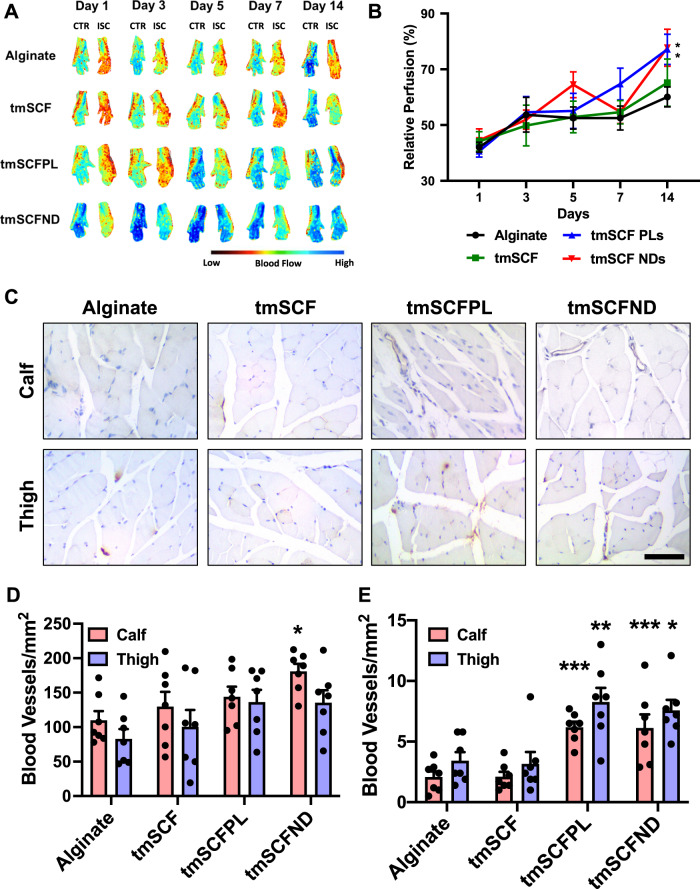
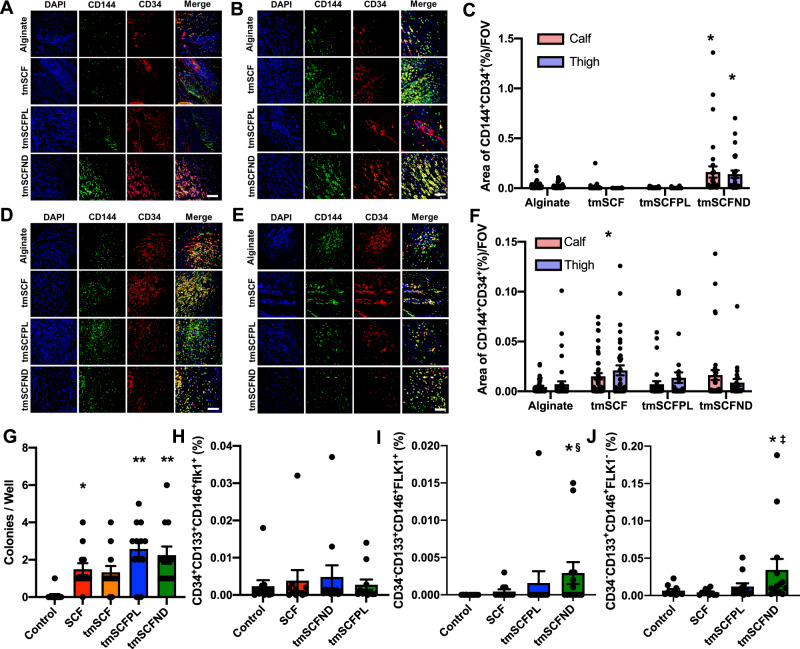
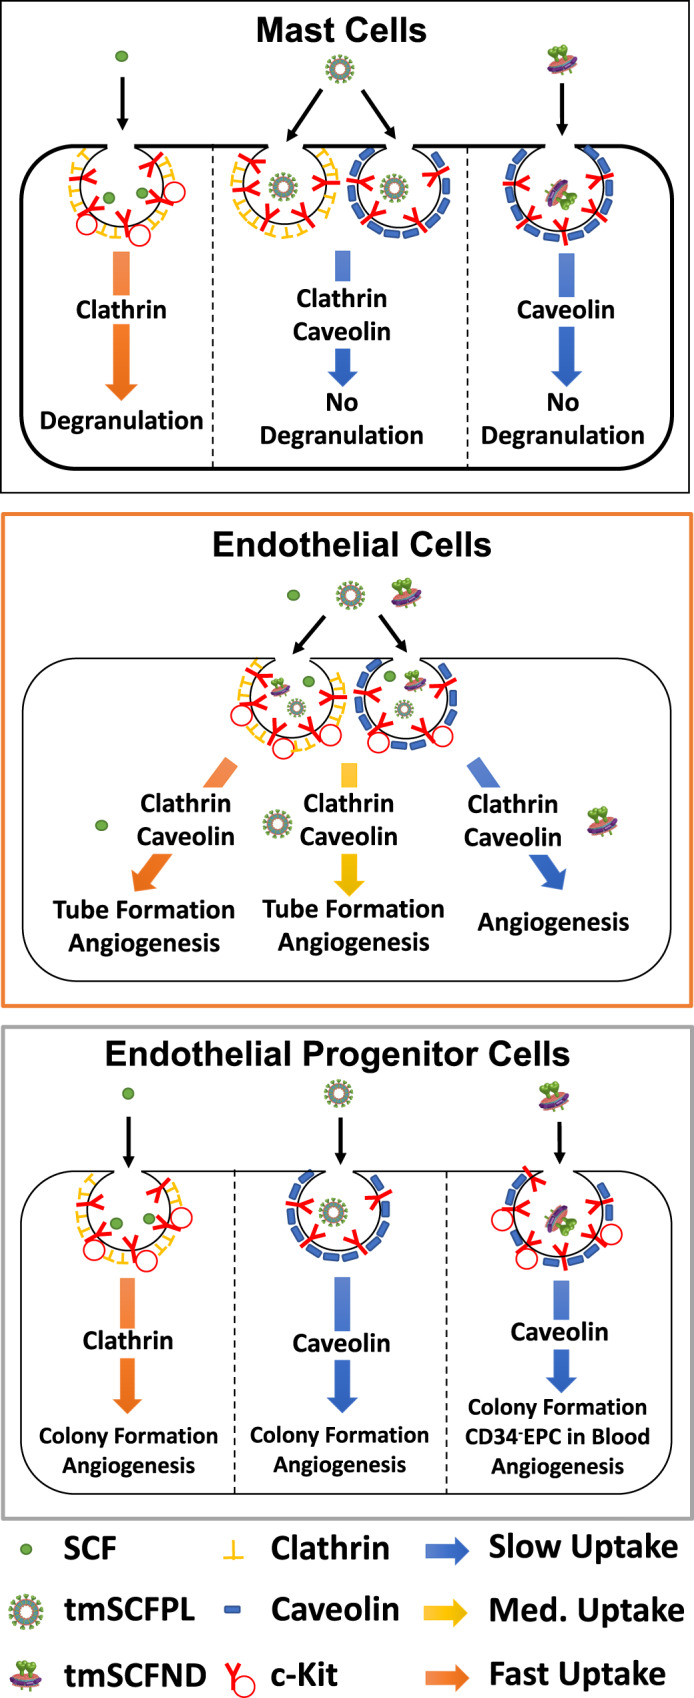
Stem cell factor (SCF) is a cytokine that regulates hematopoiesis and other biological processes. While clinical treatments using SCF would be highly beneficial, these have been limited by toxicity related to mast cell activation. Transmembrane SCF (tmSCF) has differential activity from soluble SCF and has not been explored as a therapeutic agent. We created novel therapeutics using tmSCF embedded in proteoliposomes or lipid nanodiscs. Mouse models of anaphylaxis and ischemia revealed the tmSCF-based therapies did not activate mast cells and improved the revascularization in the ischemic hind limb. Proteoliposomal tmSCF preferentially acted on endothelial cells to induce angiogenesis while tmSCF nanodiscs had greater activity in inducing stem cell mobilization and recruitment to the site of injury. The type of lipid nanocarrier used altered the relative cellular uptake pathways and signaling in a cell type dependent manner. Overall, we found that tmSCF-based therapies can provide therapeutic benefits without off target effects.


Conflict of interest statement

E.T. and A.B.B. have applied for a patent on the technology described in the paper (US20210145931A1).

Figures

Fig. 1
Fig. 1. Characterization of tmSCFPLs and tmSCFNDs by DLS and electron microscopy.
A Schematic illustration of tmSCF proteoliposomes (tmSCFPLs) and tmSCF nanodiscs (tmSCFNDs). B Size distribution for liposomes and proteoliposome with tmSCF measured by dynamic light scattering. C Size distribution for nanodiscs and tmSCF nanodiscs. D Representative TEM and cryo-EM images of liposomes, tmSCFPLs, nanodiscs, and tmSCFNDs. Scale bar = 100 nm.
Fig. 2
Fig. 2. Nanocarriers alter the uptake mechanism of tmSCF-based therapeutics.
A Representative pictures of mice ears after Evan’s blue extravasation assay. PBS was injected to the left ear as a control and treatments were injected to the right ear (n = 7 biologically independent mice examined over two independent experiments). B Quantification result of the absorbance at 620 nm. *p < 0.001 vs control. Two-sided one-way ANOVA with Turkey correction was used. (n = 7 for tmSCFPL and tmSCFND, 8 for SCF and tmSCF, 26 for PBS). C Surface staining for c-Kit on MC9 mast cells was monitored by flow cytometry. The intensity was normalized to 0 min time point to evaluate the treatment uptake kinetics (n = 6). *p = 0.0275 at 5 min, p = 0.048 at 30 min on tmSCFND vs SCF. Kruskal–Wallis test with Dunn’s post hoc was used. D Surface c-Kit on bone marrow mononuclear cells monitored by flow cytometry (n = 4 for alginate, 5 = SCF, tmSCFND, and 6 = tmSCFPL). **p = 0.0028 on tmSCFND vs SCF. Kruskal–Wallis test with Dunn’s post hoc was used. E Surface c-Kit on HUVECs were monitored by flow cytometry (n = 8 for time point 30 min, n = 4 for other time points). *p = 0.0138 on tmSCFPL vs SCF and **p < 0.001 on tmSCFND and tmSCF versus SCF. Two-sided one-way ANOVA with Dunnett’s post hoc test was used. F (Top) Representative pictures of single mast cell stained with clathrin and c-Kit. Pearson’s R value of the colocalization of clathrin and c-Kit (n = 30). p = 0.0009 on SCF vs control, p < 0.0001 on tmSCF vs control, and p = 0.0017 tmSCPL vs control. (Middle) Representative pictures of single mast cell stained with caveolin and c-Kit. Pearson’s R value of the colocalization of caveolin and c-Kit (n = 30). p = 0.0053 on tmSCF vs control, p = 0.0254 on tmSCPL vs control, and p = 0.0382 on tmSCFND vs control. (Bottom) Representative pictures of single mast cell stained with c-Kit and p-C-kit. The p-c-Kit mean intensity inside of mast cells was quantified (n = 30). P < 0.0001 on SCF vs control. Two-sided one-way ANOVA with Dunnett’s post hoc test was used. G (Top) Representative pictures of EPCs stained with clathrin and c-Kit. Pearson’s R value of the colocalization of clathrin and c-Kit (n = 30). p < 0.0001 on SCF vs control. (Middle) Representative pictures of EPCs stained with caveolin and c-Kit. Pearson’s R value of the colocalization of caveolin and c-Kit (n = 30). p = 0.0117 on tmSCFPL vs control and p < 0.0001 on tmSCND vs control. (Bottom) Representative pictures of EPCs stained with c-Kit and p-c-Kit. The p-c-Kit mean intensity inside of EPCs was quantified (n = 30). p < 0.0001 on SCF vs control, p = 0.0004 on tmSCPL vs control, and p = 0.0304 on tmSCFND vs control. Two-sided one way ANOVA with Dunnett’s post hoc test was used. H (Top) Representative pictures of HUVECs stained with clathrin and c-Kit. Pearson’s R value of the colocalization of clathrin and c-Kit (n = 30). p < 0.0001 on all treatment group vs control. (Middle) Representative pictures of HUVECs stained with caveolin and c-Kit. Pearson’s R value of the colocalization of caveolin and c-Kit (n = 30). p < 0.0001 on SCF vs control, p = 0.0361 on tmSCF vs control, p = 0.0062 on tmSCFPL vs control, and p = 0.0278 on tmSCFND vs control. (Bottom) Representative pictures of HUVECs stained with c-Kit and p-c-Kit. The p-c-Kit mean intensity inside of HUVECs was quantified (n = 30). p < 0.0001 on all treatment group vs control. Two-sided one-way ANOVA with Dunnett’s post hoc test was used. Scale bar is 30 µm. * indicates p value < 0.05, ** < 0.01, and *** <0.001. All the error bars are SEM.
Fig. 3
Fig. 3. Evaluation of treatments in a hindlimb ischemia model on wild type mice.
A Representative mice foot images taken by laser speckle imaging. B Relative blood flow recovery after hind limb ischemia surgery on WT mice (n = 13 for tmSCFND, 12 for other groups). p = 0.006 (tmSCFPL vs control) and p = 0.037 (tmSCFND vs control) * indicates p value < 0.05 **p < 0.01. C Immunostaining for PECAM on mice on the muscles from the ischemic calf and thigh muscle of the mice after 14 days. Scale bar = 100 µm. D Quantification small blood vessels in the calf and thigh muscle counted from PECAM immunostaining images (n = 7 for tmSCF, 4 for other groups). *p = 0.0116 on tmSCFND vs alginate. E The number of large blood vessels in the tissues (n = 7 for tmSCF, 4 for other groups). p = 0.043 on tmSCFPL vs control and p = 0.0295 on tmSCND vs control on calf muscle. p = 0.0005 on tmSCFPL vs control and p = 0.0038 on tmSCFND vs control on thigh muscle. Two-sided one-way ANOVA with Dunnett’s post hoc test was used. * indicates p value < 0.05, ** < 0.01, and *** <0.001. All the error bars are SEM.
Fig. 4
Fig. 4. Evaluation of treatments in a hindlimb ischemia model on ob/ob mice.
A Representative mice foot images taken by laser speckle imaging. B Relative blood flow recovery after hind limb ischemia surgery on ob/ob mice (n = 11 for tmSCF, 12 for other groups). p = 0.0424 on tmSCFPL vs control, and p = 0.0495 on tmSCFND vs control. Kruskal–Wallis test with Dunn’s post hoc was used. C Immunostaining for PECAM on mice on the muscles from the ischemic calf and thigh muscle of the mice after 14 days. Scale bar = 100 µm. D Quantification small blood vessels in the calf and thigh muscle counted from PECAM immunostaining images (n = 7). p = 0.0116 on tmSCFND vs alginate. E The number of large blood vessels in the tissues (n = 7). p = 0.008 on tmSCFPL vs control and p = 0.009 on tmSCND vs control on calf muscle. p = 0.0035 on tmSCFPL vs control and p = 0.0122 on tmSCFND vs control on thigh muscle. Two-sided one-way ANOVA with Dunnett’s post hoc test was used. * indicates p value < 0.05, ** < 0.01, and *** <0.001. All the error bars are SEM.
Fig. 5
Fig. 5. EPCs are recruited to peripheral blood and ischemic site.
A, B Representative immunostaining images of CD34 (red) and CD144 (green) on WT mice calf and thigh muscle, respectively. Scale bar is 300 µm. C CD34 and CD144 double positive areas were quantified in WT mice (n = 3 for alginate and tmSCF, 4 for tmSCFPL and tmSCFND). **p < 0.01 versus control (D, E). Representative immunostaining images of CD34 (red) and CD144 (green) on ob/ob mice calf and thigh muscle, respectively. Scale bar is 300 µm. F CD34 and CD144 double positive areas were quantified in ob/ob mice (n = 3 for tmSCFPL, 4 for alginate and tmSCFND, and 5 for tmSCF). **p < 0.01 versus control. G Average large EPC colony number per well (n = 12). H Frequency of CD34+CD133+CD146+FLK1+ cells in peripheral blood after subcutaneous injection (n = 11 for alginate, SCF and tmSCFPL, and 12 for tmSCFND). I Frequency of CD34CD133+CD146+FLK1+ cells in peripheral blood after subcutaneous injection (n = 11 for alginate, SCF and tmSCFPL, and 12 for tmSCFND). p = 0.0454 (tmSCFND vs control) and p = 0.00302 (tmSCFND vs SCF). J Frequency of CD34CD133+CD146+FLK1 cells in peripheral blood after subcutaneous injection (n = 10 for alginate, 11 for SCF, 12 for tmSCFPL and 14 for tmSCFND). p = 0.0314 (tmSCFND vs control) and p = 0.0031 (tmSCFND vs SCF). *, , and § indicate significant difference over alginate control, tmSCF, tmSCFPL, and SCF, respectively (p < 0.05; Kruskal–Wallis; one-way analysis of variance). All the error bars are SEM.
Fig. 6
Fig. 6. Summary of the experimental findings in the studies.
Mast cells use primarily a clathrin-mediated pathway to internalize SCF, leading to mast cell activation and anaphylaxis. In contrast, mast cells use predominantly clathrin and caveolin-mediated pathway to uptake tmSCF-based treatments and these treatments do not cause mast cell activation. Endothelial cells use both of clathrin- and caveolin-mediated pathway to uptake SCF, inducing angiogenesis in endothelial cells. Endothelial cells use both of clathrin- and caveolin-mediated pathway to internalize tmSCFPLs with medium uptake speed, triggering tube formation of endothelial cells and therapeutic angiogenesis. However, tmSCFNDs are internalized through clathrin/caveolin-mediated pathways with slow kinetics and do not induce an angiogenic response from mature endothelial cells. Endothelial progenitor cells (EPCs) use clathrin-mediated pathway to uptake SCF, triggering colony formation of EPCs and bone marrow cell mobilization. For tmSCF-based treatments, EPCs use a caveolin-mediated pathway for internalization leading to colony formation and angiogenesis. Treatment with tmSCFNDs further induced the mobilization of CD34CD133+ EPCs to the peripheral blood.

References

    1. Carter PJ. Introduction to current and future protein therapeutics: A protein engineering perspective. Exp. Cell Res. 2011;317:1261–1269. doi: 10.1016/j.yexcr.2011.02.013. - DOI - PubMed
    1. Walsh G. Biopharmaceutical benchmarks 2010. Nat. Biotechnol. 2010;28:917–924. doi: 10.1038/nbt0910-917. - DOI - PubMed
    1. Goeddel DV, et al. Expression in Escherichia-Coli of chemically synthesized genes for human insulin. Proc. Natl Acad. Sci. USA. 1979;76:106–110. doi: 10.1073/pnas.76.1.106. - DOI - PMC - PubMed
    1. Reichert JM. Metrics for antibody therapeutics development. mAbs. 2010;2:695–700. doi: 10.4161/mabs.2.6.13603. - DOI - PMC - PubMed
    1. Reichert JM. Antibodies to watch in 2010. mAbs. 2010;2:84–100. doi: 10.4161/mabs.2.1.10677. - DOI - PMC - PubMed

Publication types