. 2022 May 6;13(1):2499.
doi: 10.1038/s41467-022-30243-5.

An instantly fixable and self-adaptive scaffold for skull regeneration by autologous stem cell recruitment and angiogenesis

Affiliations

An instantly fixable and self-adaptive scaffold for skull regeneration by autologous stem cell recruitment and angiogenesis

Gonggong Lu et al. Nat Commun. .

Abstract

Limited stem cells, poor stretchability and mismatched interface fusion have plagued the reconstruction of cranial defects by cell-free scaffolds. Here, we designed an instantly fixable and self-adaptive scaffold by dopamine-modified hyaluronic acid chelating Ca2+ of the microhydroxyapatite surface and bonding type I collagen to highly simulate the natural bony matrix. It presents a good mechanical match and interface integration by appropriate calcium chelation, and responds to external stress by flexible deformation. Meanwhile, the appropriate matrix microenvironment regulates macrophage M2 polarization and recruits endogenous stem cells. This scaffold promotes the proliferation and osteogenic differentiation of BMSCs in vitro, as well as significant ectopic mineralization and angiogenesis. Transcriptome analysis confirmed the upregulation of relevant genes and signalling pathways was associated with M2 macrophage activation, endogenous stem cell recruitment, angiogenesis and osteogenesis. Together, the scaffold realized 97 and 72% bone cover areas after 12 weeks in cranial defect models of rabbit (Φ = 9 mm) and beagle dog (Φ = 15 mm), respectively.


Conflict of interest statement

The authors declare no competing interests.

Figures

Fig. 1
Fig. 1. Clinical treatment of cranial defects by cell-free scaffolds faced significant challenges and imperious demands.
Biomimetic dopamine-mediated hybrid cross-linked realized skull reconstruction through instantly seamless adhesion at defect area, and recruitment and retention of endogenous stem cells to rapid initiation of osteogenesis and angiogenesis. After 12 weeks implantation, the HCLS could realize extensive bone regeneration with bone cover area at 97% for rabbit model (Φ = 9 mm) and 72% for beagle dog model (Φ = 15 mm) at cranial defects sites.
Fig. 2
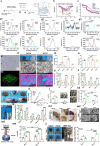
Fig. 2. Engineered self-adhesive and flexible porous hybrid cross-linked scaffold.
a Schematic of the synthesis and structure of HCLS. b DSC test of various specimens. c TG analysis of various specimens. d1 High-resolution X-ray photoelectron spectroscopy spectra of C1s and O1s in HAD and DCLS. d2 High-resolution x-ray photoelectron spectroscopy spectra of Ca2p and P2p in HAp and HCLS. d3 High-resolution X-ray photoelectron spectroscopy spectra of Ca2p in DCLS-0.3MCa2+ and HCLS-0.3MCa2+. e1 Representative Masson’s trichrome staining in HCLS group. e2 CLSM image showing the distribution of μHAp inside the HCLS by calcein staining. f13 SEM images of various scaffolds and corresponding pore size and porosity (*p = 0.0202, ***p = 0.0004, ns = 0.1384, *p = 0.0496). g Quantitative analysis of swelling test (*p = 0.0102, *p = 0.0232, *p = 0.0335, ***p = 6.9215 × 10−5, ***p = 1.2657 × 10−6). h DMA test at 5 Hz after 3, 7, and 14 days swelling (***p = 3.0101 × 10−4, ***p = 8.6268 × 10−7, ***p = 5.428 × 10−6). i1 Flexible HCLS with foldability. i2 Instant fixability of HCLS. i3 Tensile test of various scaffolds. j Tensile test of various scaffolds with or without invasive blood (*p = 0.0116, *p = 0.0314). k13 Characterization of compressive storage modulus with or without invasive blood (**p = 0.0027, ***p = 0.0005, *p = 0.0202, ns = 0.0552). l1, l2 Adhesion test of various hydrogels on different substrate (***p = 2.4921 × 10−6, **p = 0.0023, *p = 0.0410, *p = 0.0262, ***p = 7.8344 × 10−7). m1, m2 Gross view and SEM images of mineralization at the interface between implant and host bone on day 7 and 14. m3, m4 Push-out test of various samples after 7 and 14 days’s implantation (*p = 0.0190, *p = 0.0171, **p = 0.0034, ***p = 1.8517 × 10−5, ***p = 0.0002). n DMA test of various implants at day 7 and 14 (*p = 0.0445, ***p = 2.6672 × 10−5, *p = 0.0103). n = 3 independent replicates from three samples. (Two-sided comparison, error bars represent standard deviation, *p < 0.05, **p < 0.01, and ***p < 0.001).
Fig. 3
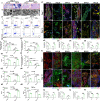
Fig. 3. In vivo immune response of scaffold in mouse intramuscular and rabbit skull defect model.
a H&E staining of implants on days 7 and 14 after implantation in mouse intramuscular. b Cell morphologies of macrophages on different implants. c1) Representative flow cytometry plots of F4/80+, CD197+CD206 macrophages (M1) and CD197CD206+ macrophages (M2) polarization in DCLS and HCLS on days 7 and 14 after implantation in mouse intramuscular. c24) Relevant quantification of F4/80+, CD197+CD206 macrophages (M1) and CD197CD206+ macrophages (M2) polarization in DCLS and HCLS (c2: **p = 0.0054, ***p = 0.0004, ***p = 0.0009, *p = 0.0431; c3: **p = 0.0078, ***p = 2.1538 × 10−5, ***p = 0.0006, ns = 0.1301; c4: **p = 3.7781 × 10−5, ***p = 6.6342 × 10−5, *p = 0.0482, *p = 0.0365). d15 Expression of inflammatory factors induced by implants after implantation in the mouse intramuscular model for 7 and 14 days. n = 3 biologically independent replicates (d1: *p = 0.0378, **p = 0.0018, **p = 0.0022; d2: **p = 0.0065, ***p = 7.8921 × 10−5, ns = 0.0843; d3: **p = 0.0024, **p = 0.0019, ***p = 2.4562 × 10−5; d4: *p = 0.0342, **p = 0.0055, ***p = 4.1243 × 10−7; d5: *p = 0.0158, *p = 0.0301, **p = 0.0087). e1 Representative immunostainings of CD197 and CD206, BMP-2 secretion and F4/80+, and VEGF secretion and F4/80+ macrophages on days 7 and 14 after implantation in mouse intramuscular. e25 Relevant semiquantitative analysis of immunofluorescence staining by Image J software e2: *p = 0.0180, **p = 0.0091; e3: *p = 0.0342, *p = 0.0435; e4: **p = 0.0033, ***p = 8.0122 × 10−6; e5: *p = 0.0185, **p = 0.0044). f1 Representative immunostainings of CD197 and CD206, BMP-2 secretion and F4/80+ and VEGF secretion and F4/80+ macrophages on days 7 and 14 after implantation in rabbit skull defect. f25 Relevant semiquantitative analysis of immunofluorescence staining by Image J software (f2: **p = 0.0020, *p = 0.0416; f3: *p = 0.0196, *p = 0.0394; f4: *p = 0.0149, ***p = 5.5420 × 10−8; f5: ***p = 4.6347 × 10−6, ***p = 8.1728 × 10−7). n = 3 cells examined three independent experiments. (Two-sided comparison, error bars represent standard deviation, *p < 0.05, **p < 0.01, and ***p < 0.001).
Fig. 4
Fig. 4. In vivo osteodifferentiation and ectopic mineralization of BMSCs-laden HCLS.
a1 CLSM images (Live/dead staining) of BMSCs-laden various hydrogels for 14 days. a2 Cell viability of BMSCs-laden various hydrogels at day 3, 7 and 14 (*p = 0.0140, *p = 0.0335, *p = 0.0123, *p = 0.0453, ***p = 1.9112 × 10−7). n = 3 biologically independent replicates. b1 CLSM images (rhodamine-phalloidin/DAPI staining) of BMSCs on day 14. b2 Percentage of cell spreading area after 3, 7, and 14 days (**p = 0.0022, ***p = 8.0407 × 10−7, ***p = 3.1642 × 10−6, **p = 0.0012, *p = 0.0206). c SEM images of BMSCs distributed on gel scaffolds after 14 days incubation. d1, d2) Immunohistochemistry staining of BMP-2 at day 14 and semiquantitative analysis of BMP-2 staining by Image J software (***p = 8.0447 × 10−5, ***p = 1.0591 × 10−4, **p = 0.0032, **p = 0.0026, *p = 0.0124, *p = 0.0221). n = 3 cells examined three independent experiments. e Immunohistochemistry staining of VEGF on day 14. f13 Gene expression of OCN, OPN and Runx2 for the BMSCs encapsulated in various hydrogels at day 3, 7 and 14. All gene expressions were normalized to housekeeping gene β-actin (f1: ***p = 0.0004, ***p = 6.0578 × 10−6, ***p = 1.2233 × 10−7, *p = 0.0156, *p = 0.0147; f2: *p = 0.0464, **p = 0.0067, **p = 0.0014, ***p = 9.8374 × 10−7, ***p = 1.3141 × 10−9, ***p = 2.8964 × 10−10; f3: *p = 0.0461, **p = 0.0031, *p = 0.0139, **p = 0.0069, **p = 0.0023, ***p = 9.2436 × 10−6). n = 3 biologically independent replicates. g Visualization subcutaneous state after 30 days implantation. h1 Gross appearance of the samples before and after implantation. h2) Size change ratio of samples before and after implantation (*p = 0.0448, **p = 0.0056). h3 Dynamic mechanical test after 30 days implantation (***p = 3 × 10−15, ***p = 1 × 10−15, ns = 0.3906, ns = 0.9007). i1 3D reconstruction images of various explants by Micro-CT. i2, i3 Quantitative bone volume analyses (AV: apatite volume. TV: total volume.) i2: **p = 0.0018, ***p = 6.7311 × 10−9; i3: **p = 0.0023, ***p = 5.8921 × 10−9). j SEM images of the inner section of various samples. n = 3 biologically independent replicates. k1 Immunofluorescence staining to detect Runx2 in various BMSCs-loaded hydrogels. k2 Semiquantitative analysis of Runx2 staining by Image J software (**p = 0.0066, ***p = 0.0002). l1 Immunohistochemistry staining to detect VEGF in BMSCs-loaded hydrogels. l2 Semiquantitative analysis of VEGF staining by Image J software (**p = 0.0004, ***p = 5.7513 × 10−5). m1 CD31 staining of various explants. m2 Semiquantitative analysis of CD31 staining by Image J software (**p = 0.0073, ***p = 0.0001). n = 3 cells examined three independent experiments. (Two-sided comparison, error bars represent standard deviation, *p < 0.05, **p < 0.01, and ***p < 0.001).
Fig. 5
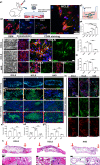
Fig. 5. Endogenous stem cells recruitment by HCLS.
a1 Schematic depiction of in vitro BMSCs recruitment by incubating various scaffolds in a total rabbit cranial bone marrow for 48 h. a2 CD44 immunofluorescent staining imaged by CLSM. a3 Schematic depiction of transwell assay in studying BMSCs migration to various scaffolds. a4 Quantification of migrated BMSCs by dissolving crystal violet and spectrophotometrically measured at 573 nm, the optical density (OD) resulted was normalized by control. BMSCs alone was used as control (**p = 0.0028, ***p = 0.0001, ***p = 0.0002, ***p = 6.7070 × 10−5). n = 3 biologically independent replicates. b SEM images of endogenous cells on the surface of various scaffolds. c CLSM images (rhodamine-phalloidin/DAPI staining) of endogenous cells on the surface of various scaffolds. d CLSM images of CD44/F-actin/DAPI staining of various scaffolds. e1 Confocal quantitative images (CD44/DAPI staining) of ESCs in scaffolds. e2 High-magnification images (CD44/DAPI staining) of ESCs in scaffolds. e3 Quantitative analysis of the total number of cells in scaffolds (*p = 0.0470, **p = 0.0023). e4 Quantitative analysis of the number of ESCs in scaffolds (***p = 0.0008, ***p = 0.0003). n = 3 biologically independent replicates. f13 BMP-2 and Runx2 immunofluorescence staining at one week of different treatments and semiquantitative analysis (f1: ***p = 0.0009, ***p = 5.5298 × 10−5; f2: **p = 0.0078, ***p = 5.8847 × 10−5). g1 CLSM images of CD31 immunofluorescence staining. g2 High-magnification images (CD31/DAPI staining) in scaffolds. g3 Quantitative analysis of the distribution of blood vessels inside various scaffolds (**p = 0.0044, **p = 0.0023). n = 3 cells examined three independent experiments. h H&E staining of different scaffolds after one week (V: new vessels. N: new bone tissue. S: scaffolds). (Two-sided comparison, error bars represent standard deviation, *p < 0.05, **p < 0.01, and ***p < 0.001).
Fig. 6
Fig. 6. Self-adhesive and flexible scaffold regulates gene expressions related to osteogenesis, angiogenesis, and ESCs recruitment in vitro.
a1 Heatmap of Pearson correlation between samples. a2 3D image of principal component analysis of different samples. a3 Venn diagram of the number of differentially expressed genes in different samples. b14 Volcano plot of transcriptomic analysis of differentially expressed genes. n = 3 independent experiments per group. c1, c3 Heatmap analysis of differentially expressed genes involved in top enriched up-Gene Ontology (GO) database. c2, c4 Heatmap analysis of differentially expressed genes involved in top enriched up- Kyoto Encyclopedia of Genes and Genomes (KEGG) pathways. d1, d2 Enriched GO up terms of DCLS versus Col I and HCLS versus DCLS. d3, d4 Enriched KEGG pathways of DCLS versus Col I and HCLS versus DCLS. e1, e3 Heatmap of differentially expressed genes involved in cellular activity, osteogenesis, angiogenesis, and ESCs recruitment of DCLS versus Col I and HCLS versus DCLS. e2, e4 String interaction network of differentially expressed genes involved in cellular activity, osteogenesis, angiogenesis, and ESCs recruitment of DCLS versus Col I and HCLS versus DCLS. (Two-sided comparison, Error bars represent standard deviation, *p < 0.05, n = 3 biologically independent replicates).
Fig. 7
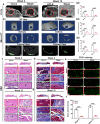
Fig. 7. In situ skull regeneration enhanced by DCLS and HCLS in rabbit cranial defect model.
a, b Representative micro-CT and X-ray images at 4 and 12 weeks. c16 Quantitative analyses of micro-CT results at 4 and 12 weeks. (all the free-cells scaffolds implantation. Blank: defect alone with no treatment) (c1: *p = 0.0459, *p = 0.0324, **p = 0.0011, ***p = 1.4129 × 10−7; c2: *p = 0.0233, **p = 0.0019, ***p = 2.4899 × 10−5, ***p = 9.8579 × 10−9; c3: *p = 0.0141, ns = 0.2583, ***p = 2.8782 × 10−8, ***p = 3.1798 × 10−7; c4: ***p = 0.0003, *p = 0.0451, ***p = 6.4603 × 10−7, **p = 0.0049; c5: *p = 0.0429; c6: *p = 0.01457, ns = 0.7563, **p = 0.0011, ***p = 3.6545 × 10−7). d16 Q-PCR analyses of osteo-related genes, including Col I, Runx2, VEGF, BMP-2, OCN, and OPN in different scaffolds at week 12 (d1: **p = 0.0060, ***p = 9.5355 × 10−5; d2: ***p = 0.0007, **p = 0.0065; d3: ***p = 3.2801 × 10−5, ***p = 5.2939 × 10−6; d4: ***p = 9.4228 × 10−5, ***p = 1.2369 × 10−5; d5: *p = 0.0253, **p = 0.0012; d6: *p = 0.0169, ***p = 1.4583 × 10−6). e1 Western blot analyses of Runx2, BMP-2 and VEGF expression in different scaffolds at week 12. Uncropped blots in Source Data. e24 Relative content (Gray value ratio) of Runx2, BMP-2 and VEGF protein in different scaffolds at week 12 by WB analysis (e2: *p = 0.0410, ***p = 0.0002; e3: *p = 0.0332, ***p = 0.0011; e4: *p = 0.0453, ***p = 0.0006). (Two-sided comparison, error bars represent standard deviation, *p < 0.05, **p < 0.01, and ***p < 0.001).
Fig. 8
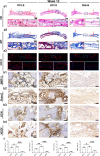
Fig. 8. Representative staining images of regenerated tissue at week 12.
a1 H&E staining of regenerated bones induced by different scaffolds at week 12 after operation. a2 Masson’s trichrome staining at week 12 after the operation. a3 CD31 immunofluorescence staining of regenerated vessels at week 12. (Row 1: Overall observation of the cranial defect repair. The red arrow indicates the initial boundary of the defect. Row 2: Magnified view of the center and boundary site of the defects). (N: new bone tissue. S: scaffolds. V: new blood vessels (black arrow). F: fibrous tissue. B: old bone boundary). b14 Representative immunohistochemistry images of BMP-2, Runx2, OCN, VEGF at week 12 after implantation. c Quantitative analysis of positive cells at week 12. (all scaffolds without cells. Blank: defect alone with no treatment) (***p = 3.7616 × 10−5, *p = 0.0114; ***p = 2.1035 × 10−5, **p = 0.0032, ***p = 6.41247 × 10−5, *p = 0.0355, ***p = 5.2544 × 10−5, *p = 0.0409). (Two-sided comparison, error bars represent standard deviation, *p < 0.05, **p < 0.01, and ***p < 0.001).
Fig. 9
Fig. 9. Skull reconstruction by HCLS activating angiogenesis and osteogenesis in beagle dog model.
a X-ray images of the regenerated bone tissue. b1 Representative micro-CT images and b24 quantitative histomorphometry analyses of bone regeneration in cranial defects in dogs at 4 and 12 weeks (b2: **p = 0.0074, ***p = 1.5931 × 10−7; b3: **p = 0.0008; ***p = 5.4303 × 10−7; b4: **p = 0.0019, ***p = 2.51131 × 10−7). n = 3 biologically independent replicates. c H&E staining of regenerated bones at 4 and 12 weeks after operation. d Masson’s trichrome staining of regenerated bones at 4 and 12 weeks after the operation. (Row 1: overall observation of the cranial defect repair. The red arrow indicates the initial boundary of the defect. Row 2: magnified view of the center and boundary site of the defect). (N: new bone tissue. S: scaffolds. V: new blood vessels. F: fibrous tissue. M: Muscle tissue). e Representative IF staining images of CD31 at 4 and 12 weeks after implantation. f Semiquantitative analysis of CD31 IF staining at 4 and 12 weeks. (all scaffolds without cells. Blank: defect alone with no treatment) (***p = 8.1804 × 10−7, ***p = 9.7494 × 10−8). (two-sided comparison, error bars represent standard deviation, *p < 0.05, **p < 0.01, and ***p < 0.001).

Similar articles

Cited by

References

    1. Cordonnier C, Demchuk A, Ziai W, Anderson CS. Intracerebral haemorrhage: current approaches to acute management. Lancet. 2018;392:1257–1268. doi: 10.1016/S0140-6736(18)31878-6. - DOI - PubMed
    1. Rosenfeld JV, et al. Early management of severe traumatic brain injury. Lancet. 2012;380:1088–1098. doi: 10.1016/S0140-6736(12)60864-2. - DOI - PubMed
    1. Bhumiratana S, et al. Tissue-engineered autologous grafts for facial bone reconstruction. Sci. Transl. Med. 2016;8:343ra83. doi: 10.1126/scitranslmed.aad5904. - DOI - PMC - PubMed
    1. Xu H, et al. Early cranioplasty vs. late cranioplasty for the treatment of cranial defect: a systematic review. Clin. Neurol. Neurosur. 2015;136:33–40. doi: 10.1016/j.clineuro.2015.05.031. - DOI - PubMed
    1. Chai Y, Maxson RE., Jr Recent advances in craniofacial morphogenesis. Dev. Dyn. 2006;235:2353–2375. doi: 10.1002/dvdy.20833. - DOI - PubMed

Publication types