

Improvement of automated analysis of coronary Doppler echocardiograms
- PMID: 35523823
- PMCID: PMC9076637
- DOI: 10.1038/s41598-022-11402-6
Improvement of automated analysis of coronary Doppler echocardiograms
Abstract
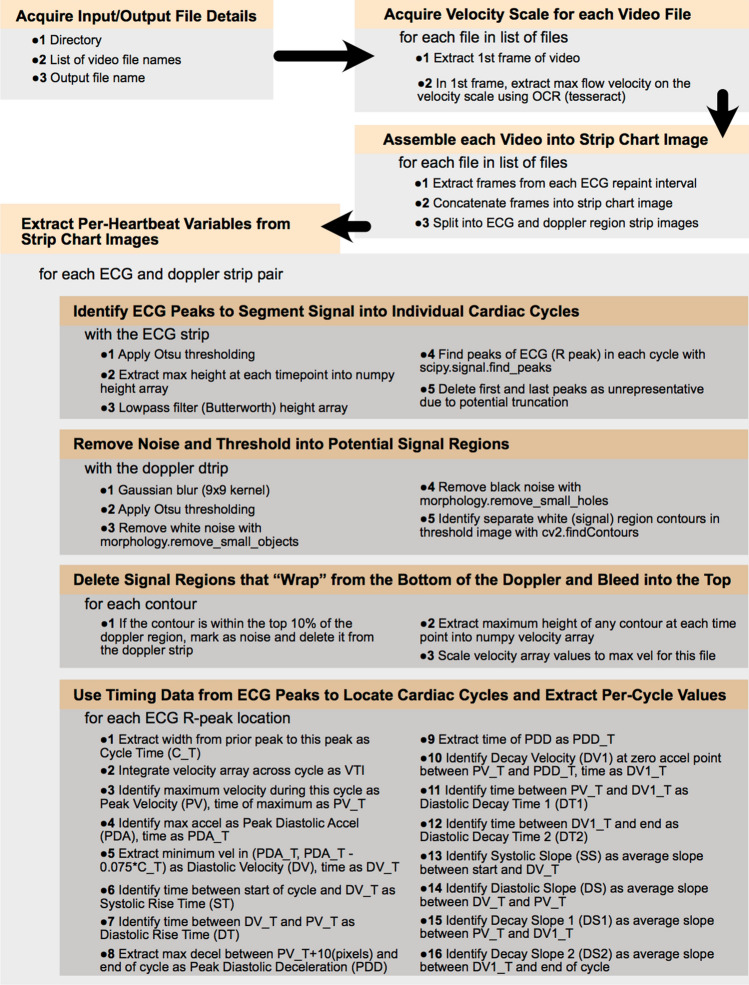
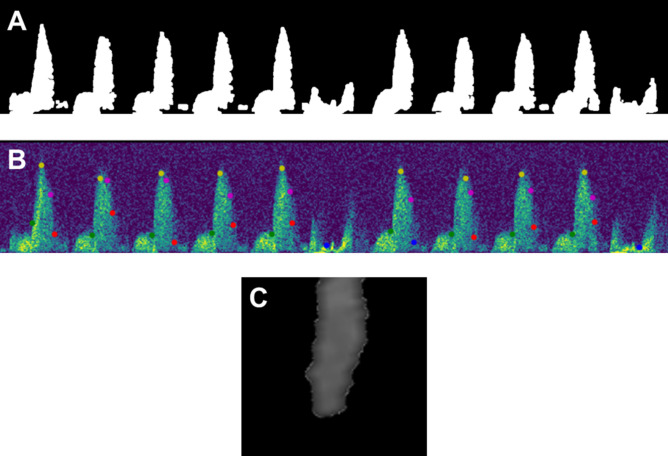
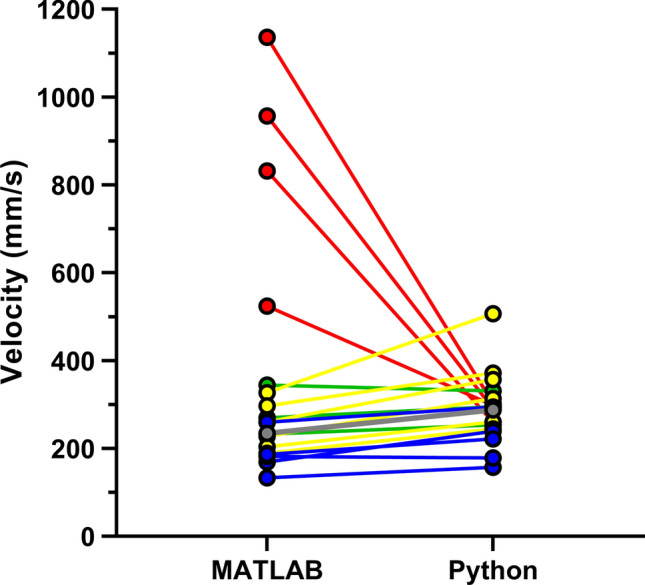
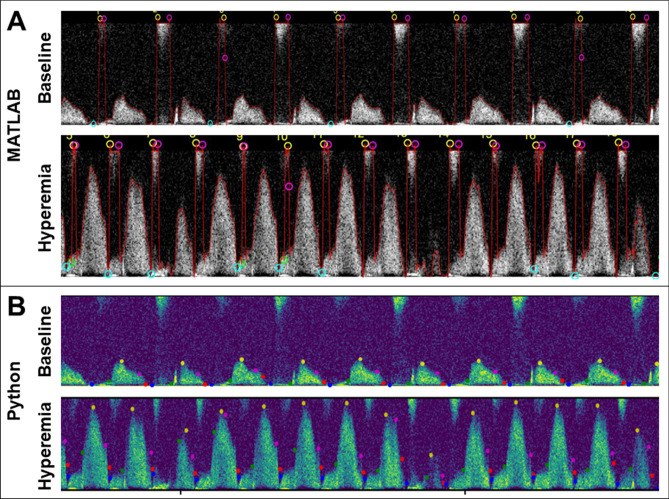
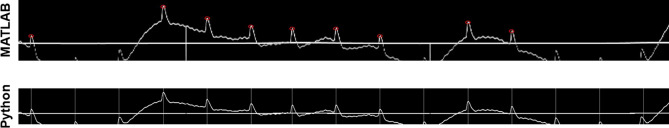
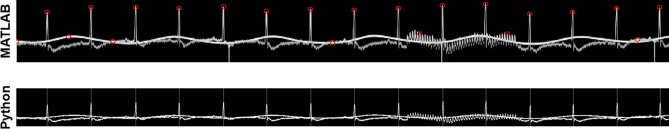
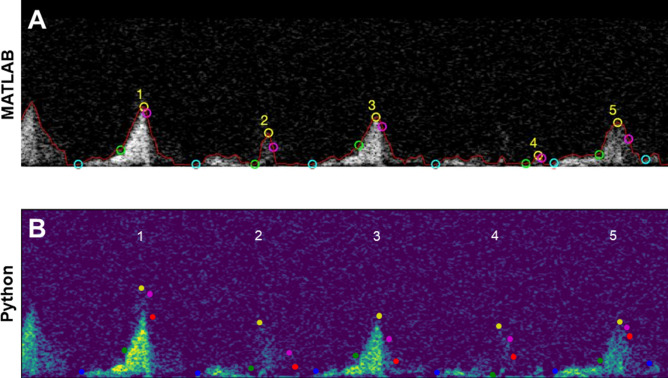
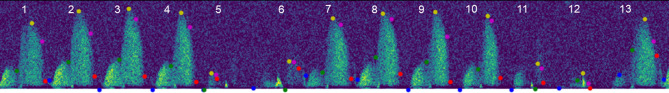
Coronary artery disease is the leading cause of heart disease, and while it can be assessed through transthoracic Doppler echocardiography (TTDE) by observing changes in coronary flow, manual analysis of TTDE is time consuming and subject to bias. In a previous study, a program was created to automatically analyze coronary flow patterns by parsing Doppler videos into a single continuous image, binarizing and separating the image into cardiac cycles, and extracting data values from each of these cycles. The program significantly reduced variability and time to complete TTDE analysis, but some obstacles such as interfering noise and varying video sizes left room to increase the program's accuracy. The goal of this current study was to refine the existing automation algorithm and heuristics by (1) moving the program to a Python environment, (2) increasing the program's ability to handle challenging cases and video variations, and (3) removing unrepresentative cardiac cycles from the final data set. With this improved analysis, examiners can use the automatic program to easily and accurately identify the early signs of serious heart diseases.
© 2022. The Author(s).
Conflict of interest statement
The authors declare no competing interests.
Figures
Similar articles
-
Noninvasive assessment of coronary flow velocity and coronary flow velocity reserve in the left anterior descending coronary artery by Doppler echocardiography: comparison with invasive technique.J Am Coll Cardiol. 1998 Nov;32(5):1251-9. doi: 10.1016/s0735-1097(98)00389-1. J Am Coll Cardiol. 1998. PMID: 9809933
-
Noninvasive assessment of coronary flow velocity and coronary flow velocity reserve in the right coronary artery by transthoracic Doppler echocardiography: comparison with intracoronary Doppler guidewire.J Am Soc Echocardiogr. 2002 Oct;15(10 Pt 1):1074-9. doi: 10.1067/mje.2002.122356. J Am Soc Echocardiogr. 2002. PMID: 12373249
-
Non-invasive assessment of coronary flow velocity reserve: a new method using transthoracic Doppler echocardiography.J Huazhong Univ Sci Technolog Med Sci. 2002;22(2):158-63. doi: 10.1007/BF02857683. J Huazhong Univ Sci Technolog Med Sci. 2002. PMID: 12658763
-
Transthoracic Doppler echocardiography - noninvasive diagnostic window for coronary flow reserve assessment.Cardiovasc Ultrasound. 2003 Apr 11;1:4. doi: 10.1186/1476-7120-1-4. Cardiovasc Ultrasound. 2003. PMID: 12740038 Free PMC article. Review.
-
Non-invasive assessment of coronary flow and coronary flow reserve by transthoracic Doppler echocardiography: a magic tool for the real world.Eur J Echocardiogr. 2008 Jul;9(4):449-57. doi: 10.1093/ejechocard/jen004. Epub 2008 Feb 19. Eur J Echocardiogr. 2008. PMID: 18296409 Review.
Cited by
-
Machine learning: a new era for cardiovascular pregnancy physiology and cardio-obstetrics research.Am J Physiol Heart Circ Physiol. 2024 Aug 1;327(2):H417-H432. doi: 10.1152/ajpheart.00149.2024. Epub 2024 Jun 7. Am J Physiol Heart Circ Physiol. 2024. PMID: 38847756 Free PMC article. Review.
-
Development of artificial intelligence tools for invasive Doppler-based coronary microvascular assessment.Eur Heart J Digit Health. 2023 May 3;4(4):291-301. doi: 10.1093/ehjdh/ztad030. eCollection 2023 Aug. Eur Heart J Digit Health. 2023. PMID: 37538145 Free PMC article.
References
Publication types
MeSH terms
Grants and funding
LinkOut - more resources
Full Text Sources
Medical
