. 2022 May 6;5(1):423.
doi: 10.1038/s42003-022-03377-x.

The MFN1 and MFN2 mitofusins promote clustering between mitochondria and peroxisomes

Affiliations

The MFN1 and MFN2 mitofusins promote clustering between mitochondria and peroxisomes

Yinbo Huo et al. Commun Biol. .

Abstract

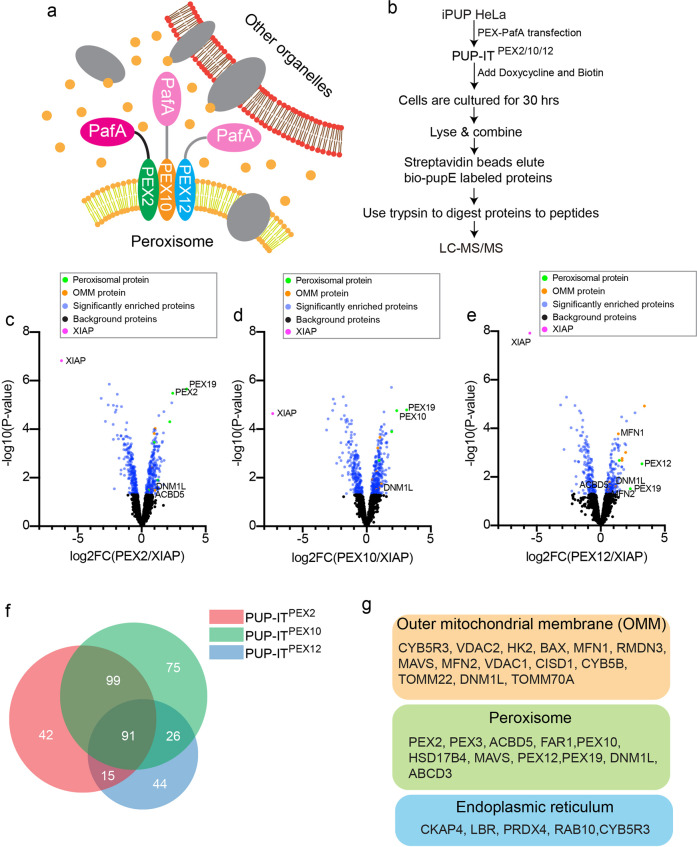
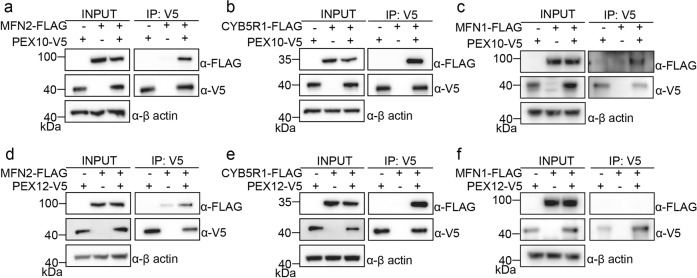
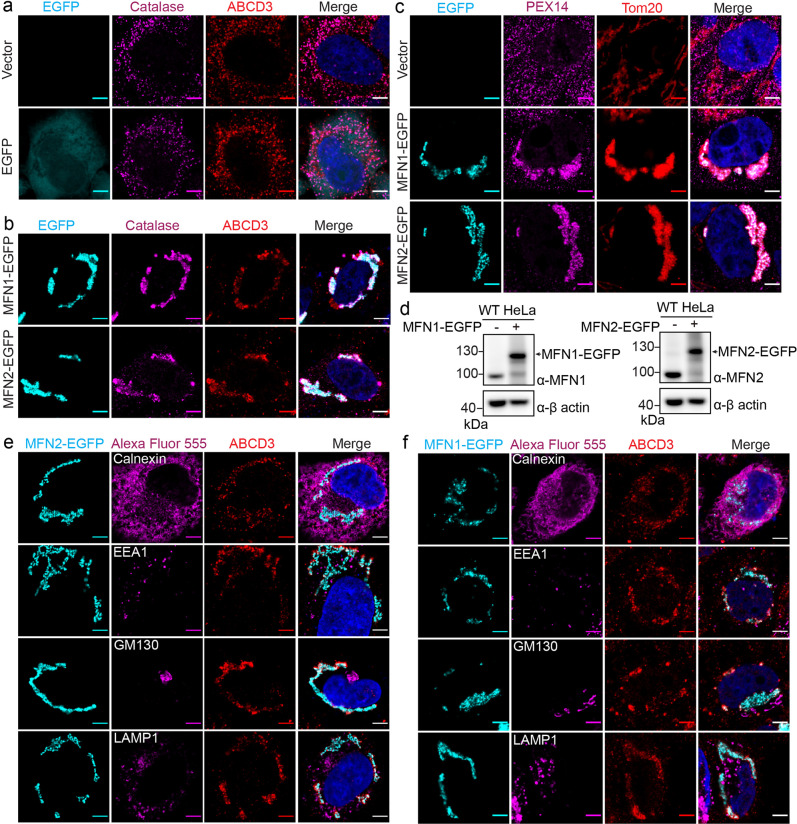
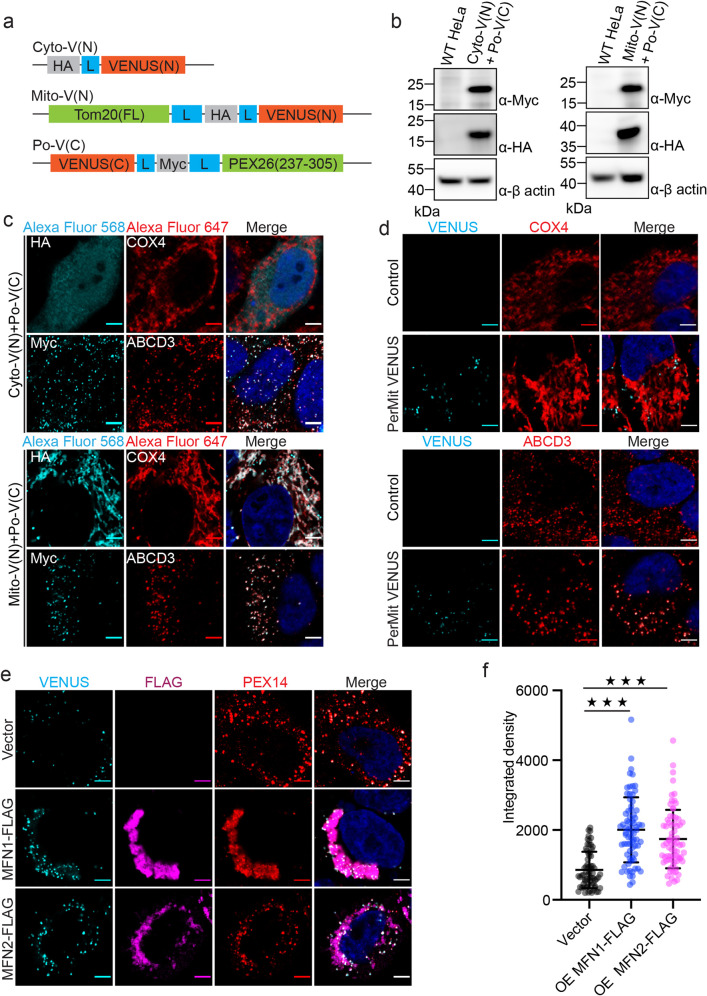
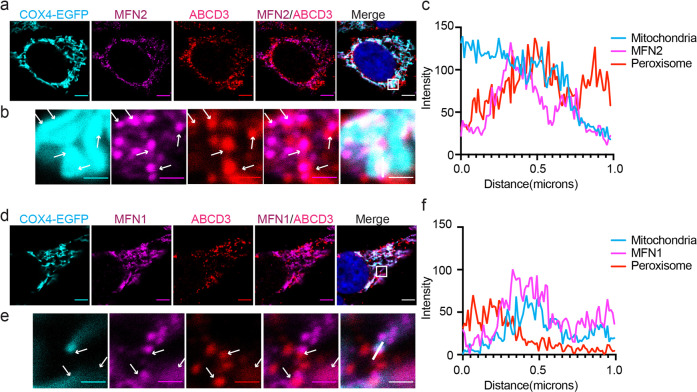
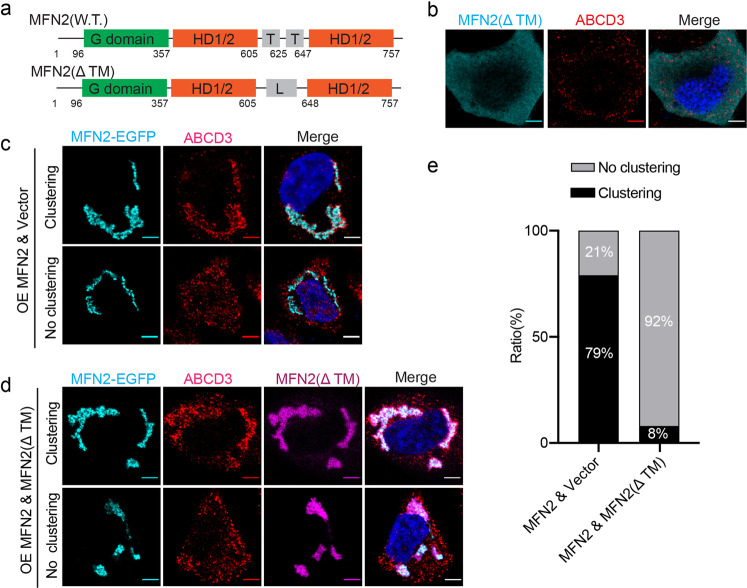
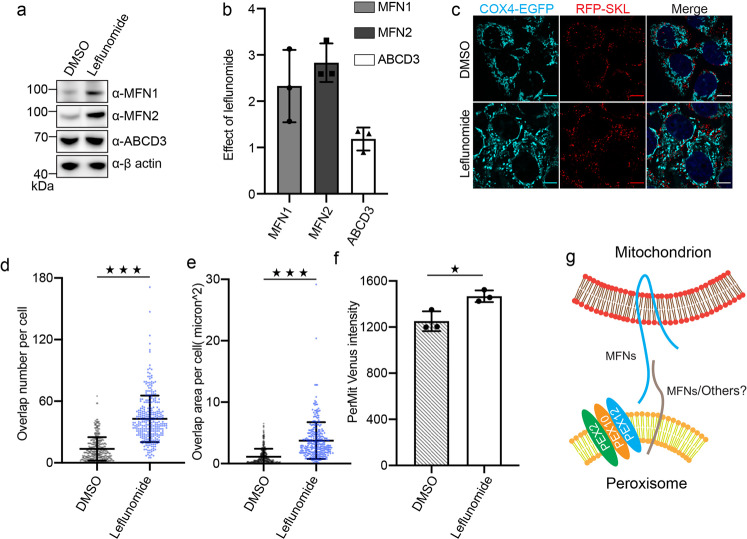
Mitochondria and peroxisomes are two types of functionally close-related organelles, and both play essential roles in lipid and ROS metabolism. However, how they physically interact with each other is not well understood. In this study, we apply the proximity labeling method with peroxisomal proteins and report that mitochondrial protein mitofusins (MFNs) are in proximity to peroxisomes. Overexpression of MFNs induces not only the mitochondria clustering but also the co-clustering of peroxisomes. We also report the enrichment of MFNs at the mitochondria-peroxisome interface. Induced mitofusin expression gives rise to more mitochondria-peroxisome contacting sites. Furthermore, the tethering of peroxisomes to mitochondria can be inhibited by the expression of a truncated MFN2, which lacks the transmembrane region. Collectively, our study suggests MFNs as regulators for mitochondria-peroxisome contacts. Our findings are essential for future studies of inter-organelle metabolism regulation and signaling, and may help understand the pathogenesis of mitofusin dysfunction-related disease.


Conflict of interest statement

The authors declare no competing interests. Min Zhuang is an Editorial Board Member for Communications Biology, but was not involved in the editorial review of, nor the decision to publish this article.

Figures

Fig. 1
Fig. 1. Identification of PEX2/10/12 interacting proteins by PUP-IT.
a Schematic view of the PUP-IT design to identify PEX2/10/12 proximity proteins. PafA was fused to one of the PEX proteins, co-expressed with bio-PupE (yellow dots), and mediates bio-PupE modifications on proximal proteins. b The experimental workflow. The iPUP HeLa cells were transfected with PEX2-PafA, PEX10-PafA, and PEX12-PafA, respectively, to generate PUP-IT PEX2, PUP-ITPEX10, and PUP-ITPEX12 HeLa cells. The proximity labeling was induced in 2 × 107 cells by the addition of doxycycline (2 μg/ml) and biotin (4 μM) for 30 h. Cells were lysed, and bio-PupE modified proteins were enriched and identified by mass spectrometry. ce Volcano plots of PUP-ITPEX2, PUP-ITPEX10, and PUP-ITPEX12-interacting proteins. The logarithmic ratios of protein label-free quantification intensity (PEX/XIAP) were plotted against negative logarithmic P values in the limma package. Limma-based t-test was used for significant difference testing of data. The candidate proteins were determined by a moderated t-test (P-value < 0.05) and fold change (fold change > 1.3). The blue dots represent significantly enriched proteins (false discovery rate ≤ 0.05; n  =  3 independent experiments). The right arm comprises proteins that are proximal to peroxisomes, the left arm proteins proximal to XIAP. Yellow dots represent outer mitochondrial membrane (OMM) proteins. Green dots represent peroxisomal proteins. The magenta dot represents XIAP. f Analysis of significantly enriched proteins in three datasets (PUP-ITPEX2, PUP-ITPEX10, and PUP-ITPEX12) through Venn diagram. The data were analyzed with BioVenn. g Subsets of proteins identified with proximity labeling include OMM proteins, peroxisomal proteins, and ER proteins. Other proteins are not shown but included in the Supplementary Data 1. Protein localization was assigned based on Uniprot and MitoCarta 3.0.
Fig. 2
Fig. 2. PEX10 and PEX12 interact with MFN proteins.
a Co-immunoprecipitation (IP) of PEX10 and MFN2. V5 tagged PEX10 was co-transfected with FLAG-tagged MFN2 in HEK293T cells. Cells were collected 36 h after transfection for IP of PEX10-V5 and immunoblotting (IB) with indicated antibodies. Cell lysates and immunoprecipitated proteins were loaded with same amount on multiple gels for different blots. Similar co-immunoprecipitation experiments were performed for PEX10 and CYB5R1 (b), PEX10 and MFN1 (c), PEX12 and MFN2 (d), PEX12 and CYB5R1 (e), and PEX12 and MFN1 (f).
Fig. 3
Fig. 3. Exogenous expression of MFN induces peroxisome/mitochondrion clustering.
Immunofluorescence images of overexpressed MFN-EGFP. HeLa cells were transfected with free EGFP (a) or EGFP fused MFN (b) plasmids for 36 h. Peroxisomal matrix protein catalase (Alexa Fluor 555) and peroxisomal membrane protein ABCD3 (Alexa Fluor 647) were immune-stained. Scale bars, 5 μm. c Peroxisomal membrane protein PEX14 (Alexa Fluor 555) and outer mitochondrial membrane protein Tom20 (Alexa Fluor 647) were immunostained with or without exogenously expressed MFNs. Scale bars, 5 μm. d Immuno-blots of overexpressed MFN1-EGFP and MFN2-EGFP. 1.5 µg plasmids were transfected into HeLa cells in one well in a six-well cell culture plate for 36 h and immunoblotted with indicated antibodies. e Immunofluorescence images of overexpressed MFN2-EGFP and other organelle markers. HeLa cells were transfected with MFN2-EGFP and immunostained for peroxisomal membrane protein ABCD3 (Alexa Fluor 647) and other organelle markers (Alexa Fluor 555): calnexin (endoplasmic reticulum), EEA1 (early endosome), GM130 (Golgi), and LAMP1 (lysosome). Scale bars, 5 μm. f Immunofluorescence images of overexpressed MFN1-EGFP and other organelle markers stained the same as in (c).
Fig. 4
Fig. 4. Exogenous expression of MFNs enhance the PerMit Venus reporter signal.
a Schematic for the constructs of Cyto-V(N), Mito-V(N), and Po-V(C). Cyto-V(N), HA tag fused to the N terminus of Venus with a linker composed of 4 × GGSG (indicated with blue box); Mito-V(N), Tom20 fused to the N terminus Venus with a HA tag and two linkers as indicated; Po-V(C), Myc tag and PEX26(residues 237-305) fused to the C terminus of Venus (residues 155-238). b Immuno-blots for Cyto-V(N), Mito-V(N), and Po-V(C). c Immunofluorescence images of Cyto-V(N), Mito-V(N), and Po-V(C) co-stained with mitochondrial COX4 and peroxisomal ABCD3 in HeLa cells. Scale bars, 5 μm. d Immunofluorescence images of Venus co-stained with mitochondrial COX4 and peroxisomal ABCD3 in PerMit Venus and control cells. Scale bars, 5 μm. e Immunofluorescence images of PerMit Venus cells with exogenously expressed MFNs. PerMit Venus cells were transfected with empty vector, MFN1-FLAG, or MFN2-FLAG plasmids for 36 h. FLAG (Alexa Fluor 568) and peroxisomal membrane protein PEX14 (Alexa Fluor 647) were immunostained. Scale bars, 5 μm. f Integrated density of (e), Vector, n = 67; MFN1-FLAG, n = 73; MFN2-FLAG, n = 72. ***p < 0.001. Mean with SD.
Fig. 5
Fig. 5. Endogenous mitofusins locate on the mitochondrion-peroxisome contacting sites.
a Immunofluorescence images of endogenous MFN2. Confocal microscopy analysis of HeLa cells expressing COX4-EGFP (mitochondria), immunostained for MFN2 (Alexa Fluor 555) and peroxisomal protein ABCD3 (Alexa Fluor 647). Scale bars: 5 μm. b The zoomed-in images of the white box in (a). White arrows point the places where ABCD3 overlaps with MFN. Scale bars: 1 μm. c Histograms display measured fluorescence intensity along the white line in the merge panels in b, with the cyan line represents mitochondria, the magenta line represents endogenous MFN2, and the red line represents peroxisome. df Immunofluorescence images and analysis of endogenous MFN1. Similar experiments were performed as in (ac).
Fig. 6
Fig. 6. MFN2(ΔTM) blocks mitochondrion-peroxisome clustering.
a Schematic of the organization of wild type MFN2 and MFN2(ΔTM). G domain, GTPase domain; HD1/2, helical domain 1/2; T, transmembrane region; L, a Gly-Ser linker. Amino acids 606–647 in wild-type MFN2 were replaced with a 10 amino acid linker GGSGGGSGGG. b Confocal micrographs of HeLa cells transfected with FLAG-tagged MFN2(ΔTM). Cells were immunostained for endogenous ABCD3 (Alexa Fluor 647) and FLAG (Alexa Fluor 555). Representative confocal micrographs of HeLa cells transfected with (d) or without (c) MFN2(ΔTM)-FLAG. MFN2-EGFP was overexpressed to induce mitochondrion-peroxisome clustering in both conditions. Cells were stained for ABCD3 and MFN2(ΔTM)-FLAG. e The statistics of cell numbers in different stages were analyzed for experiments in c (n = 240 cells) and d (n = 106 cells).
Fig. 7
Fig. 7. Upregulation of endogenous mitofusins stimulates mitochondrion-peroxisome contacting.
a Immuno-blots of MFN1, MFN2, and ABCD3 in cells treated with/without leflunomide. b Fold change of protein levels on immune-blots (a), quantified with ImageJ (n = 3, error bars represent standard deviation). c Representative fluorescence images of the HeLa cells stably expressing COX4-EGFP and RFP-SKL, treated with either DMSO or leflunomide (50 μM, 48 h). d, e Quantification of peroxisome and mitochondrion overlap in images collected in (c). Scatter dot plots showing peroxisome and mitochondria overlap number and area in HeLa cells incubated with DMSO (n = 348 cells) and 50 μM leflunomide (n = 310 cells) respectively for 48 h. ***p < 0.001. Mean with SD. P values calculated via unpaired Student’s t-test (two-tailed). f The Venus fluorescence intensity in cells treated with either DMSO or 50 μM leflunomide were analyzed with flow cytometry. At each condition, the mean fluorescence intensity (MFI) is calculated from 20,000 to 60,000 cells. The experiment was repeated for three times. The columns represent average MFI (mean fluorescence intensity) with SD. *p < 0.05, calculated via unpaired Student’s t-test (two-tailed). g A working model for MFN mediated PerMit contacting.

Similar articles

Cited by

References

    1. Schrader M, Costello J, Godinho LF, Islinger M. Peroxisome-mitochondria interplay and disease. J. Inherit. Metab. Dis. 2015;38:681–702. doi: 10.1007/s10545-015-9819-7. - DOI - PubMed
    1. Peruzzo, R., Costa, R., Bachmann, M., Leanza, L. & Szabo, I. Mitochondrial metabolism, contact sites, and cellular calcium signaling: Implications for tumorigenesis. Cancers10.3390/cancers12092574 (2020). - PMC - PubMed
    1. Fransen, M., Lismont, C. & Walton, P. The peroxisome-mitochondria connection: How and why? Int. J. Mol. Sci.10.3390/ijms18061126 (2017). - PMC - PubMed
    1. Fan J, Li X, Issop L, Culty M, Papadopoulos V. ACBD2/ECI2-mediated peroxisome-mitochondria interactions in Leydig cell steroid biosynthesis. Mol. Endocrinol. 2016;30:763–782. doi: 10.1210/me.2016-1008. - DOI - PMC - PubMed
    1. Shai N, et al. Systematic mapping of contact sites reveals tethers and a function for the peroxisome-mitochondria contact. Nat. Commun. 2018;9:1761. doi: 10.1038/s41467-018-03957-8. - DOI - PMC - PubMed

Publication types

MeSH terms

Substances