. 2022 Jul;36(7):1794-1805.
doi: 10.1038/s41375-022-01586-1. Epub 2022 May 6.

The scaffold protein NEDD9 is necessary for leukemia-cell migration and disease progression in a mouse model of chronic lymphocytic leukemia

Affiliations

The scaffold protein NEDD9 is necessary for leukemia-cell migration and disease progression in a mouse model of chronic lymphocytic leukemia

Lisa Rusyn et al. Leukemia. 2022 Jul.

Abstract

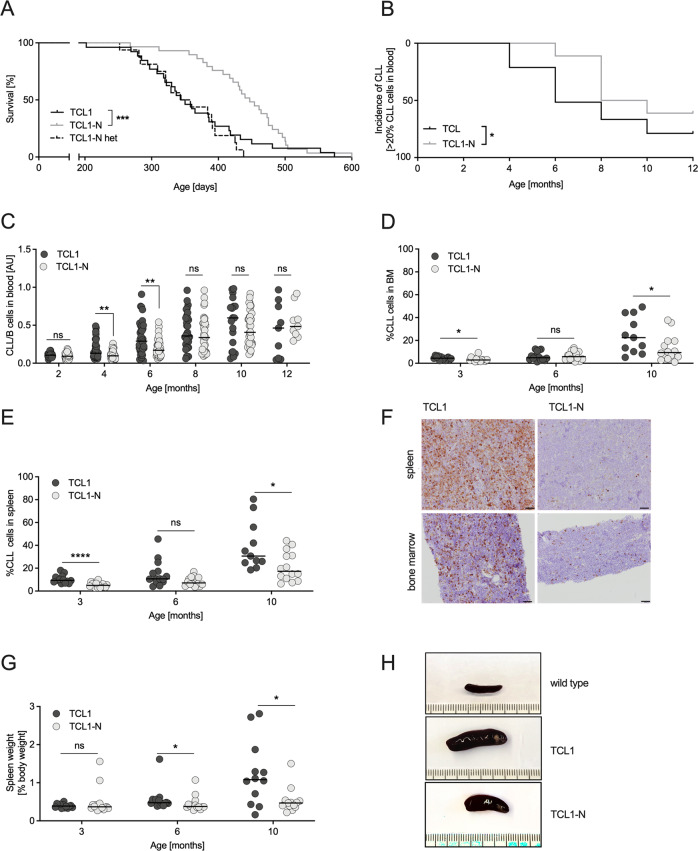
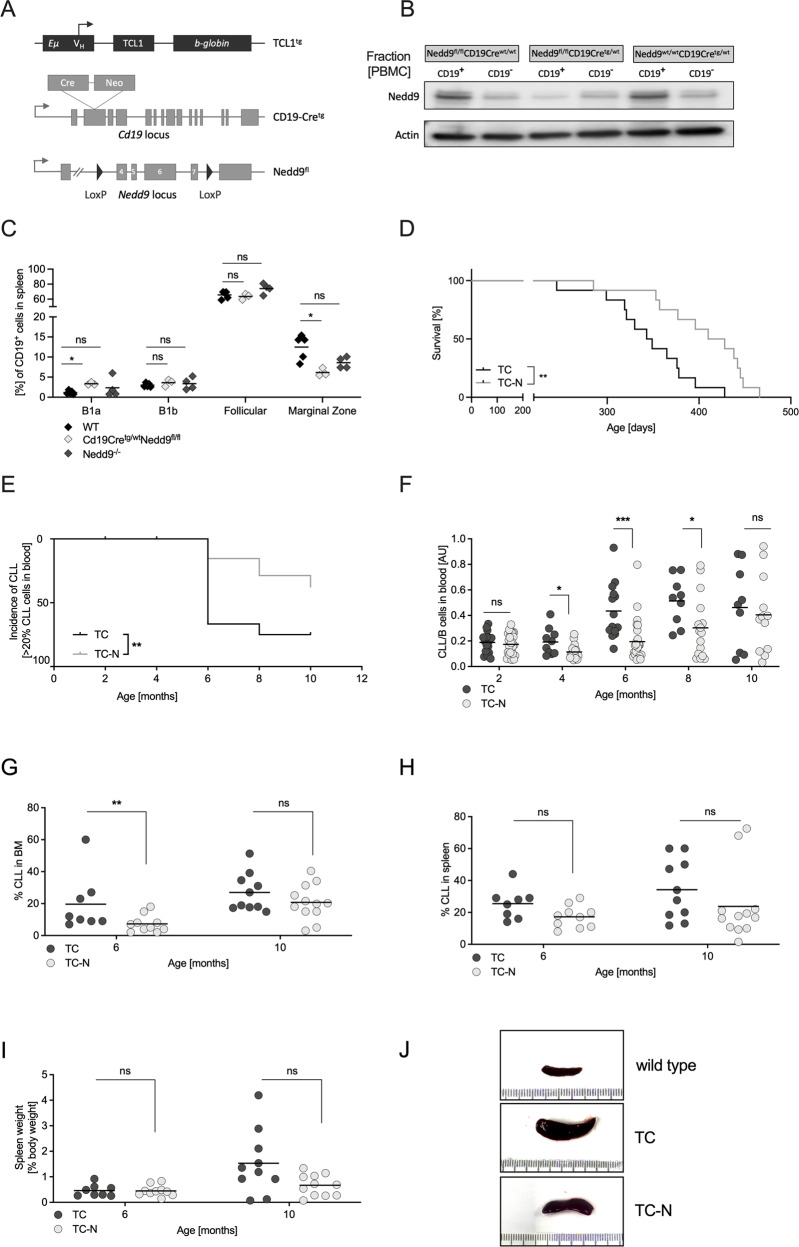
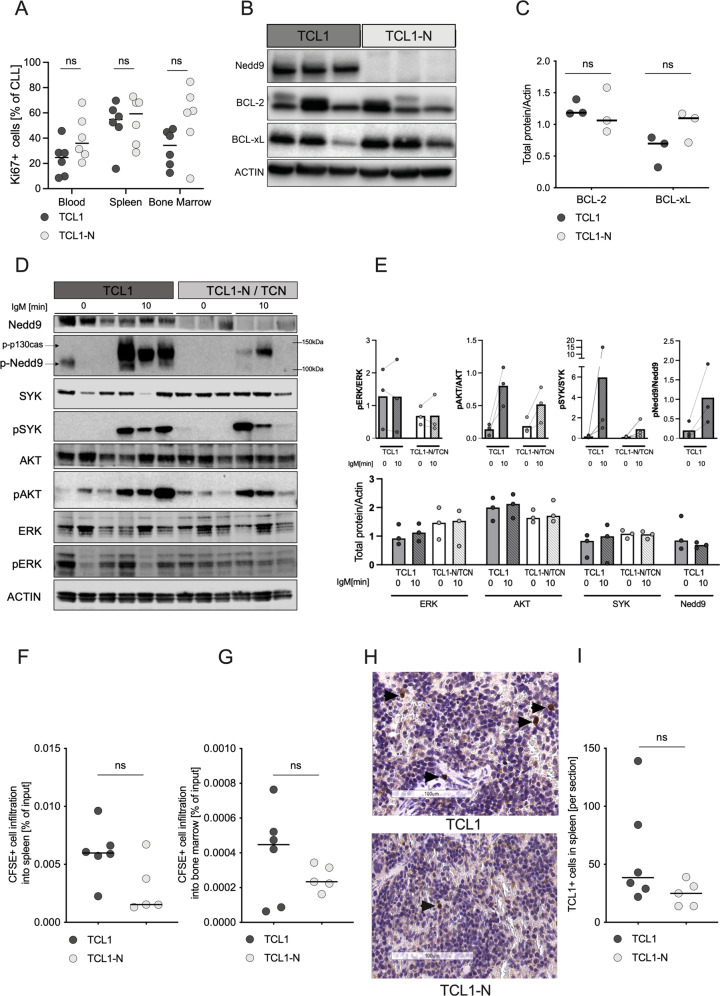
The scaffold protein NEDD9 is frequently upregulated and hyperphosphorylated in cancers, and is associated with poor clinical outcome. NEDD9 promotes B-cell adhesion, migration and chemotaxis, pivotal processes for malignant development. We show that global or B-cell-specific deletion of Nedd9 in chronic lymphocytic leukemia (CLL) mouse models delayed CLL development, markedly reduced disease burden and resulted in significant survival benefit. NEDD9 was required for efficient CLL cell homing, chemotaxis, migration and adhesion. In CLL patients, peripheral NEDD9 expression was associated with adhesion and migration signatures as well as leukocyte count. Additionally, CLL lymph nodes frequently expressed high NEDD9 levels, with a subset of patients showing NEDD9 expression enriched in the CLL proliferation centers. Blocking activity of prominent NEDD9 effectors, including AURKA and HDAC6, effectively reduced CLL cell migration and chemotaxis. Collectively, our study provides evidence for a functional role of NEDD9 in CLL pathogenesis that involves intrinsic defects in adhesion, migration and homing.


Conflict of interest statement

All authors declare no competing interests.

Figures

Fig. 1
Fig. 1. Nedd9 depletion impairs CLL cell infiltration and prolongs survival in the Eµ-TCL1 mouse model.
A Kaplan–Meier curve representing the overall survival of Nedd9 knockout (TCL1-N), Nedd9 heterozygous (TCL1-N het) and Nedd9 wildtype (TCL1) TCL1 mice from birth to moribund. Median survival TCL1 = 347 days (n = 26), TCL1-N het = 350.5 days (n = 16), TCL1-N = 447 days (n = 29), p = 0.0003. B Flow cytometric analysis of CD19+CD5+ CLL cells in peripheral blood mononuclear cells (PBMC) of TCL1 and TCL1-N mice at indicated time points presenting CLL incidence, defined as CLL cells in PBMC > 20%. P = 0.01. C Flow cytometric analysis of CD19+CD5+ CLL cells in PBMC of TCL1 and TCL1-N mice at indicated time points (as ratio CLL/B-cells). P (2 months) = 0.2884; p (4 months) = 0.0087; p (6 months) = 0.0026; p (8 months) = 0.5044; p (10 months) = 0.4241; p (12 months) = 0.4894. D Flow cytometric analysis of CD19+CD5+ CLL cells in bone marrow samples of age-matched TCL1 and TCL1-N mice. P (3 months) = 0.0129; p (6 months) = 0.7345; p (10 months) = 0.0442. E Flow cytometric analysis of CD19+CD5+ CLL cells in spleens of age-matched TCL1 and TCL1-N mice. P (3 months) < 0.0001; p (6 months) = 0.11; p (10 months) = 0.04. F Representative immunohistochemical stainings of CD45R from sections of spleen and bone marrow from ten months old TCL1 and TCL1-N mice. Scale bars represent 50 μm. G Spleen weight relative to body weight of age-matched TCL1 and TCL1-N mice. P (3 months) = 0.59; p (6 months) = 0.01; p (10 months) = 0.02. H Representative pictures of spleens from ten months old wildtype, TC and TCN mice. Ruler unit in mm/cm.
Fig. 2
Fig. 2. B-cell specific loss of Nedd9 is sufficient to reduce CLL burden in TCL1 mice.
A Schematic representation of novel genetic loci for B-cell specific Nedd9 knockout. B Confirmation of B-cell specific loss of Nedd9 protein upon Cd19-dependent Cre-recombination. Cd19+ and Cd19 cells were sorted from PBMC of mice with indicated genotypes using mouse Cd19-specific magnetic beads and indicated protein lysates where blotted for Nedd9. C Flow cytometric analysis of different B-cell subsets in spleens of WT (n = 4), CD19Cretg/wtNedd9fl/fl and Nedd9−/− mice, p (B1a cells CD19Cretg/wtNedd9fl/fl vs. WT) = 0.035714; p (marginal zone B-cells CD19Cretg/wtNedd9fl/fl vs. WT) = 0.035714. D Kaplan–Meier curve representing the overall survival of B lineage-specific Nedd9 knockout (TC-N), and control cohort (TC) from birth to moribund. Median survival TC-N = 419 days (n = 12), TC = 346 days (n = 12), p = 0.0031. E Flow cytometric analysis of CD19+CD5+ CLL cells in the peripheral blood of mice with (TC-N) and without (TC) B lineage-specific Nedd9 loss at indicated time points (as ratio of CLL cells/B-cells). P (2 months) = 0.6355; p (4 months) = 0.0273; p (6 months) = 0.0001; p (8 months) = 0.0369; p (10 months) = 0.6016. F Flow cytometric analysis of CD19+CD5+ CLL cells in PBMC of TC and TC-N mice at indicated time points presenting CLL incidence (CLL cells in PBMC > 20%). P = 0.0039. G Flow cytometric analysis of CD19+CD5+ CLL cells in bone marrow samples of age-matched TC and TC-N mice. P (6 months) = 0.0.0050; p (10 months) = 0.4664. H Flow cytometric analysis of CD19+CD5+ CLL cells in spleens of age-matched TC and TC-N mice. P (6 months) = 0.0782; p (10 months) = 0.0513. I Spleen weight relative to body weight of age-matched TC and TC-N mice. P (6 months) > 0.9999; p (10 months) = 0.0845. J Representative pictures of spleens from ten months old wildtype, TC and TC-N mice. Ruler unit in mm/cm.
Fig. 3
Fig. 3. Nedd9 loss impairs homing of CLL cells to lymphoid organs.
A Flow cytometric analysis of Ki67+ CLL cells indicating proliferation in blood, spleen and bone marrow samples of ten months old TCL1 and TCL1-N mice. P (blood) = 0.1797; p (spleen) = 0.8182; p (bone marrow) = 0.0931. B CLL cells isolated from moribund TCL1 or TCL1-N mice and examined for protein levels of Nedd9, BCL-2, BCL-xL and β-Actin by Western Blot. C Western blot quantification of BCL-2 and BCL-xL by lab image 1D, normalization on mean of all samples. N = 3; p (BCL-2) = 0.7000; p (BCL-xL) = 0.2000. D CLL cells isolated from individual moribund TCL1 or TCL-N mice. Cells from each individual mouse were kept untreated or stimulated with 20 µg/ml IgM for the indicated time before protein lysis and Western Blot analysis of indicated candidates. Phosphorylated Nedd9 was detected with an antibody specific for phosphorylated p130Cas [48] that detects phosphorylated Nedd9 between 100–115 kDa. E Western blot quantification of pERK, pAKT, pSYK, pNedd9 normalized to total respective protein, and total protein levels normalized to Actin by lab image 1D. F Flow cytometric analysis of CFSE+ CLL cells of TCL1 and TCL1-N mice homing to the spleen and (G) bone marrow of NOD/SCID mice three hours post intravenous injection. P (spleen) = 0.1255); p (bone marrow) = 0.4286. H Representative immunohistochemical staining with specific antibody to human TCL1 of sections from spleens of NSG recipients after in vivo homing assays with TCL1 and TCL1-N cells. I Quantification of TCL1 staining spleens of recipient TCL1 and TCL1-N mice P = 0.1190. Histology slides were scanned and analyzed with the Aperio ImageScope – Pathology Slide Viewing Software (Leica, Wetzlar, Germany). Six fields per slide were analyzed at 20x magnification.
Fig. 4
Fig. 4. Loss of Nedd9 impairs multiple steps of the CLL homing process, including adhesion and migration.
A CLL cells isolated from moribund TCL1 or TCL1-N mice were analyzed for cell adhesion after 60 min to uncoated or fibronectin (FN) coated cover slips and plotted as % of TCL1 CLL cell adhesion to uncoated cover slips. P (uncoated) = 0.5133; p (Fibronectin) = 0.0061. B Primary murine CLL cells were allowed to adhere to bone marrow cells derived from wildtype mice for 24 h followed by FACS analysis of adherent cells. P = 0.0014. C Primary murine CLL cells isolated from moribund mice were analyzed for migration capacity towards FBS or 200 ng/µl CXCL12 or control (serum free media) using a Boyden chamber. Each biological sample were measured in duplicate, each dot represents the mean of the duplicates. Migration index was calculated as the ratio of spontaneous migration to stimulated-migration. P (FBS) = 0.0111; p (CXCL12) = 0.02686. D MEC1 cells were transfected with lentiviral vectors either expressing non-target shRNA (shNT) or shRNA directed against NEDD9 (shNEDD9). Representative western blotting image is shown. E NEDD9 protein levels were quantified using lab image 1D software (Kaplan Bio-Imaging GmbH, Leipzig, Germany), normalization to mean β-actin. N = 4, p = 0.0286. Data are presented as mean ± SD. F MEC1 cells transfected with shNT (one single cell clone) and MEC1 cells transfected with shNEDD9 (two different single cell clones) were examined for migration capacity towards FBS, 200 ng/µl CXCL12 or control (serum free media) using a Boyden chamber. Migration index was calculated as the ratio of spontaneous migration (control, no stimulus) to directed migration (stimulated cells, FBS or CXCL12). p (FBS) = 0.0095; n (shNT) = 4; n (shNEDD9) = 6; p (CXCL12) = 0.0091; n (shNT) = 3; n (shNEDD9) = 9.
Fig. 5
Fig. 5. NEDD9 expression is associated with adhesion and migration signatures in CLL cells and frequently accentuated in proliferation centers of the CLL lymph nodes.
A B lymphocytes were isolated from PBMC of 10 CLL patients (CLL B-cells) and 5 healthy control donors (HC B-cells). Phospho-NEDD9 and NEDD9 levels were analyzed by Western blotting. Phosphorylated Nedd9 was detected with an antibody specific for phosphorylated p130Cas [48] that detects phosphorylated NEDD9 between 100–115 kDa. B Western blot quantification of phospho-NEDD9 and NEDD9 levels between healthy controls and CLL samples. p (NEDD9/GAPDH) = 0.1292; p (pNEDD9/NEDD9) = 0.1645. C B lymphocytes were isolated from PBMC from CLL patients and healthy control (HC) donors and NEDD9 mRNA level were analyzed using real-time PCR. N ≥ 7, p = 0.5358. D, E Microarray analysis of NEDD9 expression levels of CD19-sorted primary CLL samples (n = 337) and association with genes involved in (D) focal adhesions and (E) migration. F Representative immunohistochemical stainings of NEDD9 of lymph node section from CLL patients. Magnification 8x and 40x.
Fig. 6
Fig. 6. Blocking effector molecules of the NEDD9 signaling network partially reduces migration capacity of CLL cells.
A Primary CLL cells from ten months old TCL1 and TCL1-N mice were examined for surface expression of indicated adhesion molecules by flow cytometry and plotted by percentage of CLL cells. N = 6; p (CXCR2) = 0.9452; p (CXCR4) = 0.2222; p (VLA-4) = 0.8048; p (CD44) > 0.999. B Primary CLL cells isolated from moribund TCL1 and TCL1-N mice were stimulated with 200 ng/µl CXCL12 for 15 min followed by western blot analysis and (C) quantitative analysis. D Primary CLL cells isolated from moribund TCL1 and TCL1-N mice were treated with 0.5 µM alisertib, 0.5 µM panobinostat or a combination of both and examined for migration capacity towards 200 ng/µl CXCL12 using a Boyden chamber. For TCL1 cells, p (DMSO vs. alisertib) = 0.0781; p (DMSO vs. panobinostat) = 0.0312; p (DMSO vs. combination) = 0.0156. For TCL1-N cells, p (DMSO vs. alisertib) = 0.8125; p (DMSO vs. panobinostat) = 0.0625; p (DMSO vs. combination) = 0.0625. Statistics by Wilcoxon matched pairs test. E Patient-derived primary CLL cells were treated with 0.5 µM alisertib (n = 30), 0.5 µM panobinostat (n = 28) or a combination of both (n = 22) and examined for migration capacity towards 200 ng/µl CXCL12 using a Boyden chamber. P (DMSO vs. alisertib) = 0.00234; p (DMSO vs. panobinostat) = 0.0024; p (DMSO vs. combination) = 0.0002, p (alisertib vs. combination = 0.0023), p (panobinostat vs. combination) = 0.4749. Statistics by Wilcoxon matched pairs test. F Schematic representation of proposed NEDD9-dependent signaling axis.

Similar articles

Cited by

References

    1. Hallek M. Chronic lymphocytic leukemia: 2020 update on diagnosis, risk stratification and treatment. Am J Hematol. 2019;11:1266–87. doi: 10.1002/ajh.25595. - DOI - PubMed
    1. Jain N, Keating M, Thompson P, Ferrajoli A, Burger J, Borthakur G, et al. Ibrutinib and venetoclax for first-line treatment of CLL. N. Engl J Med. 2019;380:2095–103. doi: 10.1056/NEJMoa1900574. - DOI - PMC - PubMed
    1. Fischer K, Al-Sawaf O, Bahlo J, Fink A-M, Tandon M, Dixon M, et al. Venetoclax and obinutuzumab in patients with CLL and coexisting conditions. N. Engl J Med. 2019;380:2225–36. doi: 10.1056/NEJMoa1815281. - DOI - PubMed
    1. Roberts AW, Davids MS, Pagel JM, Kahl BS, Puvvada SD, Gerecitano JF, et al. Targeting BCL2 with venetoclax in relapsed chronic lymphocytic leukemia. N. Engl J Med. 2016;374:311–22. doi: 10.1056/NEJMoa1513257. - DOI - PMC - PubMed
    1. Nguyen PH, Niesen E, Hallek M. New roles for B cell receptor associated kinases: when the B cell is not the target. Leukemia. 2019;33:576–87. doi: 10.1038/s41375-018-0366-8. - DOI - PubMed

Publication types

MeSH terms

Substances