. 2022 May 6;13(1):2514.
doi: 10.1038/s41467-022-30298-4.

Stable inheritance of H3.3-containing nucleosomes during mitotic cell divisions

Affiliations

Stable inheritance of H3.3-containing nucleosomes during mitotic cell divisions

Xiaowei Xu et al. Nat Commun. .

Erratum in

Abstract

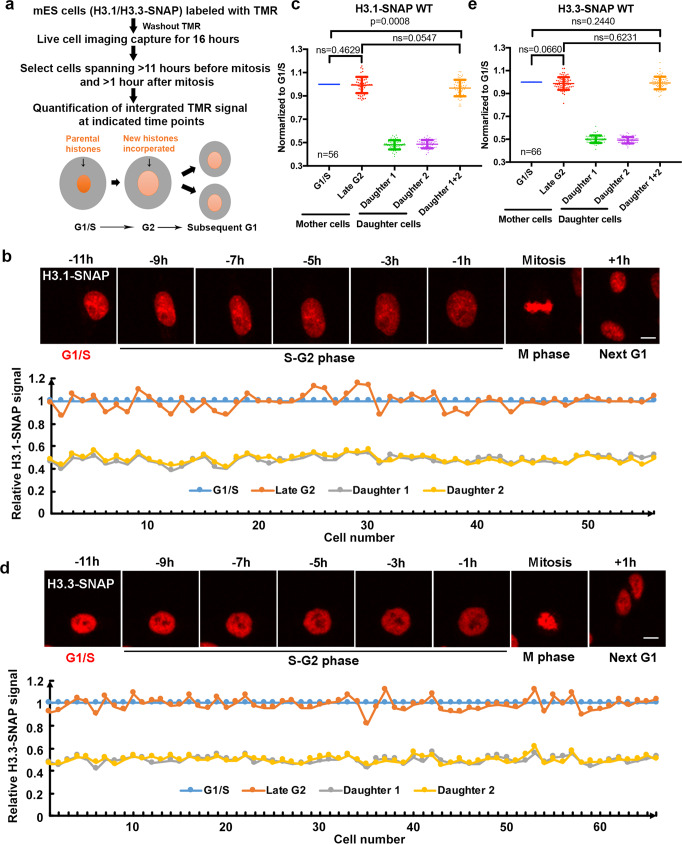
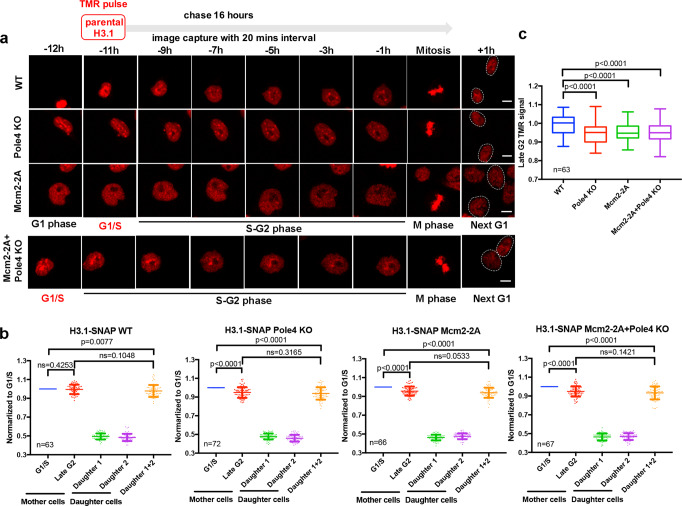
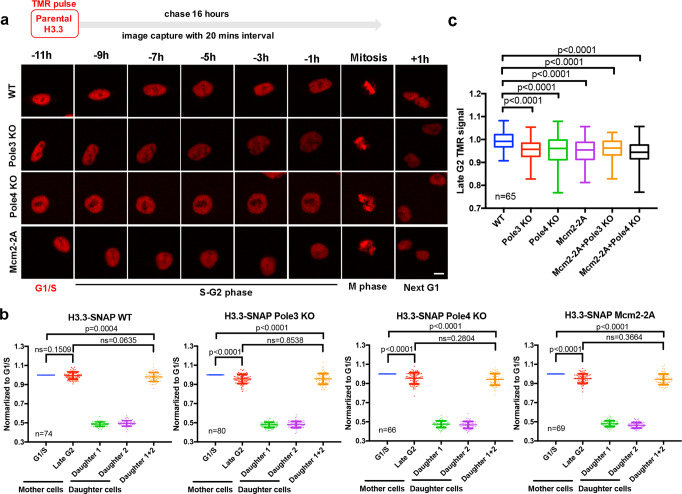
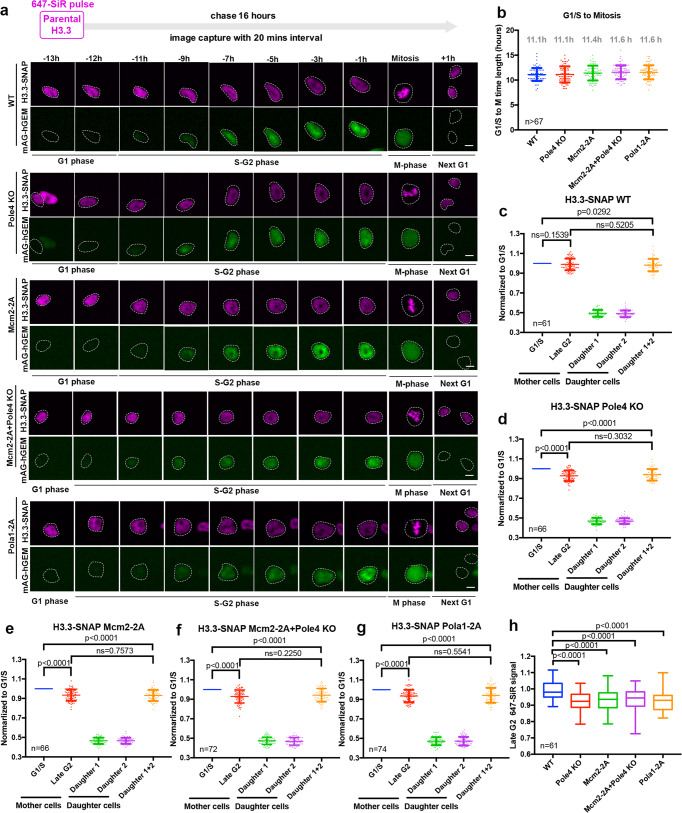
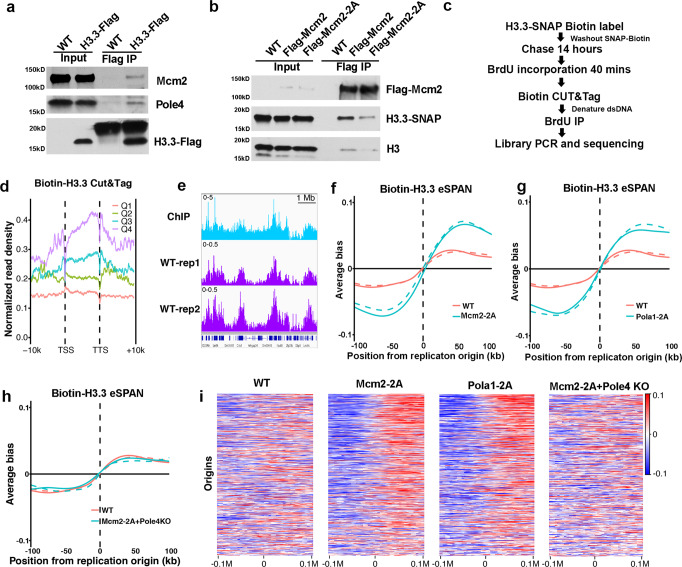
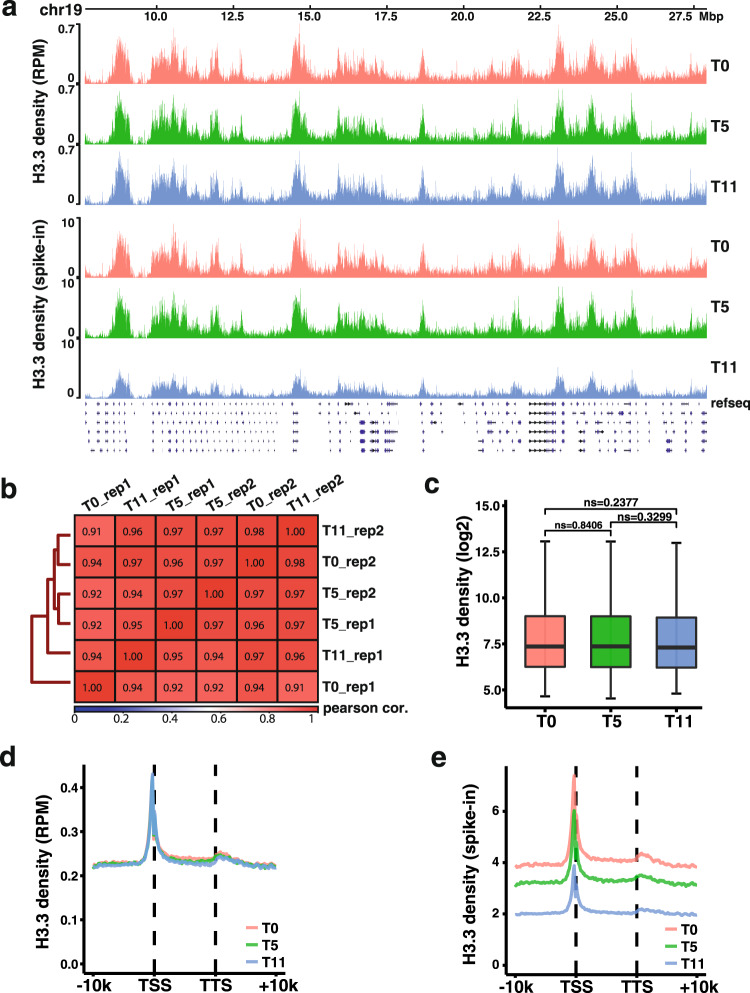
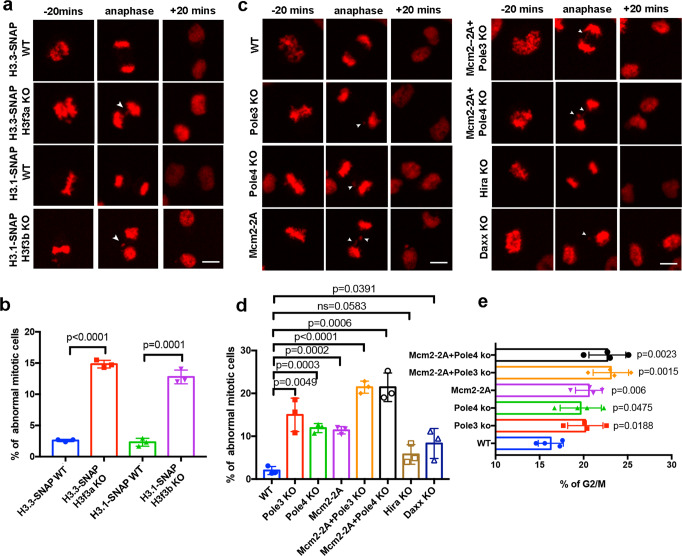
Newly synthesized H3.1 and H3.3 histones are assembled into nucleosomes by different histone chaperones in replication-coupled and replication-independent pathways, respectively. However, it is not clear how parental H3.3 molecules are transferred following DNA replication, especially when compared to H3.1. Here, by monitoring parental H3.1- and H3.3-SNAP signals, we show that parental H3.3, like H3.1, are stably transferred into daughter cells. Moreover, Mcm2-Pola1 and Pole3-Pole4, two pathways involved in parental histone transfer based upon the analysis of modifications on parental histones, participate in the transfer of both H3.1 and H3.3 following DNA replication. Lastly, we found that Mcm2, Pole3 and Pole4 mutants defective in parental histone transfer show defects in chromosome segregation. These results indicate that in contrast to deposition of newly synthesized H3.1 and H3.3, transfer of parental H3.1 and H3.3 is mediated by these shared mechanisms, which contributes to epigenetic memory of gene expression and maintenance of genome stability.


Conflict of interest statement

The authors declare no competing interests.

Figures

Fig. 1
Fig. 1. Parental H3.1 and H3.3 are faithfully recycled following one cell division.
a An outline of experimental procedures for the quantification of parental H3.1 and H3.3 during one cell division. H3.1-SNAP or H3.3-SNAP-tagged cells were labeled with TMR. After washing out TMR substrates, live-cell images were captured continuously for 16 h. Cells that showed TMR signals more than 11 h before mitosis (G1/S) and more than 1 h after mitosis (next G1) were chosen for analysis of the integrated intensity of H3.1-SNAP and H3.3-SNAP signals at G1, G2, and next G1. b Parental H3.1 are stably recycled following DNA replication and equally distributed to two daughter cells. Upper: representative live-cell images of TMR-labeled-parental H3.1 at the indicated time points in mES cells expressing H3.1-SNAP (n = 56). The number denotes time in hours in reference to mitosis. Scale bar, 10 µm. Lower: integrated TMR signals normalized to G1/S time point at three time points: G1/S, Late G2 and next G1 with two daughter cells. Relative TMR signals at G1/S, G2 in each individual cell and those in daughter 1 and 2 are shown. c Quantification of parental H3.1-SNAP signals at different phases of the cell cycle. Parental H3.1-SNAP fluorescence in each cell was measured in the entire nucleus at G1/S, G2, daughter cell 1 and 2 and normalized to that mother cell at G1/S. d Parental H3.3 are stably recycled following DNA replication and equally distributed to two daughter cells. Upper: representative live-cell images of parental H3.3 at the indicated time points in cells expressing H3.3-SNAP (n = 66). Scale bar, 10 µm. Lower: relative TMR signals at G1/S, G2 in each individual cell and those in daughter 1 and 2 are shown. e Quantification of parental H3.3 signals at different phases of the cell cycle. The experimental procedures mirror that described in (c). be n number of cells from two independent experiments. c, e Data are presented as means ± SD. Two-tailed unpaired Student t test were performed with the P values marked on the graphs (ns, no significant difference).
Fig. 2
Fig. 2. Histone chaperones Mcm2 and Pole4 are involved in the recycling of parental H3.1.
a Upper: an experimental scheme for the analysis of H3.1-SNAP in mES cells using live-cell imaging. Lower: representative live-cell images of TMR of parental histone H3.1-SNAP at the indicated time points in WT (n = 63), Pole4 KO (n = 72), Mcm2-2A (n = 66) and Pole4 KO + Mcm2-2A double mutant (n = 67) mES cells. Scale bar, 10 µm. Two daughter cells arising from the mother cell were circled. b Quantification of parental H3.1-SNAP signals WT, Pole4 KO, Mcm2-2A and Mcm2-2A + Pole4 KO mES cells at G1/S and G2 of each mother cell and G1 of the two individual daughter cells. Data are presented as means ± SD. c Boxplot of relative parental H3.1-SNAP signals at G2 calculated in (b) among WT, Pole4 KO, Mcm2-2A and Mcm2-2A + Pole4 KO mES cell lines. The center line is the medians of all data points, with the limits corresponding to the upper and the lower quartiles, respectively, and the whiskers representing the largest and smallest values. ac n number of cells from two independent experiments. b, c Statistical analysis was performed by two-tailed unpaired Student t test with P values shown on the graphs. ns no significant difference.
Fig. 3
Fig. 3. Mcm2, Pole3, and Pole4 are required for faithfully parental histone H3.3 recycling during S phase.
a Representative live-cell images of parental histones H3.3-SNAP signals at the indicated time points in WT (n = 74), Pole3 KO (n = 80), Pole4 KO (n = 66), and Mcm2-2A (n = 69) mES single mutant cell lines. Scale bar, 10 µm. b Quantification of H3.3-SNAP signals at each individual cell of WT, Pole3 KO, Pole4 KO, and Mcm2-2A single mutant mES cells. Data are presented as means ± SD. c Comparison of the relative amount of parental H3.3-SNAP at individual cells at late G2 in WT, Pole3 KO, Pole4 KO, Mcm2-2A, Mcm2-2A + Pole3 KO, and Mcm2-2A + Pole4 KO mES cell lines. The center line, the box limits and the whiskers are defined as described in Fig. 2c. ac n number of cells from two independent experiments. b, c Two-tailed unpaired Student t tests were performed with the P values marked on the graphs, and ns no significant difference.
Fig. 4
Fig. 4. Pola1 facilitates parental histone H3.3 recycling.
a Representative live-cell images of parental histones H3.3-SNAP signals at the indicated time points in WT (n = 61), Pole4 KO (n = 66), Mcm2-2A (n = 66), Pola1-2A (n = 74) mES single and Mcm2-2A Pole4 KO double mutant (n = 72) cell lines. Purple channels are 647-SiR labeled-parental H3.3-SNAP, green channels are for mAG tagged-geminin expression. Scale bar, 10 µm. Tracked cells were circled. b The average time from G1/S to mitosis for WT, Pole4 KO, Mcm2-2A, Pola1-2A, and Mcm2-2A Pole4 KO double mutant mES cell lines based on the appearance of mAG tagged-geminin (G1/S) and the reduction of mAG tagged-geminin signals (mitosis). cg Quantification of H3.3-SNAP signals at G1/S and G2 of each mother cell and G1 of its two daughter cells in WT, Pole4 KO, Mcm2-2A, Pola1-2A, and Mcm2-2A + Pole4 KO mutant mES cell lines. The cell cycle stage of each cell was based on mAG tagged-geminin signals. h Comparison of the relative amount of parental H3.3-SNAP at individual cells at late G2 in WT, Pole4 KO, Mcm2-2A, Pola1-2A and Mcm2-2A + Pole4 KO mES cell lines. The center line, the box limits and the whiskers were defined as described in Fig. 2c. bg Data are presented as means ± SD. ah n number of cells from two independent experiments. ch Statistical analysis was performed by two-tailed unpaired Student t test with the P values marked on the graphs, ns no significant difference.
Fig. 5
Fig. 5. Mcm2 and Pole4 interact with H3.3 and facilitate parental H3.3 transfer to different replicating DNA strands.
a Both Mcm2 and Pole4 interact with H3.3 in vivo. WT or H3.3-Flag-tagged mES cells were collected for immunoprecipitation using anti-Flag antibodies. Proteins in the input extracts and IP samples were analyzed by Western blotting using Flag, Mcm2 and Pole4 antibodies. One representative result from three independent replicates was shown. b Mcm2-2A mutation reduces the Mcm2-H3.3 interaction. Cell extracts from WT, Mcm2-Flag, Mcm2-2A-Flag mouse cells containing H3.3-SNAP were used for immunoprecipitation using anti-Flag antibodies. Proteins in the input and IP samples were analyzed by Western blot using Flag, SNAP and H3 antibodies. One representative results from three independent replicates was shown. c An outline of the experimental procedures to analyze the distribution of parental H3.3-SNAP at replicating DNA using eSPAN. d Parental H3.3-SNAP CUT&Tag density at TSS and TTS at genes with different expression. Genes were separated into 4 groups based on their expression in mouse ES cells (Q1 = lowest, Q4 = highest). H3.3-SNAP CUT&Tag density was calculated for each group. e Snapshots of H3.3 ChIP-Seq (GSM2080326) and two repeats of H3.3-SNAP CUT&Tag density at selected region (chr5:99,655,789–106,254,109) in wild-type cells. The signals represent the normalized read count per million reads for each of the three indicated setting. f The average bias of parental H3.3-eSPAN peaks at 1548 replication origins in WT and Mcm2-2A mES cells. The eSPAN bias at each origin was calculated using the formula (W − C)/(W + C); W and C: sequence reads of the Watson strand and Crick strand, respectively. Two repeats are shown. g, h The average bias of parental H3.3-eSPAN peaks at 1548 replication origins in WT and Pola1-2A mES cells (g) as well as WT and Mcm2-2A Pole4 KO double mutant mES cells (h). Two repeats are shown. i Heatmaps of parental H3.3-SNAP eSPAN bias in WT, Mcm2-2A, Pola1-2A and Mcm2-2A + Pole4 KO mouse ES cells at each of the 1548 initiation zones, ranked from the most efficient (top) to the least efficient (bottom) ones based on OK-seq bias.
Fig. 6
Fig. 6. Parental H3.3 proteins are likely recycled at chromatin regions locally.
a Snapshot of Parental H3.3-SNAP CUT&RUN density at chromosome 19 (Chr19) at different three time points, 0 h (T0), 5 h (T5), and 11 h (T11) after release into fresh media without SNAP-biotin substrate in WT mouse ES cells. Reads were normalized either against total mapped reads at each time (top panels) or DNA from spike-in human HeLa cells at each time point (lower panels). b Pairwise Pearson correlation matrix of two biological replicates of parental H3.3-SNAP CUT&RUN signals at each time point across the whole genome using a 50 kb window. c The average of parental H3.3-SNAP CUT&RUN density at different time points (T0, T5, and T11) on chromatin regions enriched with H3.3 after normalizing to total mapped reads at each time point. Average of two biological replicates is shown. n = 2461 chromatin regions were analyzed for each time points. The center line, the box limits and the whiskers are defined as in Fig. 2c. Statistical analysis was performed by two-tailed unpaired Student t test. The P values are marked on the graphs (ns, no significant difference). d The average of H3.3-SNAP CUT&RUN density of each time point (T0, T5, and T11) at the TSS and TTS of 5271 genes localized at replicated chromatin regions after normalized with total mapped reads. Average of two biological replicates is shown. e H3.3-SNAP CUT&RUN density of each time point (T0, T5, and T11) at the TSS and TTS of 5271 genes localized at replicating chromatin when normalized against DNA from spike-in HeLa cells. The average of two biological replicates is shown.
Fig. 7
Fig. 7. Mcm2-2A, Pole3 KO, and Pole4 KO mutants defective in parental histone transfer show abnormal chromosome segregation.
a Deletion of either H3f3a or H3f3b results in defects in mitosis. Representative live-cell images of H3.1/H3.3-SNAP at the indicated time points (20 min before (−) and after (+) anaphase) in WT, H3f3a KO and H3f3b KO mES cells (n > 160). Nuclear abnormalities marked by arrows including chromosome bridges, misaligned chromosomes and lagging chromosomes observed in anaphase was counted in H3f3a KO/H3f3b KO mES cells. Scale bar, 10 µm. b Percentages of abnormal mitotic cells in WT, H3f3a KO and H3f3b KO mES cells. Images at anaphase were used for quantification. c Representative live-cell images of H3.3-SNAP signals collected at indicated time (20 min before (−) and after (+) anaphase) in WT, Pole3 KO, Pole4 KO, Mcm2-2A, Mcm2-2A + Pole3 KO, Mcm2-2A + Pole4 KO, Hira KO, and Daxx KO mES cells (n > 170). The nuclear abnormalities mentioned in (a) were observed in Pole3 KO, Pole4 KO, Mcm2-2A, Mcm2-2A + Pole3 KO, Mcm2-2A + Pole4 KO, and Daxx KO mES cells. Defects are indicated by arrows. Scale bar, 10 µm. d Percentages of abnormal mitotic cells in WT, Pole3 KO, Pole4 KO, Mcm2-2A, Mcm2-2A + Pole3 KO, Mcm2-2A + Pole4 KO, Hira KO, and Daxx KO cell lines. Images at anaphase were used for quantification. b, d Data are presented as means ± SD. Statistical analysis was performed by two-tailed unpaired Student t test with the P values shown on the graphs (ns, no significant difference). ad n > 160 cells from three independent experiments were analyzed. e The percentage of G2/M phase cells increases in WT, Pole3 KO, Pole4 KO, Mcm2-2A, single, Mcm2-2A + Pole3 KO, and Mcm2-2A Pole4 KO double mutant cell lines. Cells were collected for flow cytometry analysis of DNA content, and the percentage of cells at G2/M was calculated. Data are presented as means ± SD. Statistical analysis was performed by two-tailed unpaired Student t test, and the P values were marked on the graphs (ns no significant difference). Four independent replicates were conducted for each cell line.

Similar articles

Cited by

References

    1. Luger K, Mader AW, Richmond RK, Sargent DF, Richmond TJ. Crystal structure of the nucleosome core particle at 2.8 angstrom resolution. Nature. 1997;389:251–260. - PubMed
    1. Burgess RJ, Zhang ZG. Histone chaperones in nucleosome assembly and human disease. Nat. Struct. Mol. Biol. 2013;20:14–22. - PMC - PubMed
    1. Guenther MG, Levine SS, Boyer LA, Jaenisch R, Young RA. A chromatin landmark and transcription initiation at most promoters in human cells. Cell. 2007;130:77–88. - PMC - PubMed
    1. Nakayam J, Rice JC, Strahl BD, Allis CD, Grewal SIS. Role of histone H3 lysine 9 methylation in epigenetic control of heterochromatin assembly. Science. 2001;292:110–113. - PubMed
    1. Peters AHFM, et al. Histone H3 lysine 9 methylation is an epigenetic imprint of facultative heterochromatin. Nat. Genet. 2002;30:77–80. - PubMed

Publication types

MeSH terms