. 2022 May;23(5):731-742.
doi: 10.1038/s41590-022-01187-1. Epub 2022 Apr 29.

Reversal of the T cell immune system reveals the molecular basis for T cell lineage fate determination in the thymus

Affiliations

Reversal of the T cell immune system reveals the molecular basis for T cell lineage fate determination in the thymus

Miho Shinzawa et al. Nat Immunol. 2022 May.

Abstract

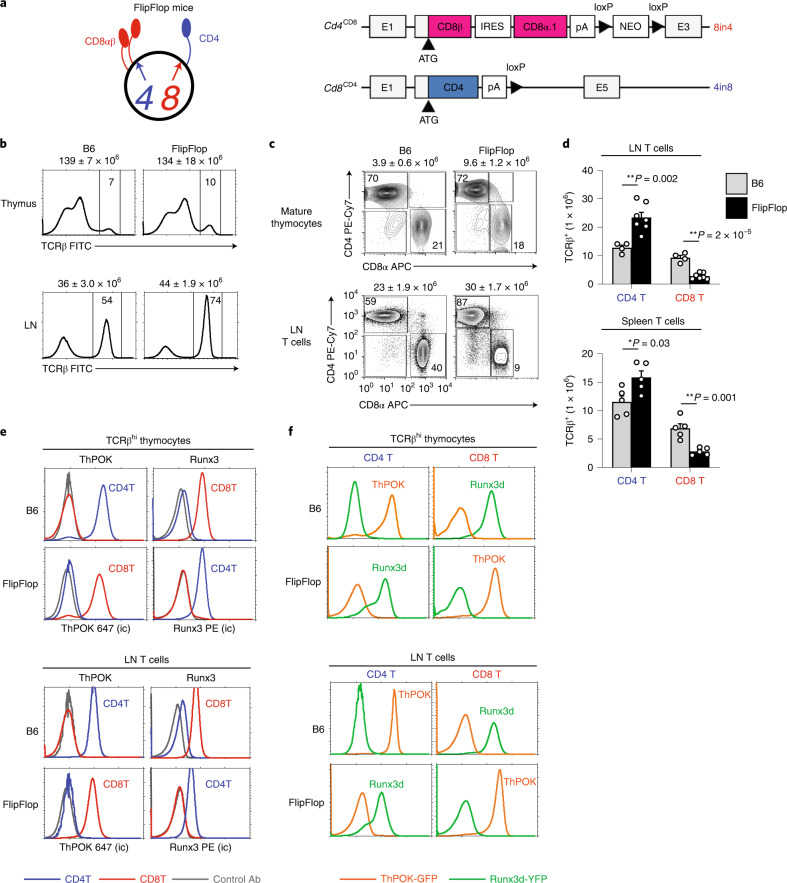
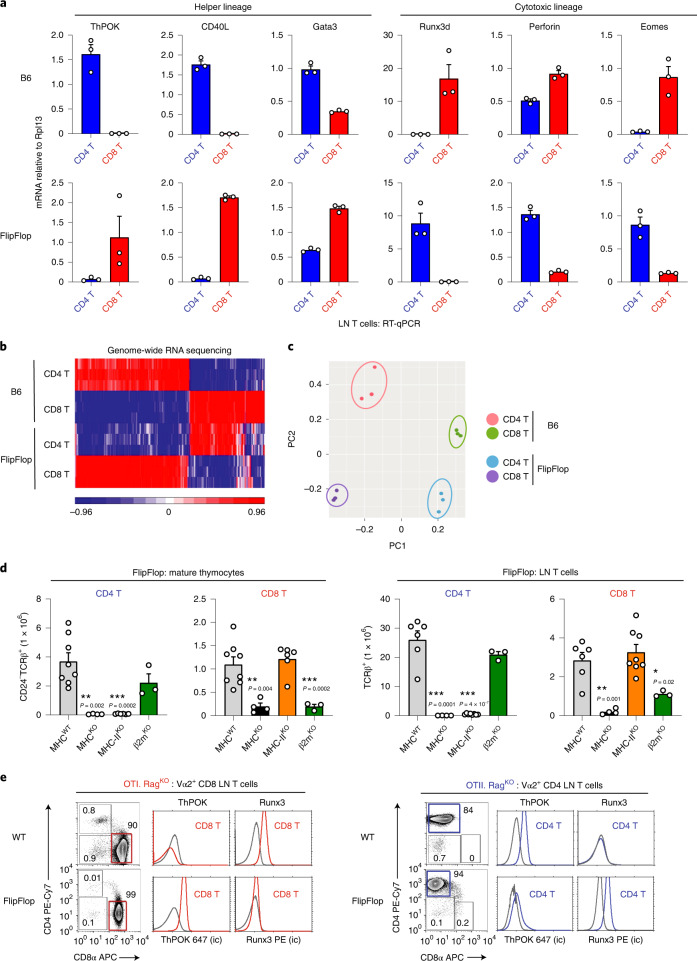
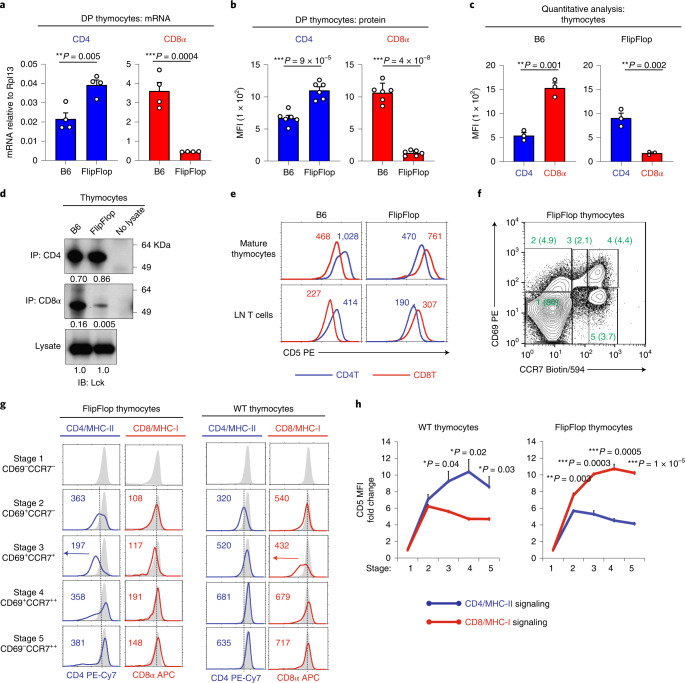
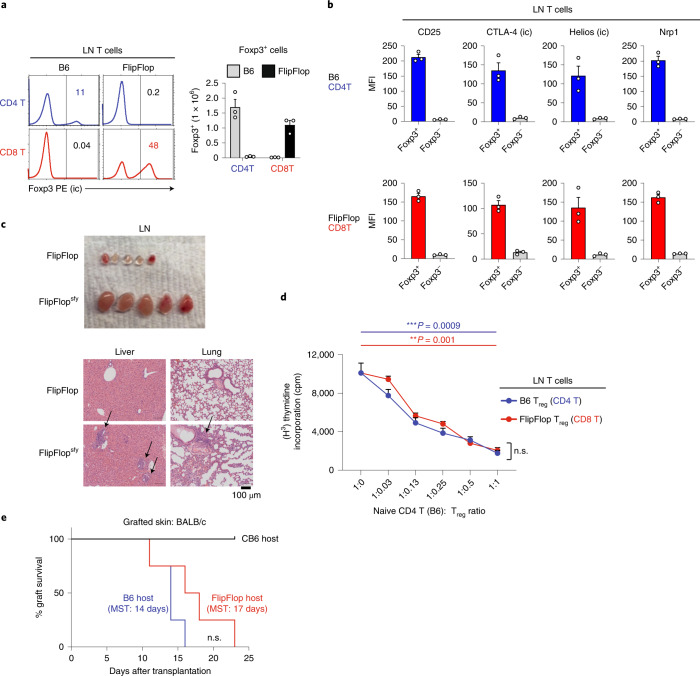
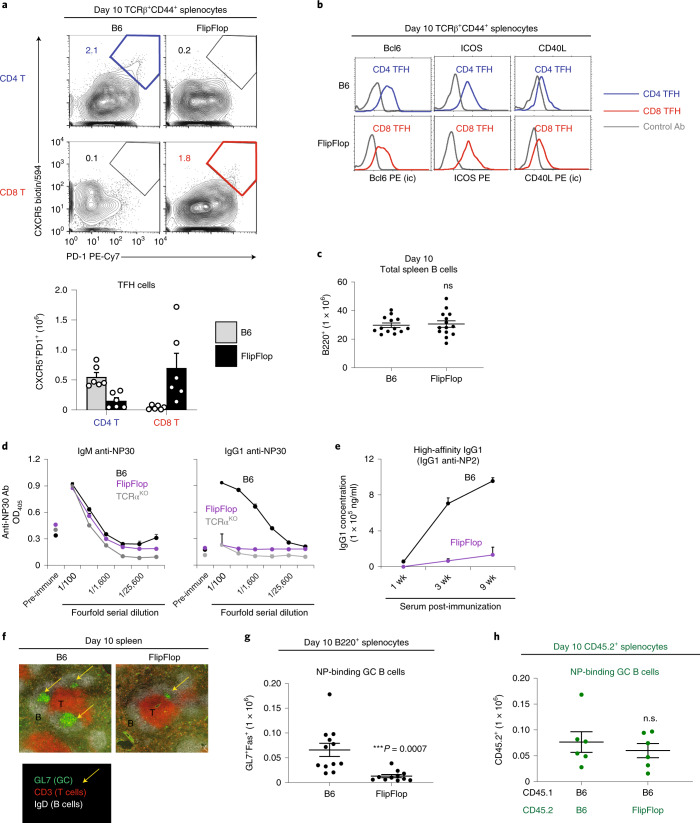
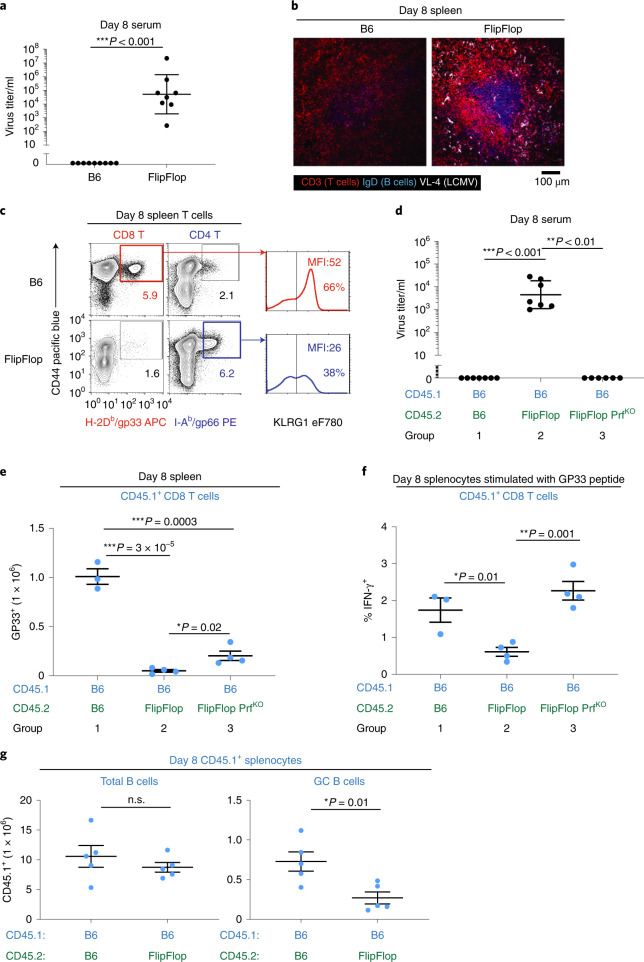
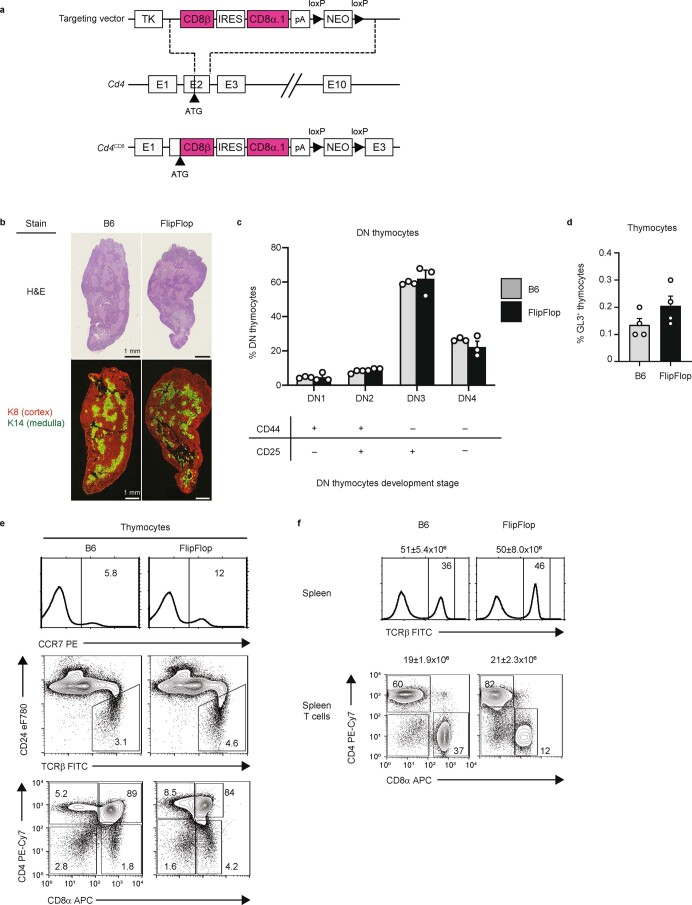
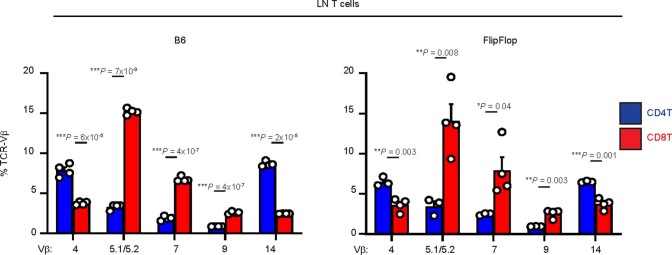
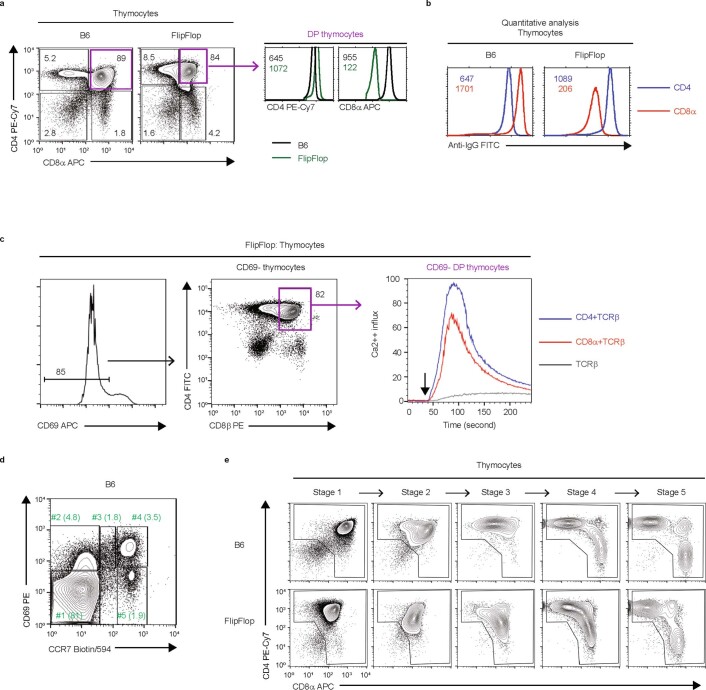
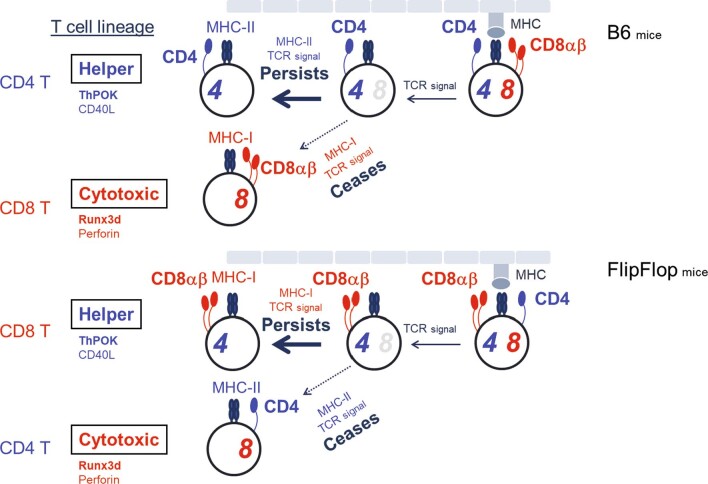
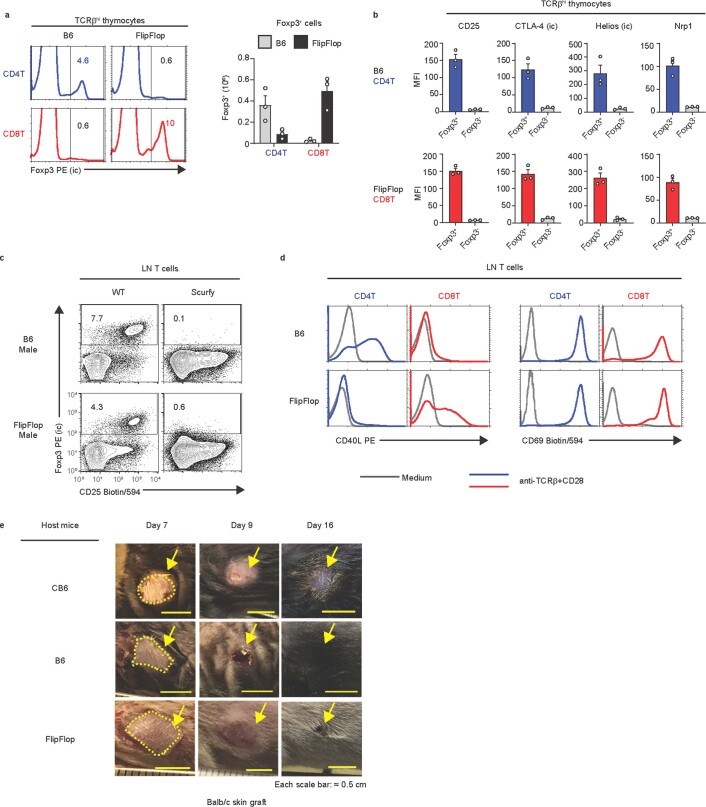
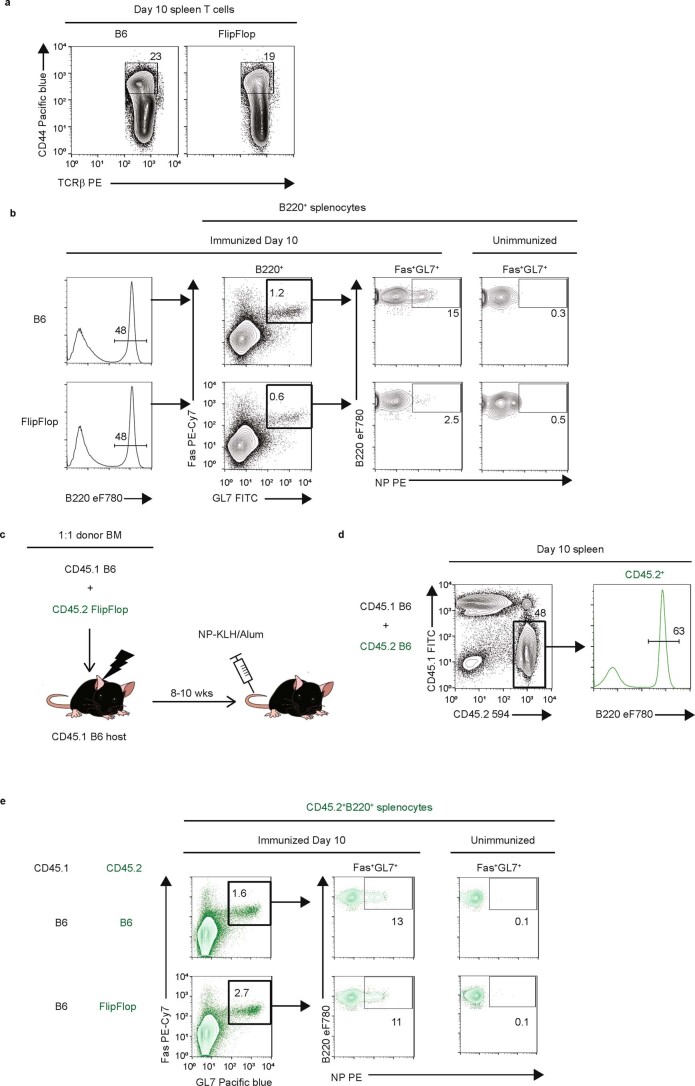
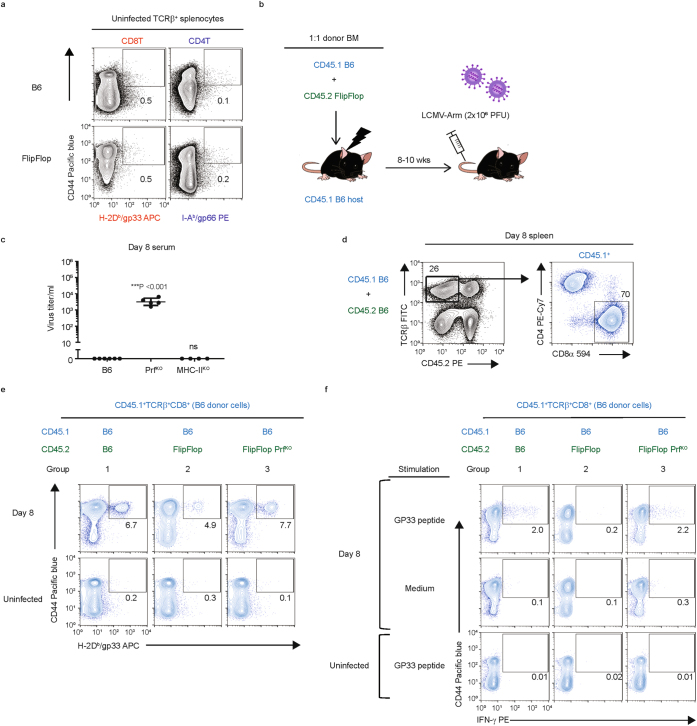
T cell specificity and function are linked during development, as MHC-II-specific TCR signals generate CD4 helper T cells and MHC-I-specific TCR signals generate CD8 cytotoxic T cells, but the basis remains uncertain. We now report that switching coreceptor proteins encoded by Cd4 and Cd8 gene loci functionally reverses the T cell immune system, generating CD4 cytotoxic and CD8 helper T cells. Such functional reversal reveals that coreceptor proteins promote the helper-lineage fate when encoded by Cd4, but promote the cytotoxic-lineage fate when encoded in Cd8-regardless of the coreceptor proteins each locus encodes. Thus, T cell lineage fate is determined by cis-regulatory elements in coreceptor gene loci and is not determined by the coreceptor proteins they encode, invalidating coreceptor signal strength as the basis of lineage fate determination. Moreover, we consider that evolution selected the particular coreceptor proteins that Cd4 and Cd8 gene loci encode to avoid generating functionally reversed T cells because they fail to promote protective immunity against environmental pathogens.


Conflict of interest statement

The authors declare no competing interests.

Figures

Fig. 1
Fig. 1. Characterization of FlipFlop mice.
a, Schematic of altered Cd4 and Cd8α gene loci in FlipFlop mice. Left, surface proteins encoded by altered Cd4CD8 (4) and Cd8CD4 (8) gene loci in FlipFlop DP thymocytes. Right, schematic of the altered Cd4CD8 and Cd8CD4 gene loci in FlipFlop mice: E, exons; IRES, internal ribosome entry site; pA, polyadenylation signals; NEO, neomycin-resistance cassette. The altered Cd4CD8 gene locus was obtained from 8in4 mice, which were constructed for this study as described in Extended Data Fig. 1a; the altered Cd8CD4 gene locus was obtained from 4in8 mice, which were reported previously. b, TCRβ expression in the thymus and LN from B6 and FlipFlop mice. Total cell number (mean ± s.e.m) is shown above histograms, and numbers within histograms indicate frequency of TCRβhi cells (n = 4–7 per strain, representative of 4–7 independent experiments). c, CD4 versus CD8α profile of CD24-TCRβ+ mature thymocytes and TCRβ+ LN T cells from B6 and FlipFlop mice. Numbers (mean ± s.e.m) of mature thymocytes and LN T cells is shown above profiles and numbers within profiles indicate frequency of cells in each box (n = 4–7 per strain, representative of 4–7 independent experiments). d, Numbers of CD4 and CD8 T cells in LN (top) and spleen (bottom) from B6 (gray bar) and FlipFlop (black bar) mice (B6: n = 4, FlipFlop: n = 7, representative of 4–5 independent experiments). *P < 0.05, **P < 0.01 (two-tailed unpaired t-test); mean + s.e.m. e, Intracellular staining (ic) of ThPOK and Runx3 of CD4 (blue line) and CD8 (red line) T cells among TCRβhi thymocytes (top) and TCRβ+ LN T cells (bottom) from B6 and FlipFlop mice. Gray lines in histograms indicate staining with control antibody (Ab; n = 3 per strain, 3 independent experiments). f, ThPOK-GFP (orange line) and Runx3d-YFP (green line) reporter expression in CD4 and CD8 T cells among TCRβhi thymocytes (top) and TCRβ+ LN T cells (bottom) from B6 and FlipFlop mice (n = 3 per strain, representative of 3 independent experiments).
Fig. 2
Fig. 2. Reversed lineage fate of FlipFlop T cells.
a, RT–qPCR analysis of CD4 (blue bar) and CD8 (red bar) TCRβ+ LN T cells from B6 and FlipFlop mice. Results are normalized to the control gene Rpl13 (n = 4 per strain, representative of 3 independent experiments with technical triplicates). b, RNA-sequencing analysis of CD4 and CD8 LN T cells from B6 and FlipFlop mice; 335 genes that are differentially expressed between B6 CD4 and CD8 LN T cells were evaluated in the heat map for expression in FlipFlop LN T cells (n = 3 per group, P < 0.0001, fivefold change). c, Principal component analysis (PCA) from RNA-sequencing analysis in b. d, Numbers of CD4 and CD8 T cells among CD24TCRβ+ mature FlipFlop thymocytes and TCRβ+ FlipFlop LN T cells in mice with the indicated MHC deficiencies. (WT: thymocytes n = 8, LN T cells n = 6, MHCKO: n = 4, MHC-IIKO: n = 8, β2mKO: n = 3, 3–9 independent experiments). *P < 0.05, **P < 0.01, ***P < 0.001 (two-tailed unpaired t-test). Mean + s.e.m. e, CD4 versus CD8α profiles and intracellular staining (ic) of ThPOK and Runx3 of Vα2+ LN T cells from RagKO WT and RagKO FlipFlop mice expressing monoclonal OT-I (left) and OT-II (right) transgenic TCR. Gray lines in histograms indicate staining with control antibody. Numbers within profiles indicate frequency of cells in each box (n = 3–6/strain, representative of 2–4 independent experiments).
Fig. 3
Fig. 3. Coreceptor expression on thymocytes undergoing positive selection.
a, RT–qPCR analysis of CD4 and CD8α mRNAs of pre-selection (CD69CCR7) DP thymocytes (n = 4 per strain, representative of 2 independent experiments with technical triplicates). b, Mean fluorescence intensity (MFI) of CD4 and CD8α on DP thymocytes. Staining histograms are shown in Extended Data Fig. 3a (n = 6 per strain, 6 independent experiments). c, Quantitative analysis of CD4 and CD8α on B6 and FlipFlop thymocytes. Thymocytes were stained to saturation with either rat anti-mouse CD4 or rat anti-mouse CD8α unconjugated IgG monoclonal antibodies and then were secondarily stained with anti-rat IgG FITC-conjugated antibody. Staining histograms are shown in Extended Data Fig. 3b (n = 3 per strain, 3 independent experiments). d, Quantitation of Lck bound to CD4 and CD8α proteins on thymocytes. Thymocyte lysates were immunoprecipitated with anti-CD4 or anti-CD8α antibodies and immunoblotted using anti-Lck antibody. Intensity of Lck bands was normalized to whole lysate, which was set equal to 1.0 (representative of 4 independent experiments). e, CD5 expression on CD4 T cells (blue line) and CD8 T cells (red line) among CD24TCRβ+ mature thymocytes and TCRβ+ LN T cells (n = 5 per strain, representative of 5 independent experiments). Numbers in histograms show MFI. f, Development of TCR-signaled FlipFlop thymocytes. CD69 versus CCR7 profile identifies five sequential stages (1–5) of positive selection, with TCR-unsignaled cells being stage 1 and TCR-signaled cells developing sequentially into stages 2–5. Numbers in parentheses show frequency of cells at each stage. g, Coreceptor kinetics during positive selection. FlipFlop thymocytes (left) and WT thymocytes (right) were assessed for surface CD4 expression during MHC-II selection in β2mKO mice and for surface CD8α expression during MHC-I selection in MHC-IIKO mice. Numbers in histograms show MFI. Gray histograms show coreceptor expression on TCR-unsignaled stage 1 thymocytes. Vertical lines mark coreceptor expression levels on TCR-signaled stage 2 thymocytes. (f,g; n = 3−5 per strain, 3–4 independent experiments). h, Kinetics of CD5 expression on WT and FlipFlop thymocytes during positive selection. CD5 MFI was normalized to stage 1 thymocytes, which were set as 1.0 (n = 3 per strain, 2 independent experiments). *P < 0.05, **P < 0.01, ***P < 0.001 (two-tailed unpaired t-test); mean ± s.e.m. (ac and h). Source data
Fig. 4
Fig. 4. Immunocompetence and self-tolerance in FlipFlop mice.
a, Intracellular staining for Foxp3 in TCRβ+ LN T cells from B6 and FlipFlop mice (left). Numbers in histograms indicate frequency of cells in that box. Numbers (mean ± s.e.m.) of Foxp3+ cells among CD4 and CD8 LN T cells in B6 (gray bar) and FlipFlop (black bar) mice are shown in bar graphs (right). (n = 5 per strain, representative of 5 independent experiments). b, Expression of Treg proteins on Treg cells (Foxp3+) and non-Treg cells (Foxp3) among B6 CD4 or FlipFlop CD8 TCRβ+ LN T cells (n = 5 per strain, representative of 5 independent experiments); mean ± s.e.m. c, LNs (top) and H&E stain of tissue sections (bottom) from FlipFlop and FlipFlopsfy male mice (4 weeks old). Arrows indicate regions of lymphocytic cell infiltration (n = 4 per strain, representative of 4 independent experiments). d, In vitro Treg suppression assay. Purified naive CD4 TCRβ+ LN T cells from B6 mice were stimulated in vitro for 3 days with immobilized anti-CD3ε monoclonal antibodies and titrated doses of either B6 CD4 Treg (CD4+Foxp3-GFP+) or FlipFlop CD8 Treg (CD8+Foxp3-GFP+) cells sorted from LNs. After 3 days, cultures were assessed for [H3]thymidine incorporation (mean ± s.e.m.). Data are representative of three independent experiments. **P < 0.01, ***P < 0.001 (two-tailed unpaired t-test); mean + s.e.m. e, Skin allograft rejection. Tail skins from BALB/c mice were grafted onto the flanks of indicated host mice. Graph indicates graft survival over time on B6 (blue line, n = 8), FlipFlop (red line, n = 9), and CB6 (black line, n = 4) host mice (log-rank (Mantel–Cox) test, P = 0.15 between B6 and FlipFlop host mice, 3 independent experiments). Median survival times (MSTs) on B6 and FlipFlop mice were 14 and 17 days, respectively. n.s., not significant.
Fig. 5
Fig. 5. Humoral immune responses in FlipFlop mice.
Mice were immunized with NP-KLH/alum by i.p. injection and analyzed. a, TFH cells in immunized B6 and FlipFlop mice (day 10). Numbers indicate percentage of CXCR5+PD1+ TFH cells (top). Bar graph shows TFH (CXCR5+PD1+) cell numbers (mean ± s.e.m.) among TCRβ+CD44+ (bottom). (n = 6, representative of 3 independent experiments). Gate for TCRβ+CD44+ T cells is shown in Extended Data Fig. 6a. b, Characterization of TFH cells. TFH cells (TCRβ+CD44+CXCR5+PD1+) in FlipFlop and B6 spleens were analyzed on post-immunization day 10 (n = 4 per strain, representative of 2–3 independent experiments). c, Numbers of B220+ B cells in immunized B6 and FlipFlop spleens (day 10) (B6: n = 13, FlipFlop: n = 14, 7 independent experiments). Staining profile is shown in Extended Data Fig. 6b. d, Circulating IgM and IgG1 anti-NP30 antibodies (optical density (OD) at 405 nm) in serum from B6 (black line), FlipFlop (purple line), and TCRαKO (gray line) mice at 1 week post-immunization, measured by ELISA. Pre-immunization serum was included as a negative control (B6 and FlipFlop: n = 4, TCRαKO: n = 3, 3 independent experiments); mean ± s.e.m. e, High-affinity IgG1 production. Concentration of IgG1 anti-NP2 antibody (ng/ml) in serum over time after immunization, as measured by ELISA (n = 3–4/strain, 3 independent experiments); mean ± s.e.m. f, Immunofluorescence staining of spleen sections from immunized B6 and FlipFlop mice (day 10). Staining of GL7 (green and yellow arrow, GC), CD3 (red, T cells), and IgD (white, B cells) is shown (n = 3 per strain, representative of 3 independent experiments). g, Numbers of NP-binding GC B cells (NP+B220+GL7+Fas+) in the spleens of immunized B6 and FlipFlop mice (day 10). Staining profile of immunized splenocytes is shown in Extended Data Fig. 6b (B6: n = 12, FlipFlop: n = 13, 6–7 independent experiments). h, Induction of NP-binding GC B cell induction in mixed BM chimeras from Extended Data Fig. 6c. Mixed BM chimeras reconstituted with both B6 and FlipFlop BM cells were immunized with NP-KLH/alum and were assessed 10 days later for numbers of B6-origin and FlipFlop-origin NP-binding GC B cells. Staining profile and gate are shown in Extended Data Fig. 6d,e (n = 6 per strain, 2 independent experiments). *P < 0.05, **P < 0.01, ***P < 0.001 (two-tailed unpaired t-test); mean ± s.e.m. (c,g,h).
Fig. 6
Fig. 6. Immune responses to virus infection.
Mice were infected with LCMV-Arm (2 × 106 PFU/mouse) by i.v. injection and analyzed on day 8. a, Circulating virus titer (FFU: focus forming unit/ml, geometric mean ± s.d.) in the serum on day 8. (B6: n = 9, FlipFlop: n = 8, 4 independent experiments). b, Immunofluorescence staining of spleens on day 8 after infection. Staining with monoclonal antibodies specific for CD3 (red, T cells), IgD (blue, B cells), and VL-4 (white, LCMV) (n = 3 per strain, representative of 2 independent experiments). c, Virus-specific T cells in B6 and FlipFlop spleens were identified by H-2Db/GP33 and I-Ab/GP66 viral tetramers and contained KLRG1+ cells (right) (n = 3 per strain, representative of 3 independent experiments). d, Virus-infected mixed BM chimeras. Circulating virus titers (FFU/ml, geometric mean ± s.d.) on day 8 after virus infection in the serum of mixed BM chimeras that were generated as in Extended Data Fig. 7b (B6: n = 7, FlipFlop: n = 7, FlipFlop PrfKO: n = 6, 2 independent experiments). e, FlipFlop cytotoxic T cells prevent in vivo expansion of virus-specific B6 T cells. Graph indicates numbers of B6-origin H-2Db/GP33-specific CD8 T cells (CD45.1) in spleens of mixed BM chimeras (day 8). Staining profiles and gate are shown in Extended Data Fig. 7d,e (group 1: n = 3, group 2: n = 4, group 3: n = 4, 2 independent experiments). f, In vivo FlipFlop cytotoxic T cells prevent in vitro activation of virus-specific B6 CD8 T cells. In vitro GP33 peptide stimulation of splenocytes from infected mixed BM chimeras (day 8) were assessed for IFNγ+ induction of B6-origin CD8 T cells (CD45.1). Staining profiles are shown in Extended Data Fig. 7f (group 1: n = 3, group 2: n = 4, group 3: n = 4, 2 independent experiments). g, Impact of FlipFlop T cells on numbers of B cells and GC B cells in the spleen from infected mixed BM chimeras. Spleens from infected mixed BM chimeras (day 8) were assessed for numbers of CD45.1 B6-origin B cells (B220+; left) and GC B cells (GL7+FAS+; right) (n = 5/group, 2 independent experiments). *P < 0.05, **P < 0.01, ***P < 0.001 (Mann–Whitney two-tailed unpaired test for a and d, two-tailed unpaired t-test for eg); mean ± s.e.m. (eg).
Extended Data Fig. 1
Extended Data Fig. 1. Effect of altered Cd4 and Cd8 gene loci on T cell development.
(a) Alteration of the endogenous Cd4 gene locus to encode CD8αβ proteins (Cd4CD8). A targeting vector that consists of a TK cassette, CD8β cDNA, IRES, CD8α.1 cDNA, poly A sequence, and a NEO-resistance cassette flanked by directional loxP sites (top) was homologously recombined into the translation start site in exon 2 of the Cd4 gene (middle), generating novel mice known as ‘8in4’. Note that the re-engineered Cd4CD8 gene locus encodes CD8αβ.1 proteins (bottom). (b) H&E staining (top) and immunofluorescence staining (bottom) of thymic sections from B6 and FlipFlop mice. Staining of Keratin-8 (K8, red, cortex) and Keratin-14 (K14, green, medulla) is shown. (n=3-4/strain, representative of 2-3 independent experiments). (c) DN (CD4-CD8-) thymocyte development as defined by CD44 and CD25 on lineage-negative thymocytes from B6 (gray bar) and FlipFlop (black bar) mice as indicated. Lineage-negative cells were CD3-, B220-, CD11b-, TER119-, Gr-1-, CD4-, and CD8α- thymocytes. DN1 (CD44+CD25-), DN2 (CD44+CD25+), DN3 (CD44-CD25+), and DN4 (CD44-CD25-). (n=4/strain, 3 independent experiments). (d) Frequency of GL3+ γδ T cells in the thymus of B6 (gray bar) and FlipFlop (black bar) mice (n=4/strain, 3 independent experiments). (e) CCR7+ thymocytes, CD24-TCRβ+ mature thymocytes, and CD4 vs CD8α profiles from B6 and FlipFlop thymi (n=4-7/strain, representative of 4-5 independent experiments). (f) TCRβ expression and CD4 vs CD8 profiles of TCRβ+ T cells in spleens from B6 and FlipFlop mice. Total cell number (mean±s.e.m) is shown above histograms and numbers within the profiles indicate frequency of cells within that box (n=4-7/strain, representative of 4-5 independent experiments). Mean+s.e.m. (c and d).
Extended Data Fig. 2
Extended Data Fig. 2. TCR-Vβ expression of FlipFlop T cells.
Frequency of TCR-Vβ 4, 5.1/5.2, 7, 9, and 14 in LN T cells from B6 (left) and FlipFlop (right) mice (B6: n=4, FlipFlop: n=3, 3-4 independent experiments). TCR-Vβs expressed differently (>2-fold changes) between B6 CD4 and CD8 T cells were analyzed in FlipFlop T cells. FlipFlop CD4 and CD8 T cells were obtained from β2mKO and MHC-IIKO mice, respectively. * P <0.05, ** P<0.01, *** P<0.001 (two-tailed unpaired t-test). Mean+s.e.m.
Extended Data Fig. 3
Extended Data Fig. 3. Stages of positive selection in the thymus.
(a) CD4 vs CD8α expression on whole thymocytes (left) and DP thymocytes (right) from B6 and FlipFlop mice. Numbers within profiles indicate frequency of cells in each box (left) and numbers in histograms indicate MFI (right). (n=7/strain, representative of 7 independent experiments). (b) Quantitative analysis of CD4 and CD8α surface expression on thymocytes from B6 and FlipFlop mice, related to Fig. 3c. Numbers indicate MFI. (c) Intracellular calcium mobilization stimulated by TCR/coreceptor signaling of DP FlipFlop thymocytes. Thymocytes were stimulated with anti-TCRβ biotin conjugated antibody either alone (gray bar) or together with anti-CD4 (blue bar) or anti-CD8α (red bar) biotin conjugated antibodies and CD69- DP thymocytes were analyzed. Black arrow indicates crosslinking by avidin (n=3, representative of 3 independent experiments). (d) CD69 vs CCR7 profile of B6 WT thymocytes. Numbers within the profile show frequency of cells in each stage. (e) CD4 vs CD8α profile of WT and FlipFlop thymocytes at Stages 1-5 of development as shown in Fig. 3g. As shown in the profile, DN thymocytes were excluded from the analysis.
Extended Data Fig. 4
Extended Data Fig. 4. Schematic of the kinetic signaling view of T cell lineage determination in the thymus of B6 and FlipFlop mice.
TCR-mediated positive selection signaling of DP thymocytes upregulates Cd4 but terminates Cd8 gene transcription which results in increased surface expression of Cd4-encoded coreceptor proteins and reduced surface expression of Cd8-encoded coreceptor proteins. Consequently, in FlipFlop mice, TCR signaling increases CD8 coreceptor protein expression and reduces CD4 coreceptor protein expression, resulting in persistence/long-duration of CD8/MHC-I TCR signaling and disruption/short-duration of CD4/MHC-II TCR signaling in FlipFlop thymocytes. Thus CD8/MHC-I signaled FlipFlop thymocytes differentiate into helper-lineage T cells, while CD4/MHC-II signaled FlipFlop thymocytes differentiate into cytotoxic-lineage T cells.
Extended Data Fig. 5
Extended Data Fig. 5. Thymic Tregs and allograft rejection.
(a) Intracellular staining (ic) of Foxp3 in CD4 and CD8 T cells among TCRβhi thymocytes from B6 and FlipFlop mice (left). Bar graph shows numbers of Foxp3+ T cells. (mean+s.e.m., n=5/strain, representative of 5 independent experiments). (b) Treg-associated protein expression in B6 CD4 and FlipFlop CD8 helper-lineage T cells. (mean+s.e.m., n=5/strain, representative of 5 independent experiments). (c) Impact of the Scurfy mutation on B6 and FlipFlop LN T cells. (n=3/strain, representative of 3 independent experiments). (d) In vitro stimulation of CD40L and CD69 surface expression on B6 and FlipFlop LN T cells by medium (gray bar) or by immobilized anti-TCRβ+CD28 mAbs for 24 h (n=3/strain, 3 independent experiments). (e) Kinetics of skin allograft rejection.
Extended Data Fig. 6
Extended Data Fig. 6. Humoral immune responses to immunization with soluble antigens.
(a) Gate for TCRβ+CD44+ T cells in immunized spleen. (b) GC B cells and NP-binding GC B cells in the spleen from immunized B6 and FlipFlop mice. GC B cells were identified as B220+Fas+GL7+ cells and those that bound NP were specific for NP. Numbers in profiles indicate frequency of cells in each box (n=8-13/strain, 6-8 independent experiments). (c) Experimental model for construction and immunization of mixed BM chimeras shown in Fig. 5h. Partner BM cells (CD45.2) from B6 or FlipFlop mice were mixed with donor BM cells (CD45.1) from B6 mice at a 1:1 ratio and injected into irradiated B6 host mice (CD45.1). Mice were immunized with NP-KLH/Alum 8-10 wks after reconstitution. (d) Gate for CD45.2+B220+ cells in immunized spleen from BM chimeras. (e) GC B cells and NP-binding GC B cells in mixed BM chimeras. Fas and GL7 expressions (left), and NP-binding GC B cells (right) among CD45.2+B220+ splenocytes from immunized (day 10) or unimmunized mixed BM chimeras. Numbers in profiles indicate frequency of cells in each box (n=6/strain, 2 independent experiments).
Extended Data Fig. 7
Extended Data Fig. 7. LCMV-Arm infection of FlipFlop mice.
(a) Detection of virus-specific T cells by viral tetramers. Staining of T cells by H-2Db/GP33 and I-Ab/GP66 viral peptide tetramers in the spleens of uninfected B6 and FlipFlop mice. Numbers in profiles indicate frequency of cells in each box (n=3/strain, representative of 3 independent experiments). (b) Experimental model for virus infection of mixed BM chimeras shown in Fig. 6d-g. Partner BM cells (CD45.2) from B6 or FlipFlop mice were mixed with donor BM cells (CD45.1) from B6 mice at a 1:1 ratio and injected into irradiated B6 host mice (CD45.1). Mice were infected with LCMV-Arm 8-10 wks after reconstitution. (c) Circulating virus titer (FFU/ml, geometric mean±SD) in the serum of infected mice (day 8) (B6: n=6, PrfKO: n=5, MHC-IIKO: n=4, 3 independent experiments). *** P<0.001 (Mann-Whitney unpaired t-test). (d) Gate for CD45.1+TCRβ+CD8+ cells in infected spleen from BM chimeras. (e) Virus-specific T cells in mixed BM chimeras. H-2Db/GP33 vs CD44 profile of B6-origin CD8 T cells (CD45.1+TCRβ+) in the spleens from infected (day 8) or uninfected mixed BM chimeras. Numbers in profiles indicate frequency of cells in each box (day 8, n=3-4/group, 2 independent experiments). (f) CD44 vs IFN-γ profile of B6-origin CD8 T cells (CD45.1+TCRβ+) in the spleens from infected (day 8) or uninfected mixed BM chimeras. Splenocytes were stimulated with or without GP33 peptide. Numbers in profiles indicate frequency of cells in each box (n=3-4/group, 2 independent experiments).

Comment in

Similar articles

Cited by

References

    1. Klein L, Kyewski B, Allen PM, Hogquist KA. Positive and negative selection of the T cell repertoire: what thymocytes see (and don’t see) Nat. Rev. Immunol. 2014;14:377–391. doi: 10.1038/nri3667. - DOI - PMC - PubMed
    1. Taniuchi I. CD4 helper and CD8 cytotoxic T cell differentiation. Annu Rev. Immunol. 2018;36:579–601. doi: 10.1146/annurev-immunol-042617-053411. - DOI - PubMed
    1. Dave VP, Allman D, Keefe R, Hardy RR, Kappes DJ. HD mice: a novel mouse mutant with a specific defect in the generation of CD4+ T cells. Proc. Natl Acad. Sci. USA. 1998;95:8187–8192. doi: 10.1073/pnas.95.14.8187. - DOI - PMC - PubMed
    1. He X, et al. The zinc finger transcription factor Th-POK regulates CD4 versus CD8 T-cell lineage commitment. Nature. 2005;433:826–833. doi: 10.1038/nature03338. - DOI - PubMed
    1. Sun G, et al. The zinc finger protein cKrox directs CD4 lineage differentiation during intrathymic T cell positive selection. Nat. Immunol. 2005;6:373–381. doi: 10.1038/ni1183. - DOI - PubMed

Publication types

MeSH terms