

Landscape configuration affects probability of apex predator presence and community structure in experimental metacommunities
- PMID: 35523981
- PMCID: PMC9120115
- DOI: 10.1007/s00442-022-05178-9
Landscape configuration affects probability of apex predator presence and community structure in experimental metacommunities
Abstract
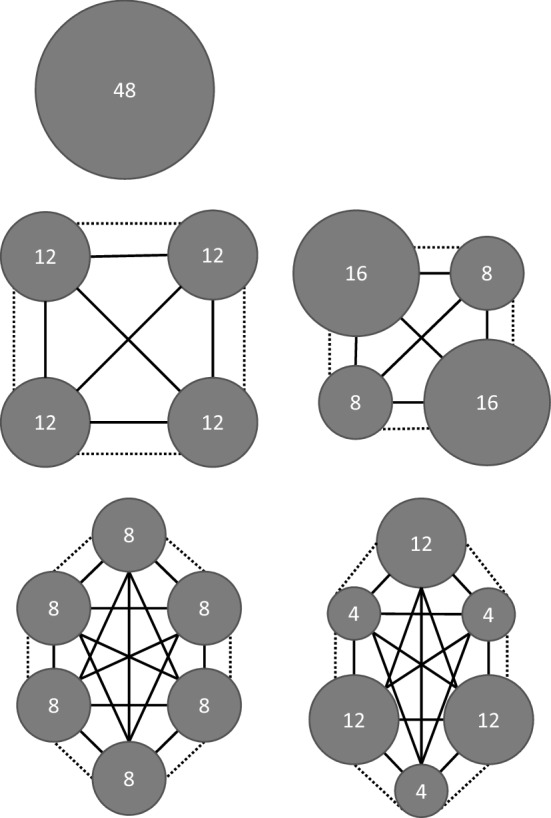
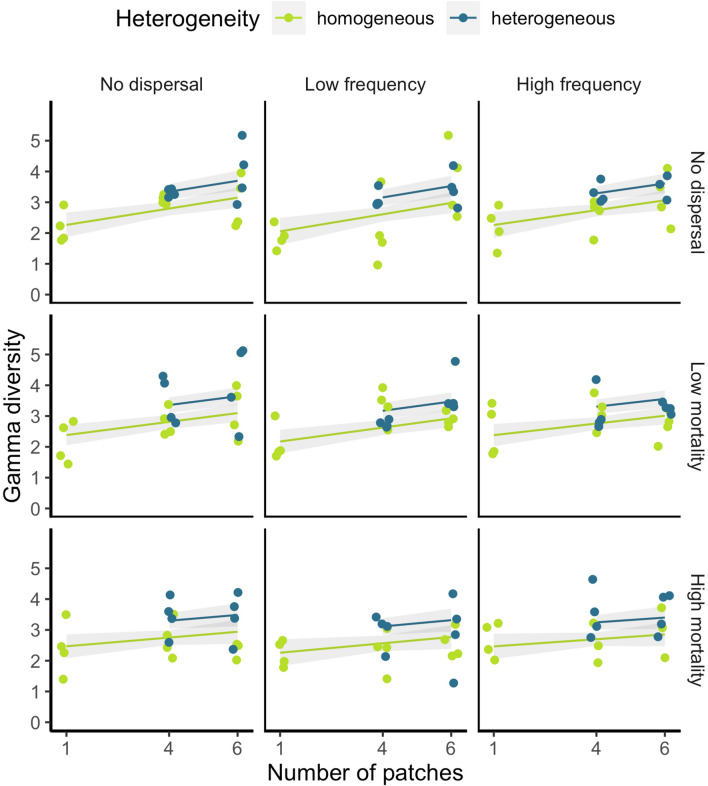
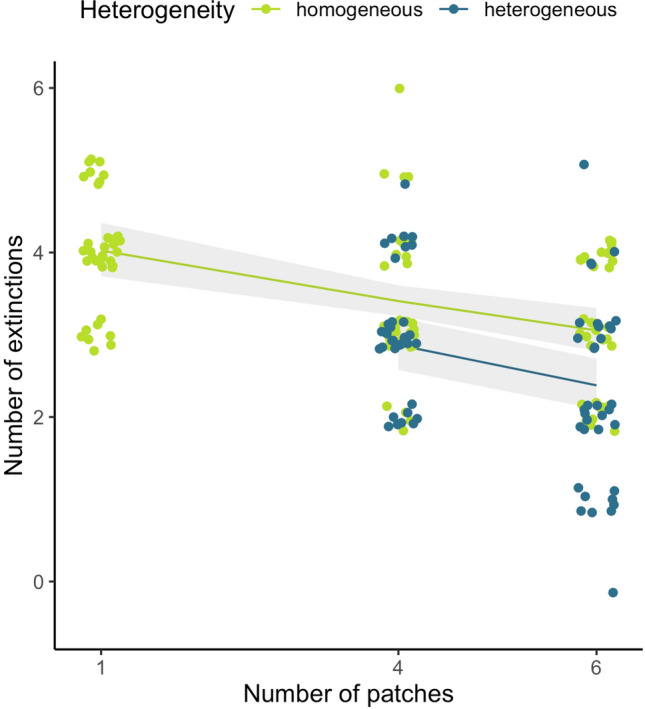
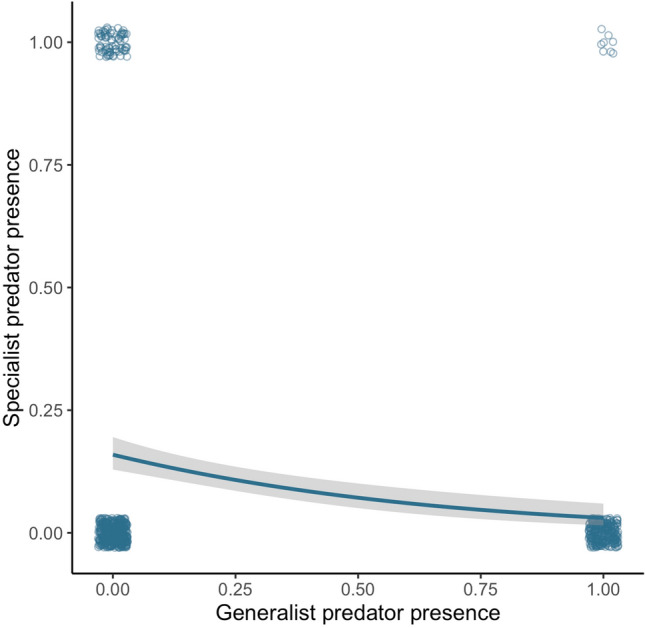
Biodiversity is declining at an unprecedented rate, highlighting the urgent requirement for well-designed protected areas. Design tactics previously proposed to promote biodiversity include enhancing the number, connectivity, and heterogeneity of reserve patches. However, how the importance of these features changes depending on what the conservation objective is remains poorly understood. Here we use experimental landscapes containing ciliate protozoa to investigate how the number and heterogeneity in size of habitat patches, rates of dispersal between neighbouring patches, and mortality risk of dispersal across the non-habitat 'matrix' interact to affect a number of diversity measures. We show that increasing the number of patches significantly increases γ diversity and reduces the overall number of extinctions, whilst landscapes with heterogeneous patch sizes have significantly higher γ diversity than those with homogeneous patch sizes. Furthermore, the responses of predators depended on their feeding specialism, with generalist predator presence being highest in a single large patch, whilst specialist predator presence was highest in several-small patches with matrix dispersal. Our evidence emphasises the importance of considering multiple diversity measures to disentangle community responses to patch configuration.
Keywords: Dispersal; Diversity; Heterogeneity; Protected area; SLOSS.
© 2022. The Author(s).
Conflict of interest statement
The authors declare that they have no conflict of interest.
Figures

References
-
- Altermatt F, Fronhofer EA, Garnier A, Giometto A, Hammes F, Klecka J, Legrand D, Mächler E, Massie TM, Pennekamp F, Plebani M, Pontarp M, Schtickzelle N, Thuillier V, Petchey OL. Big answers from small worlds: a user’s guide for protist microcosms as a model system in ecology and evolution. Methods Ecol Evol. 2015;6(2):218–231. doi: 10.1111/2041-210X.12312. - DOI
-
- Bartón K (2020) MuMIn: Multi-model inference (R. package version 1.43.17)
-
- Bartonova A, Benes J, Fric ZF, Chobot K, Konvicka M. How universal are reserve design rules? A test using butterflies and their life history traits. Ecography. 2016;39(5):456–464. doi: 10.1111/ecog.01642. - DOI
MeSH terms
Grants and funding
LinkOut - more resources
Full Text Sources
Miscellaneous
