. 2022 May 6;13(1):2493.
doi: 10.1038/s41467-022-30159-0.

Regulated IRE1α-dependent decay (RIDD)-mediated reprograming of lipid metabolism in cancer

Affiliations

Regulated IRE1α-dependent decay (RIDD)-mediated reprograming of lipid metabolism in cancer

Aitor Almanza et al. Nat Commun. .

Abstract

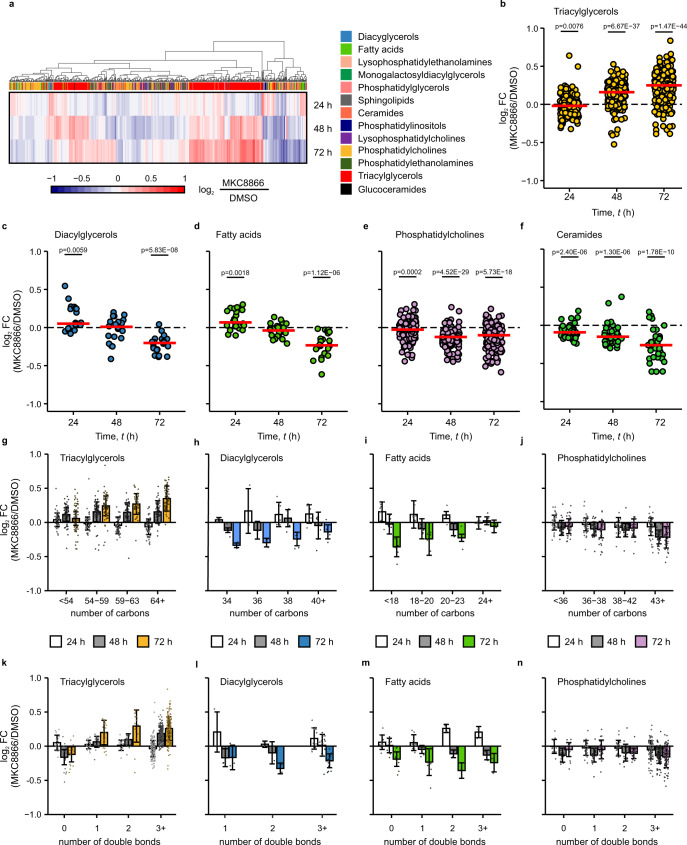
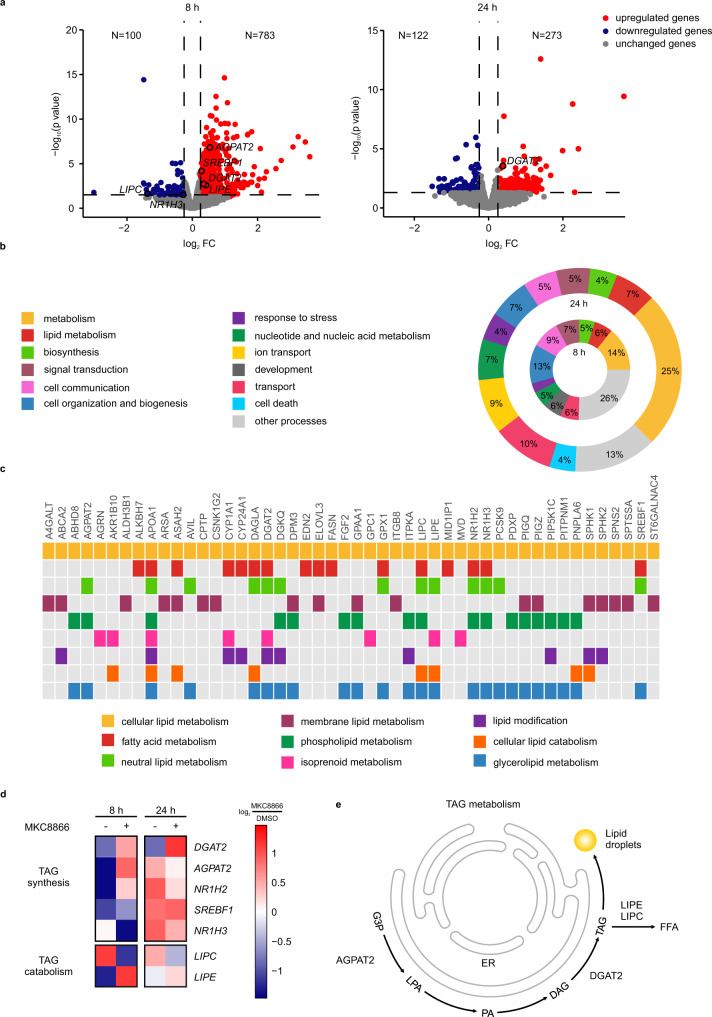
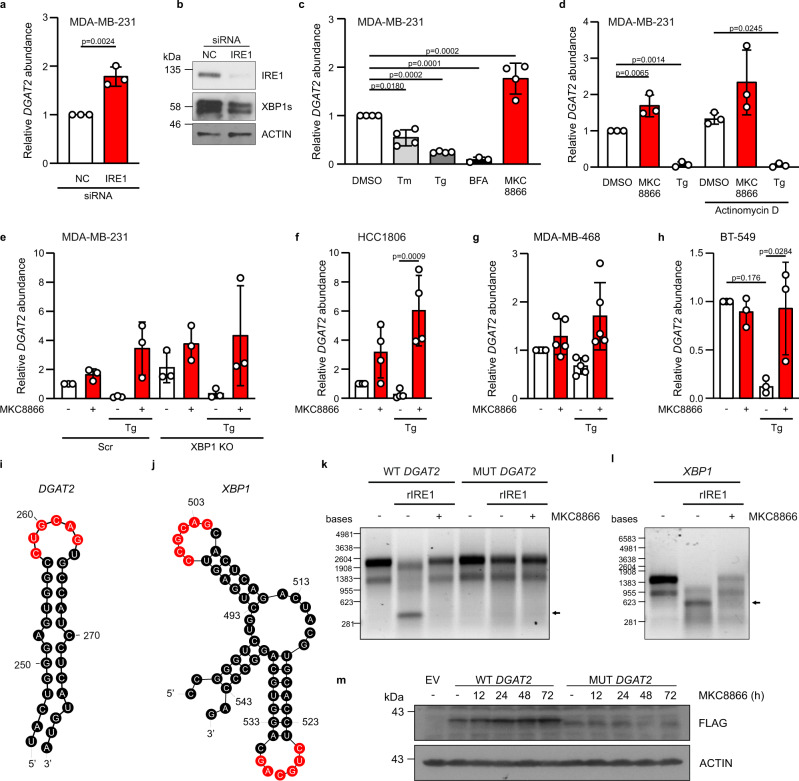
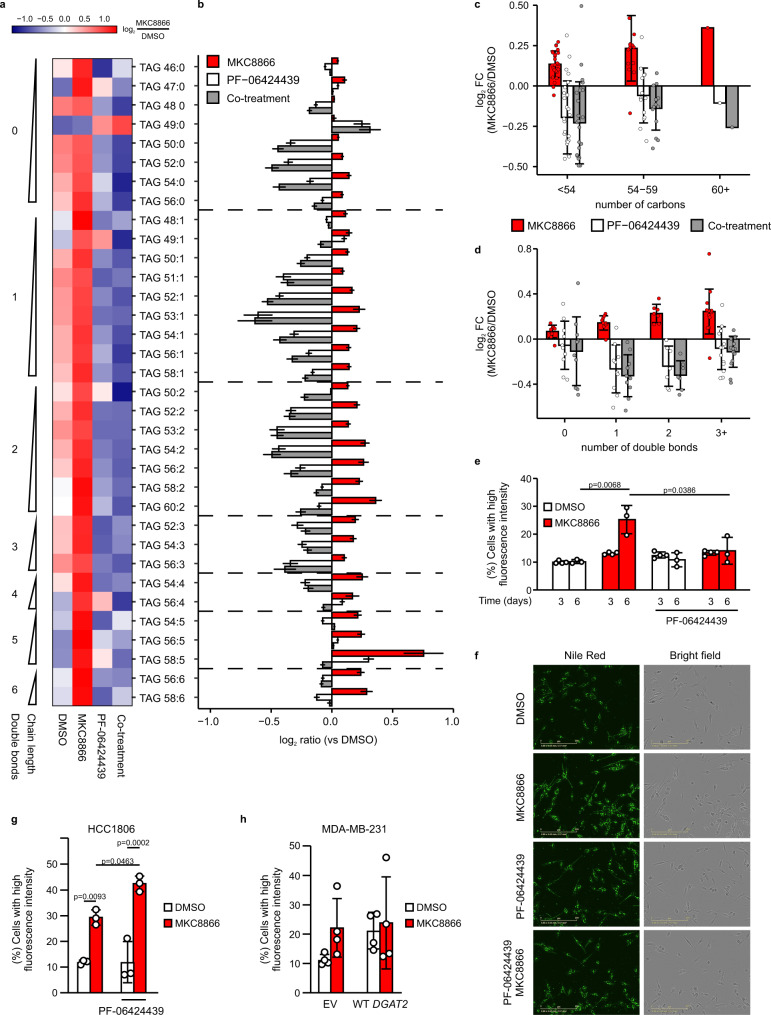
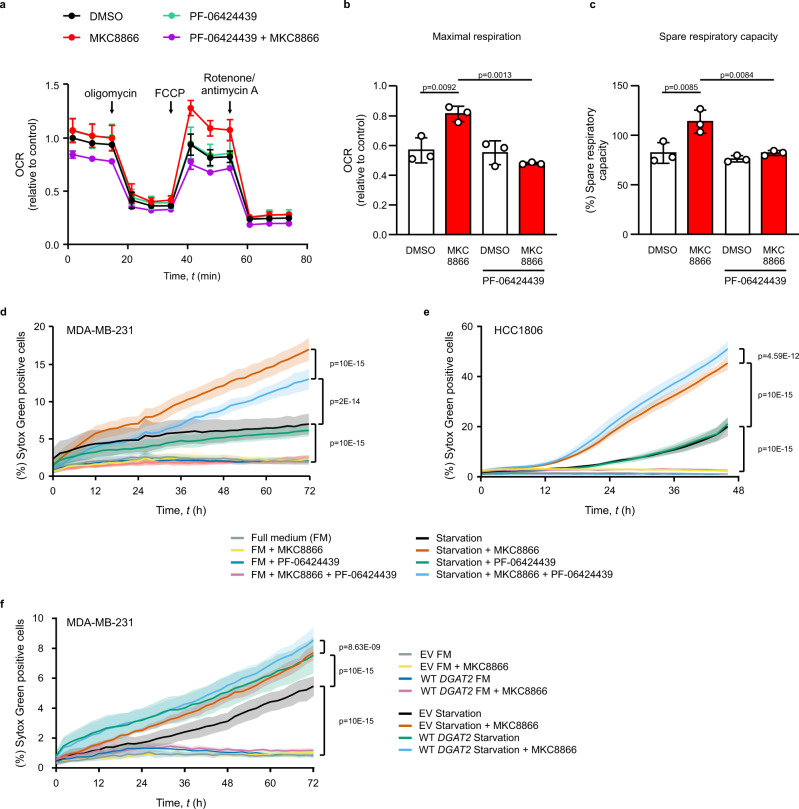
IRE1α is constitutively active in several cancers and can contribute to cancer progression. Activated IRE1α cleaves XBP1 mRNA, a key step in production of the transcription factor XBP1s. In addition, IRE1α cleaves select mRNAs through regulated IRE1α-dependent decay (RIDD). Accumulating evidence implicates IRE1α in the regulation of lipid metabolism. However, the roles of XBP1s and RIDD in this process remain ill-defined. In this study, transcriptome and lipidome profiling of triple negative breast cancer cells subjected to pharmacological inhibition of IRE1α reveals changes in lipid metabolism genes associated with accumulation of triacylglycerols (TAGs). We identify DGAT2 mRNA, encoding the rate-limiting enzyme in TAG biosynthesis, as a RIDD target. Inhibition of IRE1α, leads to DGAT2-dependent accumulation of TAGs in lipid droplets and sensitizes cells to nutritional stress, which is rescued by treatment with the DGAT2 inhibitor PF-06424439. Our results highlight the importance of IRE1α RIDD activity in reprograming cellular lipid metabolism.


Conflict of interest statement

A.S., A.M.G., and E.C. are co-founders of Cell Stress Discoveries Ltd. A.C. and E.P. are co-founders and employees of e-NIOS. S.K. is employed by metaSysX. The remaining authors declare no competing interests.

Figures

Fig. 1
Fig. 1. Lipidomic profiling reveals changes in TAG metabolism upon inhibition of IRE1α.
an MDA-MB-231 cells were treated with 20 µM MKC8866 or vehicle (DMSO) for 24, 48, and 72 h after which their lipidomic landscape was profiled by ultraperformance liquid chromatography tandem mass spectrometry (UPLC–MS) (n = 5 biologically independent experiments). a Heatmap showing the log2-fold change (log2 FC) between the MKC8866 and DMSO groups for each measured lipid species. Red indicates increased abundance while blue indicates those with lower abundance upon MKC8866 treatment. Lipid class is indicated in column color tags. bf Scatter plots showing the average log2 FC (MKC8866/DMSO) for levels of b TAGs (n = 242), c DAGs (n = 20), d FAs (n = 22), e PCs (n = 145), and f ceramides (n = 41) species at the indicated time points. gn Bar plots displaying log2 FC (MKC8866/DMSO) for levels of g, k TAG, h, l DAG, i, m FA and j, n PC lipid groups separated by gj chain length and kn unsaturation status. Individual dots representing the average log2 FC for each lipid species. Data are presented as mean log2 FC values ± s.d. Statistical comparisons performed with unpaired one-sample t-test to determine whether the population mean is different from 0. p values indicated on the graph were considered significant if p < 0.05. Source data are provided as a Source Data file.
Fig. 2
Fig. 2. IRE1α signaling modulates expression of genes involved in TAG metabolism.
ac MDA-MB-231 cells were treated with 20 µM MKC8866 or DMSO for 8 and 24 h after which RNA was extracted and RNA sequencing analysis performed (n = 3 biologically independent experiments). Pairwise comparison MKC8866/DMSO was performed with edgeR for identification of differentially expressed genes (DEGs) at each time point (no multiple comparison adjustments were performed). a Volcano plots showing fold changes and −log10(p-value) for genes differentially expressed between MKC8866 and DMSO treated cells at 8 and 24 h. Blue indicates downregulated genes and red indicates upregulated genes upon MKC8866 treatment (p < 0.05). b Summary of a functional analysis of DEGs at 8 and 24 h time points. Overrepresented Gene Ontology (GO) terms were summarized into broader biological groups based on semantic similarity with cateGOrizer to facilitate biological interpretation. c Genes termed significantly changing at either of the two time points and annotated to lipid metabolism on the GO database. d Heatmap displaying average expression levels for DEG annotated to TAG metabolism in the GO database. The expression for each gene (row) was centered and scaled so the mean expression is zero and standard deviation is one. e Schematic representation of TAG metabolism, showing TAG metabolism-regulating genes whose expression is altered by IRE1α. G3P glycerol-3-phosphate, LPA lysophosphatidic acid, PA phosphatidic acid, DAG diacylglycerol, TAG triacylglycerol, FFA free fatty acid. Source data are provided as a Source Data file.
Fig. 3
Fig. 3. DGAT2 is an IRE1α RIDD substrate.
ad MDA-MB-231 cells were either a, b transfected with non-coding (nc) and IRE1 siRNA for 72 h (n = 3 biologically independent experiments), c treated with Tunicamycin (Tm, 5 µg/ml), Thapsigargin (Tg, 0.25 µM), Brefeldin A (BFA, 0.5 µg/ml), MKC8866 (20 µM) for 24 h (n = 4 biologically independent experiments) or d pre-treated with actinomycin D (2 µg/ml) for 2 h followed by incubation of cells with Tg (0.25 µM) and MKC8866 (20 µM) for 8 h (n = 3 biologically independent experiments). e MDA-MB-231 XBP1 knockout (KO) cells were treated with DMSO or 20 µM MKC8866 in the presence or absence of 1 µM Tg (n = 3 biologically independent experiments). RT-qPCR quantification of DGAT2 transcript levels relative to a, c, d MRPLP19 and e ACTB and normalized to control at 0 h time point. b Immunoblotting of total IRE1α, XBP1s and ACTIN. fh Expression of DGAT2 relative to MRPL19 in f HCC1806 (n = 4 biologically independent experiments), g MDA-MB-468 (n = 5 biologically independent experiments) and h BT-549 cells (n = 3 biologically independent experiments) treated with DMSO or 20 µM MKC8866 in the presence or absence of 1 µM Tg for 24 h. i, j RNAfold prediction of secondary structure of mRNA fragments of i DGAT2 and j XBP1 mRNA. IRE1α consensus cleavage sequences are highlighted in red. k, l In vitro transcribed k wild type (WT) DGAT2, c.260G>A DGAT2 mutant (MUT DGAT2)and l XBP1 mRNAs were incubated with recombinant hIRE1α in the presence or absence of 20 μM MKC8866. Arrows indicate cleavage products (n = 4 biologically independent experiments). m MDA-MB-231 cells stably expressing empty vector (EV), FLAG-tagged wild type DGAT2 (WT DGAT2) or guanine 260 to adenine mutated FLAG-tagged DGAT2 (MUT DGAT2) were treated with 20 μM MKC8866 for indicated time points. Representative immunoblots of FLAG and ACTIN for three biologically independent experiments. Indicated p values, based on a comparison of the two groups using an unpaired two-tailed t test or ch one-way ANOVA with Bonferroni’s multiple comparisons post hoc tests. Values with p < 0.05 are considered statistically significant. Data are presented as mean values ± s.d. Source data are provided as a Source Data file.
Fig. 4
Fig. 4. Inhibition of DGAT2 reverses IRE1α-mediated effect on TAG accumulation.
af MDA-MB-231 cells, g HCC1806 (n = 3 biologically independent experiments) and h MDA-MB-231 cells stably expressing EV and WT DGAT2 (n = 4 biologically independent experiments) were treated with 20 µM MKC8866 or vehicle for ad 3 days, e 3 days (n = 4 biologically independent experiments) and 6 days (n = 3 biologically independent experiments) or fh 6 days in the presence or absence of 2 µM PF-06424439. ad Metabolites were extracted and their levels were quantified by LC-MS. a Heatmap showing the average abundance for all measured TAG species (n = 34) across the different treatments. Expression across each row was centered and scaled so the mean expression is zero and standard deviation is one. b Bar charts showing mean of log2 FC versus vehicle-treated cells (DMSO) ± s.e.m. estimated by propagation of error for each treatment and individual TAG species. c and d Graphs displaying log2 FC versus vehicle-treated cells (DMSO) for each treatment for all TAG species grouped by total number of c carbon atoms and d double bonds. Bars indicate mean log2 FC for lipid species within each group ± s.d. eh Cells were stained with Nile red to visualize and quantify lipid droplets. e, g, h Percentage of cells with a high LD content. f Representative images of MDA-MB-231 cells stained with Nile red after 6 days of treatment (n = 3 biologically independent experiments). Scale bar = 200 µm. Indicated p values based on one-way ANOVA with Bonferroni’s multiple comparisons post hoc tests. Values with p < 0.05 are considered statistically significant. Data are presented as mean values ± s.d. Source data are provided as a Source Data file.
Fig. 5
Fig. 5. MKC8866 sensitizes cells to starvation through regulation of DGAT2.
ac MDA-MB-231 cells were treated with vehicle or 20 μM MKC8866 in the presence or absence of 2 µM PF-06424439 for 6 days (n = 3 biologically independent experiments). ac Seahorse extracellular flux analysis of oxygen consumption rate (OCR) following the indicated injections normalized to vehicle. Data plotted to demonstrate the changes in mitochondrial b maximal respiration and c spare respiratory capacity. Indicated p values based on comparison of multiple groups using one-way ANOVA with Bonferroni’s multiple comparisons post hoc tests. Values with p < 0.05 are considered statistically significant. Data are presented as mean values ± s.d. d MDA-MB-231 cells (n = 4 biologically independent experiments), e HCC1806 (n = 4 biologically independent experiments) and f MDA-MB-231 cells stably expressing EV or WT DGAT2 (n = 3 biologically independent experiments) were treated with vehicle or 20 μM MKC8866 in the presence or absence of 2 μM PF-06424439. After 6 days, culture medium was replaced with a complete medium or Hanks’ balanced salt solution. Kinetics of cell death for up to 72 h was expressed as the percentage of cells that were Sytox Green positive. Indicated p values based on two-way ANOVA with Bonferroni’s multiple comparisons post hoc tests. Values with p < 0.05 are considered statistically significant. Data are presented as mean values ± s.e.m. Source data are provided as a Source Data file.

References

    1. Mori K. Signalling pathways in the unfolded protein response: development from yeast to mammals. J. Biochem. 2009;146:743–750. doi: 10.1093/jb/mvp166. - DOI - PubMed
    1. Cox JS, Shamu CE, Walter P. Transcriptional induction of genes encoding endoplasmic reticulum resident proteins requires a transmembrane protein kinase. Cell. 1993;73:1197–1206. doi: 10.1016/0092-8674(93)90648-A. - DOI - PubMed
    1. Hollien J, et al. Regulated Ire1-dependent decay of messenger RNAs in mammalian cells. J. Cell Biol. 2009;186:323–331. doi: 10.1083/jcb.200903014. - DOI - PMC - PubMed
    1. Yoshida H, Matsui T, Yamamoto A, Okada T, Mori K. XBP1 mRNA is induced by ATF6 and spliced by IRE1 in response to ER stress to produce a highly active transcription factor. Cell. 2001;107:881–891. doi: 10.1016/S0092-8674(01)00611-0. - DOI - PubMed
    1. Kosmaczewski SG, et al. The RtcB RNA ligase is an essential component of the metazoan unfolded protein response. EMBO Rep. 2014;15:1278–1285. doi: 10.15252/embr.201439531. - DOI - PMC - PubMed

Publication types

MeSH terms