

The electroretinogram b-wave amplitude: a differential physiological measure for Attention Deficit Hyperactivity Disorder and Autism Spectrum Disorder
- PMID: 35524181
- PMCID: PMC9077889
- DOI: 10.1186/s11689-022-09440-2
The electroretinogram b-wave amplitude: a differential physiological measure for Attention Deficit Hyperactivity Disorder and Autism Spectrum Disorder
Abstract
Background: Attention Deficit Hyperactivity Disorder (ADHD) is the most prevalent childhood neurodevelopmental disorder. It shares some genetic risk with Autism Spectrum Disorder (ASD), and the conditions often occur together. Both are potentially associated with abnormal glutamate and GABA neurotransmission, which can be modelled by measuring the synaptic activity in the retina with an electroretinogram (ERG). Reduction of retinal responses in ASD has been reported, but little is known about retinal activity in ADHD. In this study, we compared the light-adapted ERGs of individuals with ADHD, ASD and controls to investigate whether retinal responses differ between these neurodevelopmental conditions.
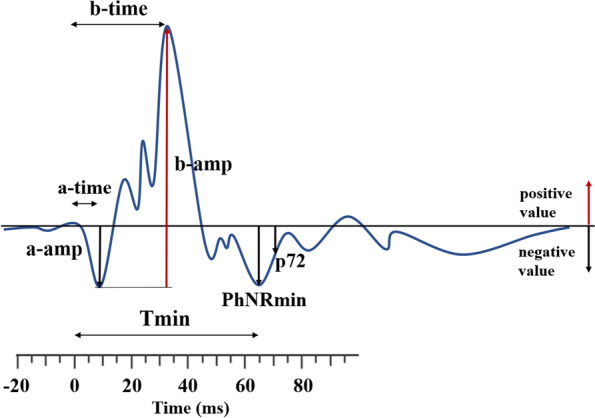
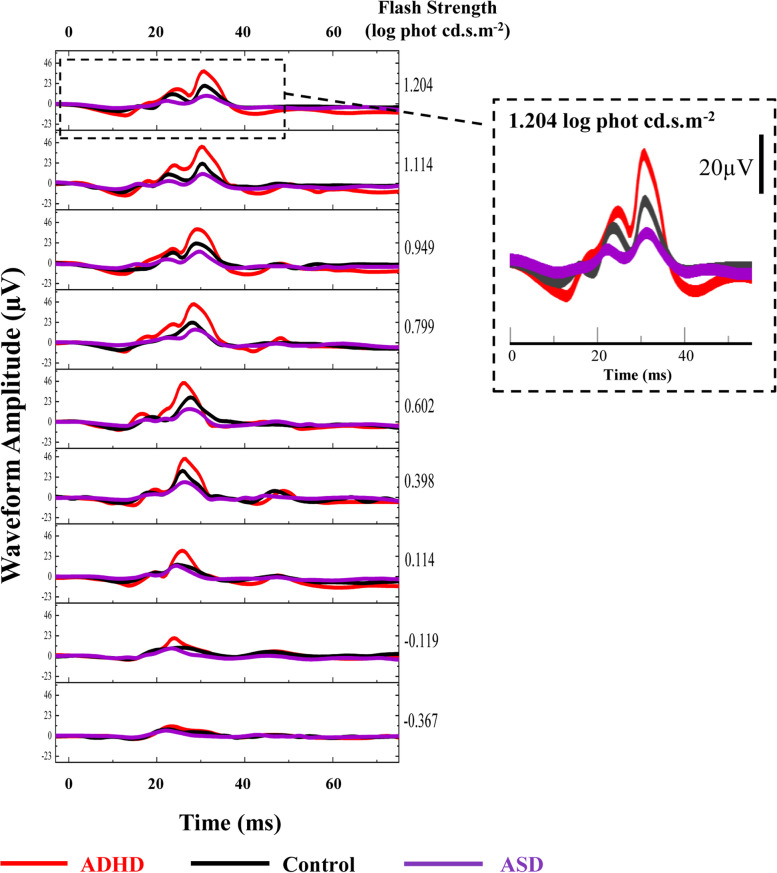
Methods: Full field light-adapted ERGs were recorded from 15 ADHD, 57 ASD (without ADHD) and 59 control participants, aged from 5.4 to 27.3 years old. A Troland protocol was used with a random series of nine flash strengths from -0.367 to 1.204 log photopic cd.s.m-2. The time-to-peak and amplitude of the a- and b-waves and the parameters of the Photopic Negative Response (PhNR) were compared amongst the three groups of participants, using generalised estimating equations.
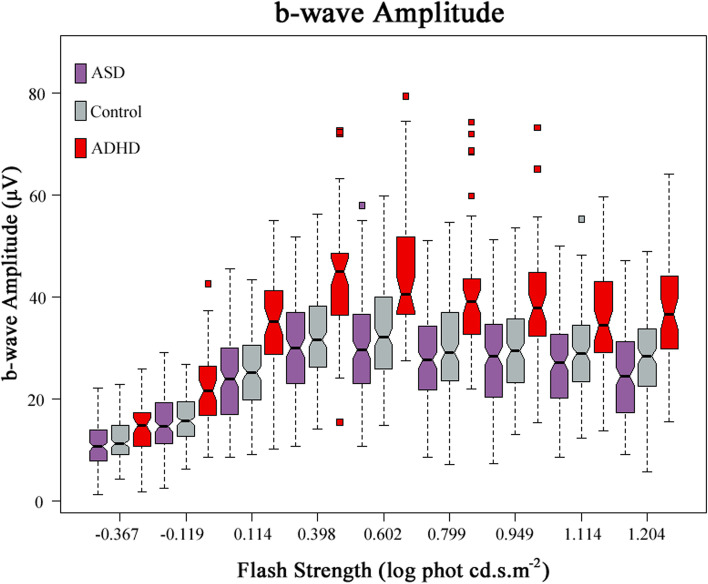
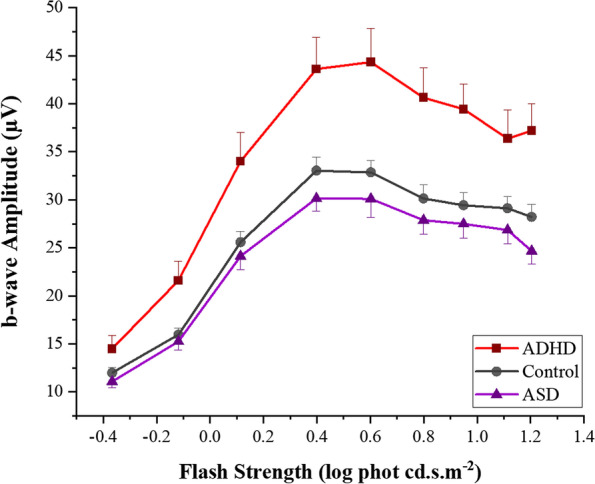
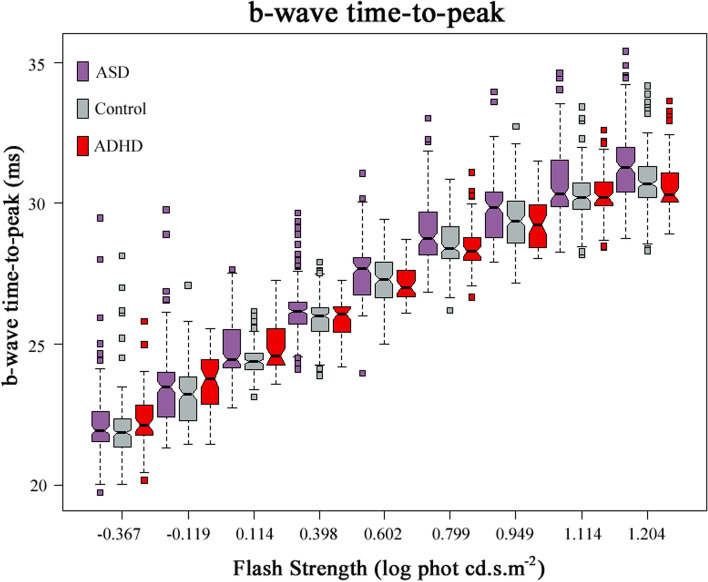
Results: Statistically significant elevations of the ERG b-wave amplitudes, PhNR responses and faster timings of the b-wave time-to-peak were found in those with ADHD compared with both the control and ASD groups. The greatest elevation in the b-wave amplitudes associated with ADHD were observed at 1.204 log phot cd.s.m-2 flash strength (p < .0001), at which the b-wave amplitude in ASD was significantly lower than that in the controls. Using this measure, ADHD could be distinguished from ASD with an area under the curve of 0.88.
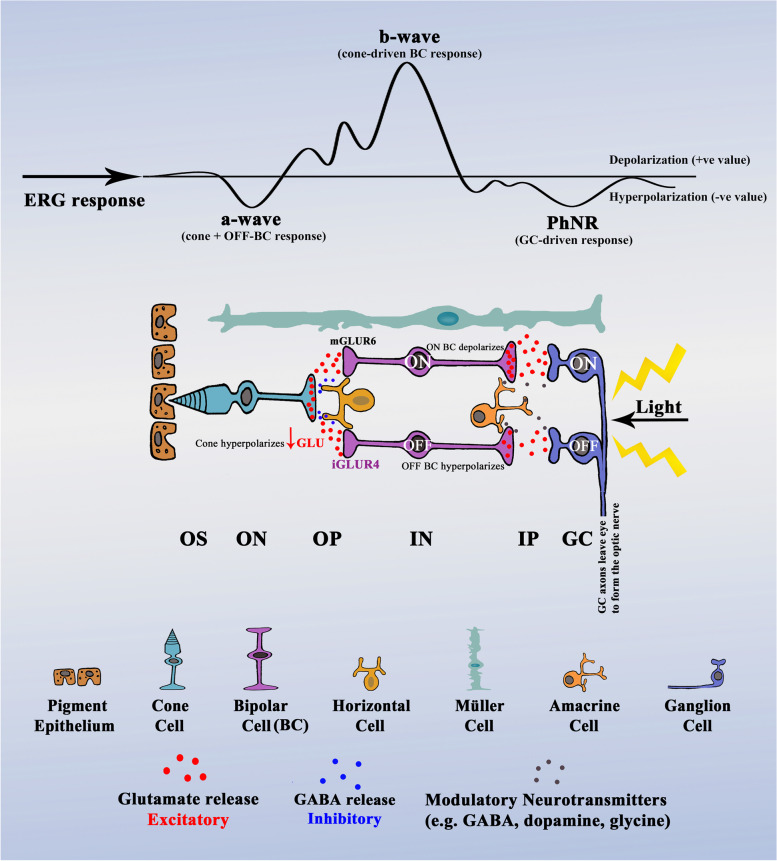
Conclusions: The ERG b-wave amplitude appears to be a distinctive differential feature for both ADHD and ASD, which produced a reversed pattern of b-wave responses. These findings imply imbalances between glutamate and GABA neurotransmission which primarily regulate the b-wave formation. Abnormalities in the b-wave amplitude could provisionally serve as a biomarker for both neurodevelopmental conditions.
Keywords: ADHD; ASD; Differentiation; Electroretinogram; GABA; Glutamate; Neurotransmission Imbalance; Physiological Marker.
© 2022. The Author(s).
Conflict of interest statement
The authors declare that they have no competing interests.
Figures
Similar articles
-
Full-field electroretinogram in autism spectrum disorder.Doc Ophthalmol. 2016 Apr;132(2):83-99. doi: 10.1007/s10633-016-9529-y. Epub 2016 Feb 11. Doc Ophthalmol. 2016. PMID: 26868825
-
Discrete Wavelet Transform Analysis of the Electroretinogram in Autism Spectrum Disorder and Attention Deficit Hyperactivity Disorder.Front Neurosci. 2022 Jun 6;16:890461. doi: 10.3389/fnins.2022.890461. eCollection 2022. Front Neurosci. 2022. PMID: 35733935 Free PMC article.
-
Detecting Autism Spectrum Disorder and Attention Deficit Hyperactivity Disorder Using Multimodal Time-Frequency Analysis with Machine Learning Using the Electroretinogram from Two Flash Strengths.J Autism Dev Disord. 2025 Apr;55(4):1365-1378. doi: 10.1007/s10803-024-06290-w. Epub 2024 Feb 23. J Autism Dev Disord. 2025. PMID: 38393437
-
Autism spectrum disorder and attention-deficit/hyperactivity disorder in early childhood: A review of unique and shared characteristics and developmental antecedents.Neurosci Biobehav Rev. 2016 Jun;65:229-63. doi: 10.1016/j.neubiorev.2016.03.019. Epub 2016 Mar 26. Neurosci Biobehav Rev. 2016. PMID: 27026637 Review.
-
A systematic review of comorbidity between cerebral palsy, autism spectrum disorders and Attention Deficit Hyperactivity Disorder.Eur J Paediatr Neurol. 2019 Jan;23(1):31-42. doi: 10.1016/j.ejpn.2018.10.005. Epub 2018 Nov 2. Eur J Paediatr Neurol. 2019. PMID: 30446273
Cited by
-
Spectral Analysis of Light-Adapted Electroretinograms in Neurodevelopmental Disorders: Classification with Machine Learning.Bioengineering (Basel). 2024 Dec 28;12(1):15. doi: 10.3390/bioengineering12010015. Bioengineering (Basel). 2024. PMID: 39851292 Free PMC article.
-
Retinal GABAergic Alterations in Adults with Autism Spectrum Disorder.J Neurosci. 2024 Apr 3;44(14):e1218232024. doi: 10.1523/JNEUROSCI.1218-23.2024. J Neurosci. 2024. PMID: 38467434 Free PMC article. Clinical Trial.
-
Subsequent and simultaneous electrophysiological investigation of the retina and the visual cortex in neurodegenerative and psychiatric diseases: what are the forecasts for the medicine of tomorrow?Front Psychiatry. 2023 Jun 2;14:1167654. doi: 10.3389/fpsyt.2023.1167654. eCollection 2023. Front Psychiatry. 2023. PMID: 37333926 Free PMC article. Review.
-
Cognitive function and retinal biomarkers as novel approach to diagnosing and assessing autism spectrum disorder.Sci Rep. 2025 May 23;15(1):17946. doi: 10.1038/s41598-025-03062-z. Sci Rep. 2025. PMID: 40410251 Free PMC article.
-
The prion protein is required for normal responses to light stimuli by photoreceptors and bipolar cells.iScience. 2024 Sep 13;27(10):110954. doi: 10.1016/j.isci.2024.110954. eCollection 2024 Oct 18. iScience. 2024. PMID: 39381753 Free PMC article.
References
-
- American Psychiatric Association . Diagnostic and statistical manual of mental disorders (DSM-5) 5. Washington, DC: American Psychiatric Publishing; 2013.
