. 2022 May 6;22(1):504.
doi: 10.1186/s12885-022-09561-w.

Image-guided navigation for locally advanced primary and locally recurrent rectal cancer: evaluation of its early cost-effectiveness

Affiliations

Image-guided navigation for locally advanced primary and locally recurrent rectal cancer: evaluation of its early cost-effectiveness

Melanie Lindenberg et al. BMC Cancer. .

Abstract

Background: A first pilot study showed that an image-guided navigation system could improve resection margin rates in locally advanced (LARC) and locally recurrent rectal cancer (LRRC) patients. Incremental surgical innovation is often implemented without reimbursement consequences, health economic aspects should however also be taken into account. This study evaluates the early cost-effectiveness of navigated surgery compared to standard surgery in LARC and LRRC.

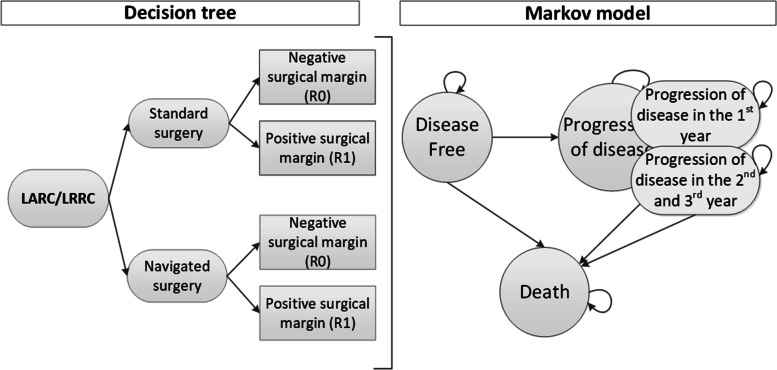
Methods: A Markov decision model was constructed to estimate the expected costs and outcomes for navigated and standard surgery. The input parameters were based on pilot data from a prospective (navigation cohort n = 33) and retrospective (control group n = 142) data. Utility values were measured in a comparable group (n = 63) through the EQ5D-5L. Additionally, sensitivity and value of information analyses were performed.

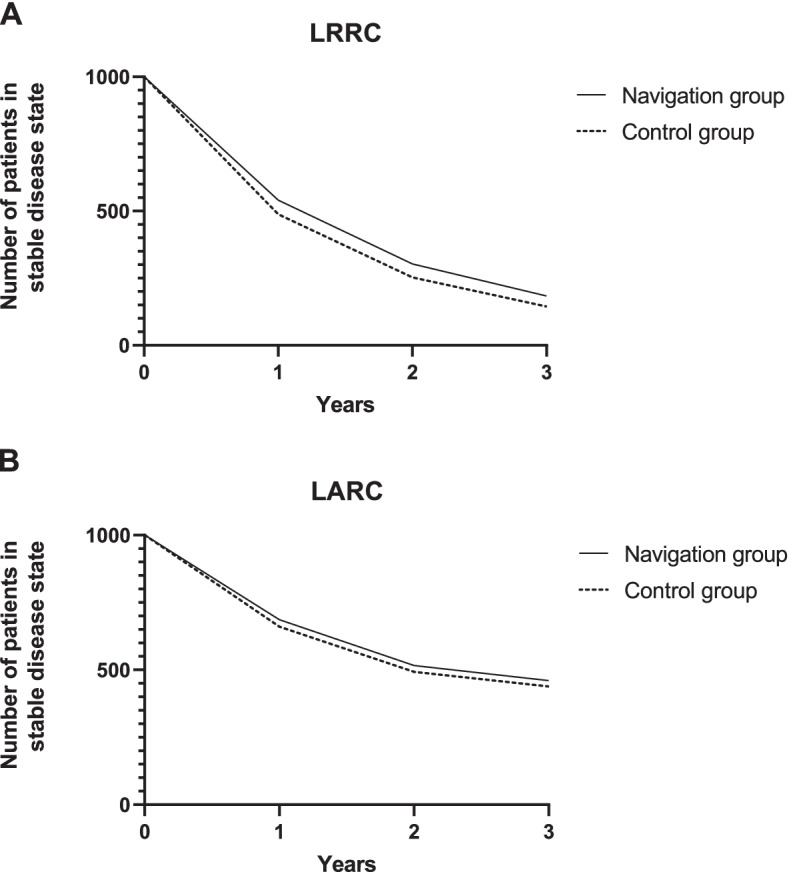
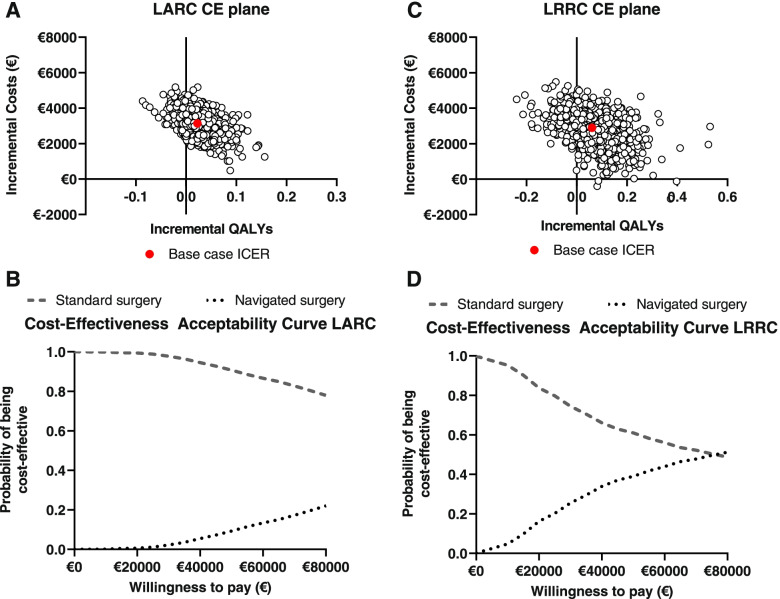
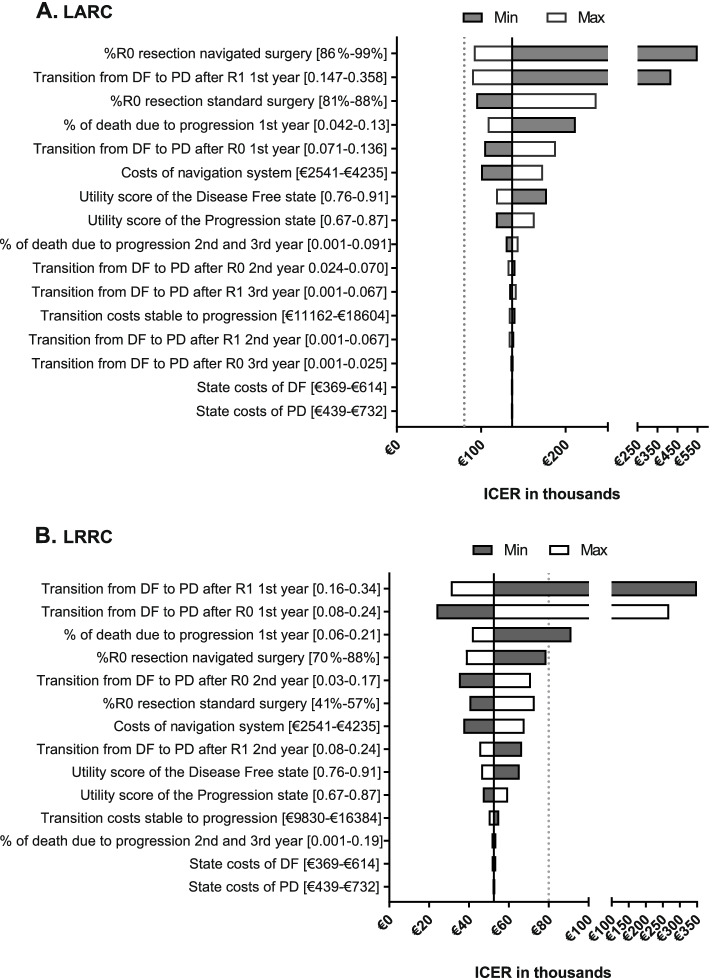
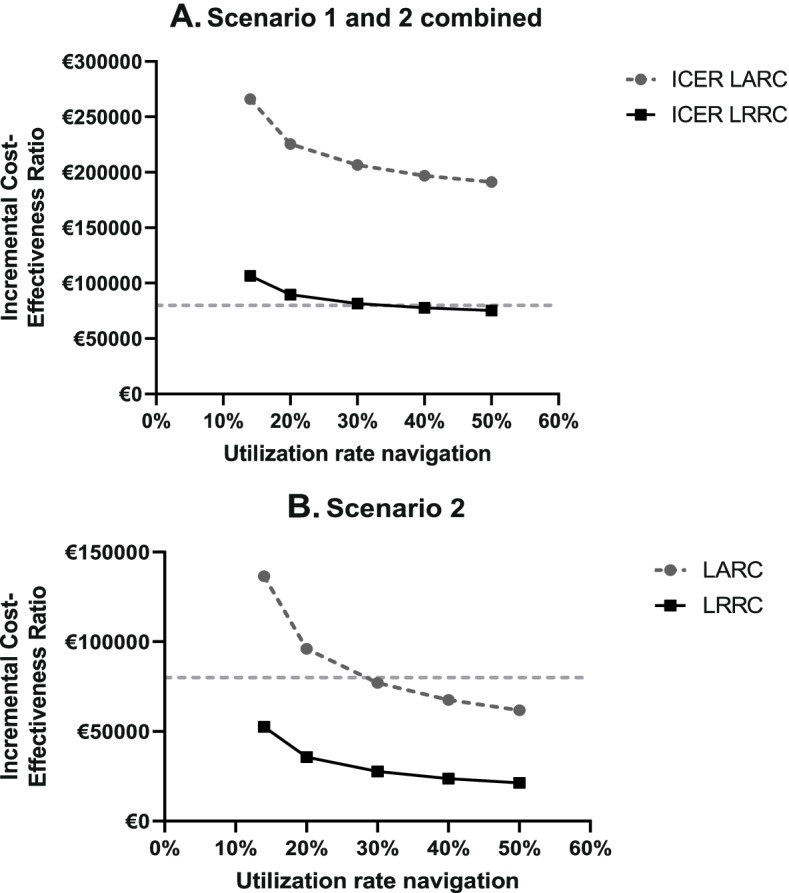
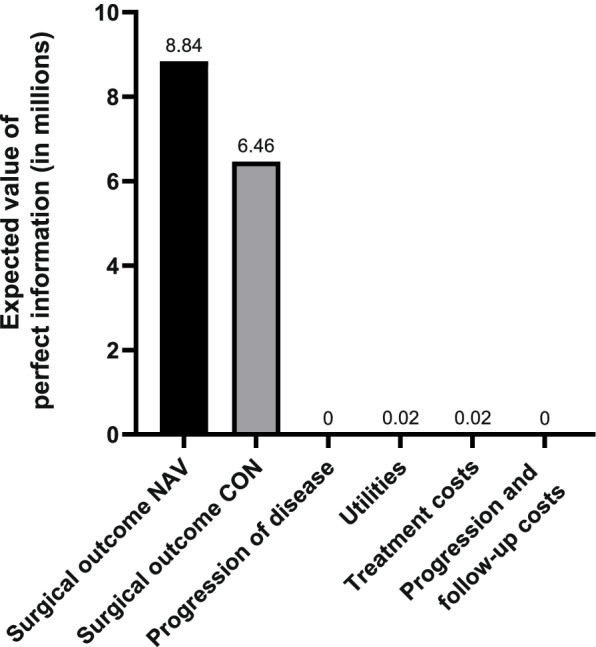
Results: Based on this early evaluation, navigated surgery showed incremental costs of €3141 and €2896 in LARC and LRRC. In LARC, navigated surgery resulted in 2.05 Quality-Adjusted Life Years (QALYs) vs 2.02 QALYs for standard surgery. For LRRC, we found 1.73 vs 1.67 QALYs respectively. This showed an Incremental Cost-Effectiveness Ratio (ICER) of €136.604 for LARC and €52.510 for LRRC per QALY gained. In scenario analyses, optimal utilization rates of the navigation technology lowered the ICER to €61.817 and €21.334 for LARC and LRRC. The ICERs of both indications were most sensitive to uncertainty surrounding the risk of progression in the first year after surgery, the risk of having a positive surgical margin, and the costs of the navigation system.

Conclusion: Adding navigation system use is expected to be cost-effective in LRRC and has the potential to become cost-effective in LARC. To increase the probability of being cost-effective, it is crucial to optimize efficient use of both the hybrid OR and the navigation system and identify subgroups where navigation is expected to show higher effectiveness.

Keywords: Early cost-effectiveness analysis; Early health technology assessment; Local recurrent rectal cancer; Locally advanced rectal cancer; Navigation technology; Surgery.


Conflict of interest statement

The authors declare that they have no competing interests.

Figures

Fig. 1
Fig. 1
Overview of the model. On the left, the decision tree is visualized in which the margin status after navigated and standard surgery is incorporated. On the right, the Markov model is shown which is used to model the costs and effects after having a negative or positive surgical margin. It also shows the tunnel states used to incorporate time effects on the transition from progression to death due to progression
Fig. 2
Fig. 2
Graphical representation of patients in the stable disease state over time. These graphs show the number of patients in the model (cohort of 1000 patients) that stay in the stable disease state over time for the navigated and standard surgery group. A shows the patient flow for LRRC and B shows the patient flow for LARC
Fig. 3
Fig. 3
A and C show Cost-effectiveness planes for LARC (A) and LRRC (C) showing the incremental Quality Adjusted Life Years (QALYs) per incremental costs for navigated surgery versus standard surgery. The scatterplots show the mean differences in costs and outcomes from the data using 2000 bootstrap replicates. In both indications, most of the observations are in the North-East quadrant which indicates improved outcomes at higher costs. B and D show Cost-Effectiveness Acceptability Curves for LARC (B) and LRRC (D) presenting the probability of the cost-effectiveness of navigated surgery and standard surgery for a range of willingness to pay thresholds
Fig. 4
Fig. 4
Sensitivity analyses. Tornado diagram showing the results of the one-way sensitivity analysis. A shows the results for the LARC group with a deterministic ICER of €136.604. B shows the results for the LRRC group with a deterministic ICER of €52.510. The scales of both figures are different and the gap on x-axis shows that a different scale is used after the gap. A dotted line is placed at the willingness to pay threshold of €80.000 which is used in the Netherlands. DF = disease free, PD = progression of disease, R0 = radical resection, R1 = a positive surgical margin
Fig. 5
Fig. 5
Graphical illustration of the scenario analysis. Shows the impact of varying the utilization rate of the navigation technology on the ICER. A shows the ICER for multiple utilization rates of navigation for the combination of scenario 1 and 2. Scenario 1 includes the construction costs for a hybrid OR when a hospital does not have this yet. In Scenario 2 the navigation system was used for 50%. B shows the ICER for multiple utilization rates of navigation of Scenario 2
Fig. 6
Fig. 6
The expected value of perfect information for parameter groups for LRRC

References

    1. Glynne-Jones R, Wyrwicz L, Tiret E, Brown G, Rödel C, Cervantes A, et al. Rectal cancer: ESMO Clinical Practice Guidelines for diagnosis, treatment and follow-up†. Ann Oncol. 2017;28(suppl_4):iv22–iv40. doi: 10.1093/annonc/mdx224. - DOI - PubMed
    1. Ned Tijdschr Geneeskd. Behandeling van lokaal recidiverend rectumcarcinoom. 2015;159;A8199. - PubMed
    1. Integraal Kankercentrum Nederland. Darmkanker in Nederland: cijfers uit de Nederlandse Kankerregistratie. https://www.iknl.nl/nieuws/2019/darmkanker-in-nederland-cijfers-uit-de-n.... Accessed 4 Feb 2020.
    1. Lee Y-C, Lee Y-L, Chuang J-P, Lee J-C. Differences in survival between Colon and Rectal Cancer from SEER data. PLoS One. 2013;8:e78709. doi: 10.1371/journal.pone.0078709. - DOI - PMC - PubMed
    1. Bhangu A, Ali SM, Darzi A, Brown G, Tekkis P. Meta-analysis of survival based on resection margin status following surgery for recurrent rectal cancer. Color Dis. 2012;14:1457–1466. doi: 10.1111/j.1463-1318.2012.03005.x. - DOI - PubMed

LinkOut - more resources