

Integrated analysis of lncRNAs and mRNAs by RNA-Seq in secondary hair follicle development and cycling (anagen, catagen and telogen) of Jiangnan cashmere goat (Capra hircus)
- PMID: 35524260
- PMCID: PMC9074311
- DOI: 10.1186/s12917-022-03253-0
Integrated analysis of lncRNAs and mRNAs by RNA-Seq in secondary hair follicle development and cycling (anagen, catagen and telogen) of Jiangnan cashmere goat (Capra hircus)
Abstract
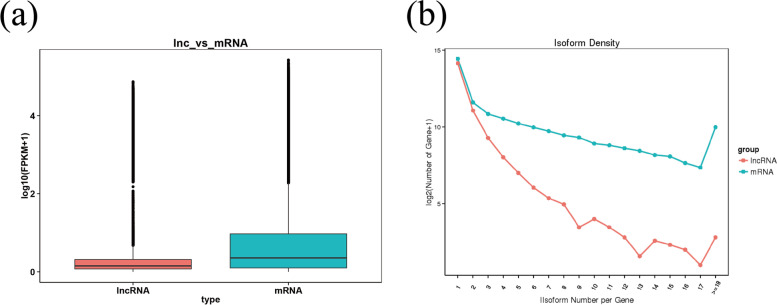
Background: Among the world's finest natural fiber composites is derived from the secondary hair follicles (SHFs) of cashmere goats yield one of the world's best natural fibres. Their development and cycling are characterized by photoperiodism with diverse, well-orchestrated stimulatory and inhibitory signals. Long non-coding RNA (lncRNAs) and mRNAs play important roles in hair follicle (HF) development. However, not many studies have explored their specific functions in cashmere development and cycling. This study detected mRNAs and lncRNAs with their candidate genes and related pathways in SHF development and cycling of cashmere goat. We utilized RNA sequencing (RNA-Seq) and bioinformatics analysis on lncRNA and mRNA expressions in goat hair follicles to discover candidate genes and metabolic pathways that could affect development and cycling (anagen, catagen, and telogen).
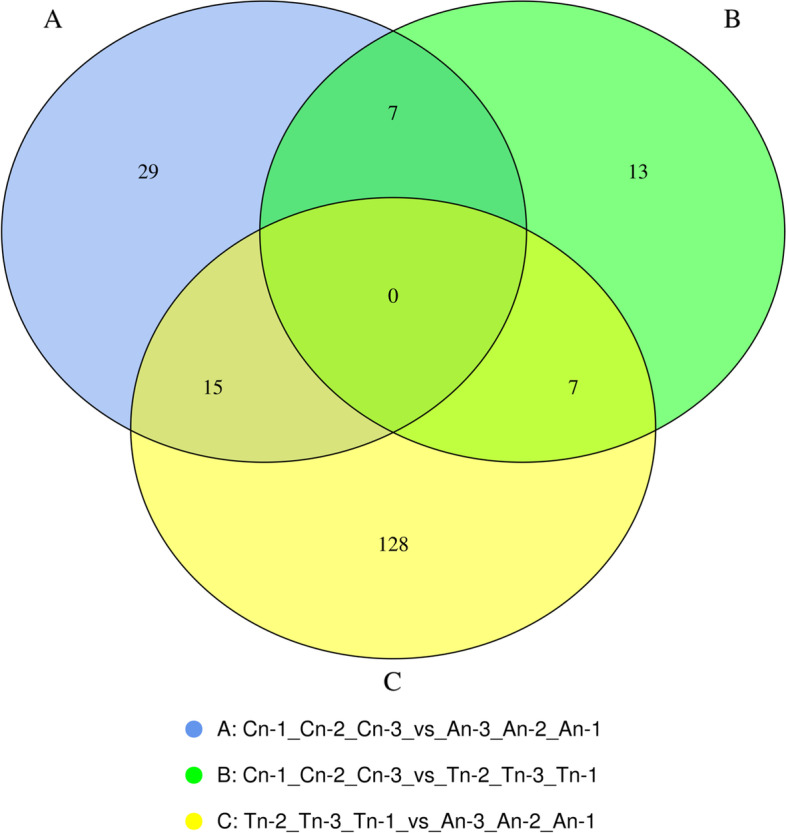
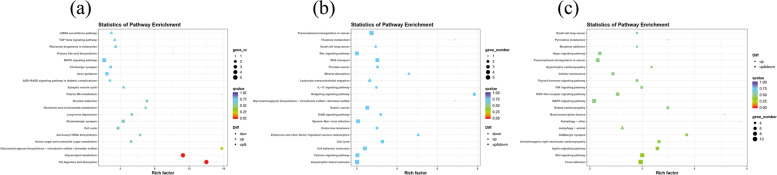
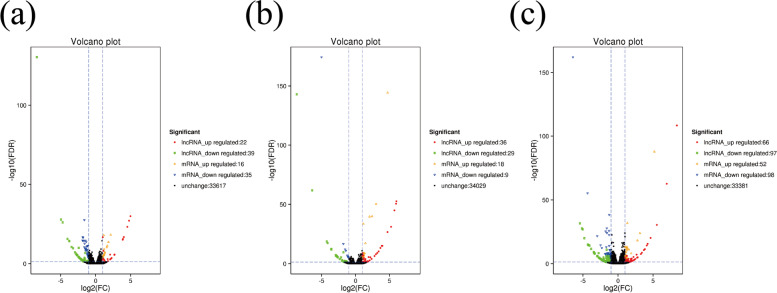
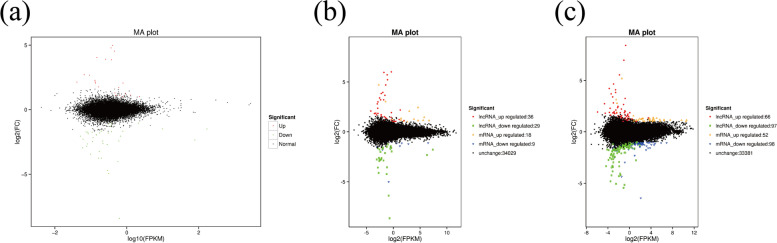
Results: We identified 228 differentially expressed (DE) mRNAs and 256 DE lncRNA. For mRNAs, catagen and anagen had 16 upregulated and 35 downregulated DEGs, catagen and telogen had 18 upregulated and 9 downregulated DEGs and telogen and anagen had 52 upregulated and 98 downregulated DEGs. LncRNA witnessed 22 upregulated and 39 downregulated DEGs for catagen and anagen, 36 upregulated and 29 downregulated DEGs for catagen and telogen as well as 66 upregulated and 97 downregulated DEGs for telogen and anagen. Several key genes, including MSTRG.5451.2, MSTRG.45465.3, MSTRG.11609.2, CHST1, SH3BP4, CDKN1A, GAREM1, GSK-3β, DEFB103A KRTAP9-2, YAP1, S100A7A, FA2H, LOC102190037, LOC102179090, LOC102173866, KRT2, KRT39, FAM167A, FAT4 and EGFL6 were shown to be potentially important in hair follicle development and cycling. They were related to, WNT/β-catenin, mTORC1, ERK/MAPK, Hedgehog, TGFβ, NFkB/p38MAPK, caspase-1, and interleukin (IL)-1a signaling pathways.
Conclusion: This work adds to existing understanding of the regulation of HF development and cycling in cashmere goats via lncRNAs and mRNAs. It also serves as theoretical foundation for future SHF research in cashmere goats.
Keywords: Differentially expressed genes; Goat hair follicles; Photoperiodism; Signaling pathways.
© 2022. The Author(s).
Conflict of interest statement
The authors declare no conflict of interest.
Figures


Similar articles
-
Exploring differentially expressed genes by RNA-Seq in cashmere goat (Capra hircus) skin during hair follicle development and cycling.PLoS One. 2013 Apr 30;8(4):e62704. doi: 10.1371/journal.pone.0062704. Print 2013. PLoS One. 2013. PMID: 23638136 Free PMC article.
-
Time-course RNA-seq analysis reveals stage-specific and melatonin-triggered gene expression patterns during the hair follicle growth cycle in Capra hircus.BMC Genomics. 2022 Feb 16;23(1):140. doi: 10.1186/s12864-022-08331-z. BMC Genomics. 2022. PMID: 35172715 Free PMC article.
-
Integrated analysis of coding genes and non-coding RNAs during hair follicle cycle of cashmere goat (Capra hircus).BMC Genomics. 2017 Oct 11;18(1):767. doi: 10.1186/s12864-017-4145-0. BMC Genomics. 2017. PMID: 29020916 Free PMC article.
-
Melatonin's Role in Hair Follicle Growth and Development: A Cashmere Goat Perspective.Int J Mol Sci. 2025 Mar 21;26(7):2844. doi: 10.3390/ijms26072844. Int J Mol Sci. 2025. PMID: 40243438 Free PMC article. Review.
-
Integrative and Mechanistic Approach to the Hair Growth Cycle and Hair Loss.J Clin Med. 2023 Jan 23;12(3):893. doi: 10.3390/jcm12030893. J Clin Med. 2023. PMID: 36769541 Free PMC article. Review.
Cited by
-
Expression patterns of housekeeping genes and tissue-specific genes in black goats across multiple tissues.Sci Rep. 2024 Sep 19;14(1):21896. doi: 10.1038/s41598-024-72844-8. Sci Rep. 2024. PMID: 39300207 Free PMC article.
-
The Identification of a New Gene KRTAP 6-3 in Capra hircus and Its Potential for the Diameter Improvement of Cashmere Fibers.Genes (Basel). 2025 Jun 19;16(6):721. doi: 10.3390/genes16060721. Genes (Basel). 2025. PMID: 40565613 Free PMC article.
-
Deciphering the molecular drivers for cashmere/pashmina fiber production in goats: a comprehensive review.Mamm Genome. 2025 Mar;36(1):162-182. doi: 10.1007/s00335-025-10109-z. Epub 2025 Feb 4. Mamm Genome. 2025. PMID: 39904908 Review.
-
Regulation of secondary hair follicle cycle in cashmere goats by miR-877-3p targeting IGFBP5 gene.J Anim Sci. 2023 Jan 3;101:skad314. doi: 10.1093/jas/skad314. J Anim Sci. 2023. PMID: 37777862 Free PMC article.
-
Screening and expression validation of key proteins for secondary hair follicle growth in cashmere goats based on iTRAQ quantitative proteomics technology.Front Vet Sci. 2024 Oct 15;11:1441074. doi: 10.3389/fvets.2024.1441074. eCollection 2024. Front Vet Sci. 2024. PMID: 39474271 Free PMC article.
References
-
- Jiang H-Z, et al. Industry status of Chinese cashmere goat and analysis of its prospects. Anim Husb Feed Sci. 2009;10:100–103.
-
- Qiao X, et al. Discovery of differentially expressed genes in cashmere goat (Capra hircus) hair follicles by RNA sequencing. Genet Mol Res. 2016;15(3). 10.4238/gmr.15038589. - PubMed
MeSH terms
Substances
LinkOut - more resources
Full Text Sources
Other Literature Sources
Research Materials
Miscellaneous
