. 2022 May 6;21(1):109.
doi: 10.1186/s12943-022-01575-z.

M6A-mediated upregulation of circMDK promotes tumorigenesis and acts as a nanotherapeutic target in hepatocellular carcinoma

Affiliations

M6A-mediated upregulation of circMDK promotes tumorigenesis and acts as a nanotherapeutic target in hepatocellular carcinoma

Ashuai Du et al. Mol Cancer. .

Abstract

Background: Emerging evidence suggest the critical role of circular RNAs (circRNAs) in disease development especially in various cancers. However, the oncogenic role of circRNAs in hepatocellular carcinoma (HCC) is still largely unknown.

Methods: RNA sequencing was performed to identify significantly upregulated circRNAs in paired HCC tissues and non-tumor tissues. CCK-8 assay, colony formation, transwell, and xenograft mouse models were used to investigate the role of circRNAs in HCC proliferation and metastasis. Small interfering RNA (siRNA) was used to silence gene expression. RNA immunoprecipitation, biotin pull-down, RNA pull-down, luciferase reporter assay and western blot were used to explore the underlying molecular mechanisms.

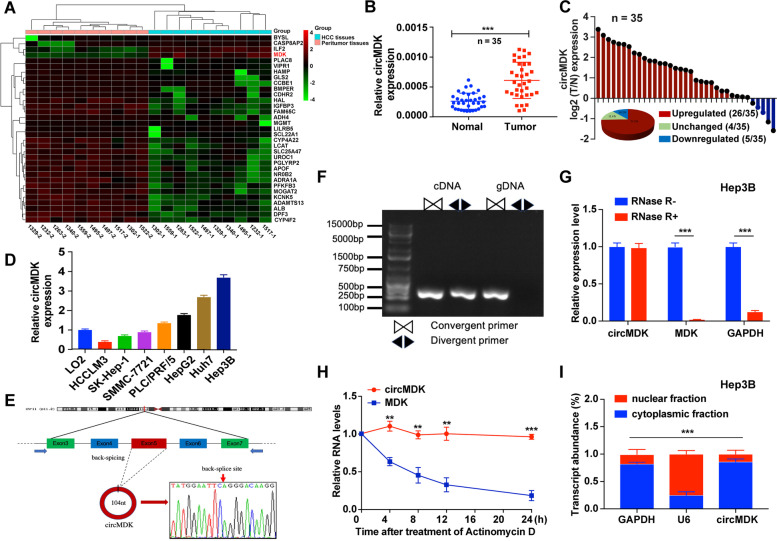
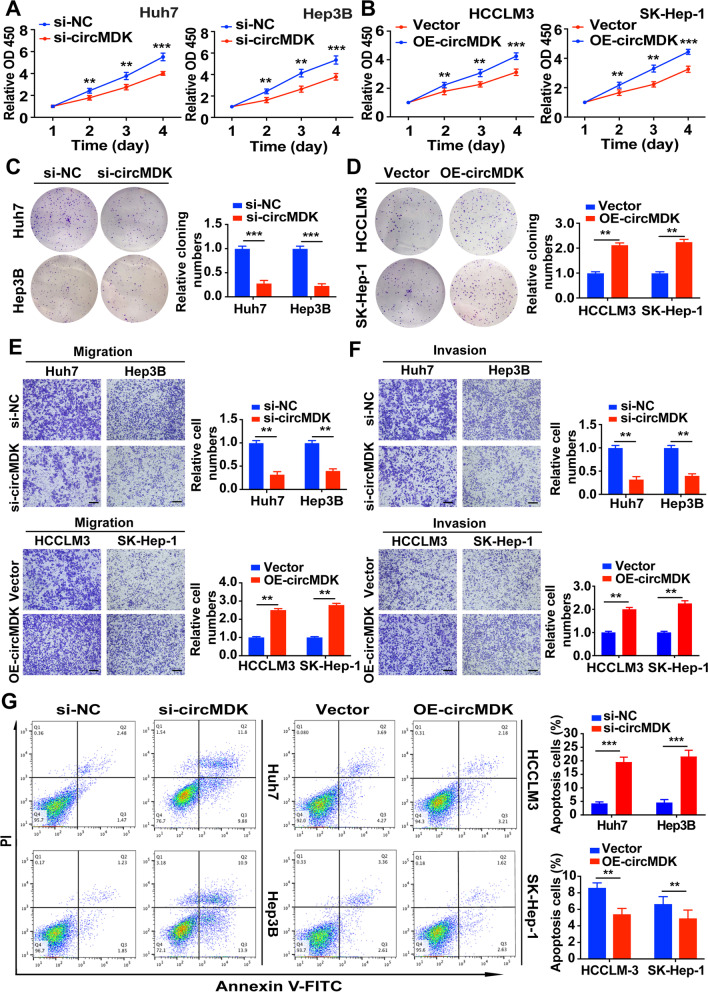
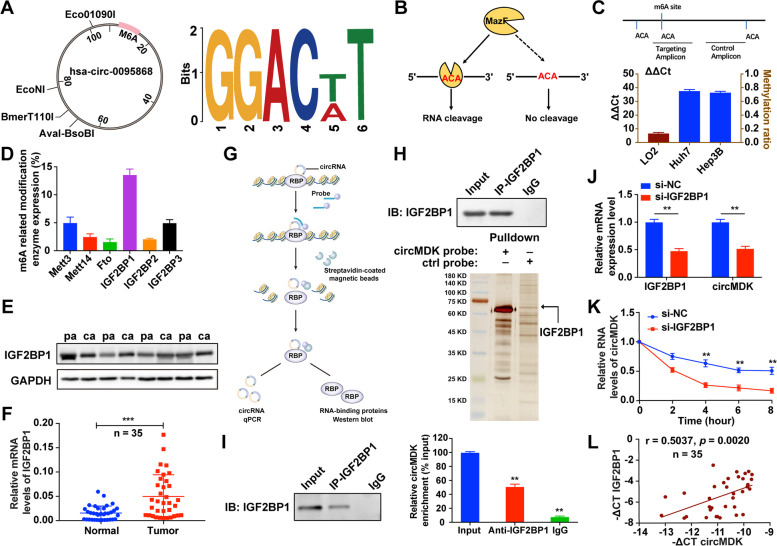
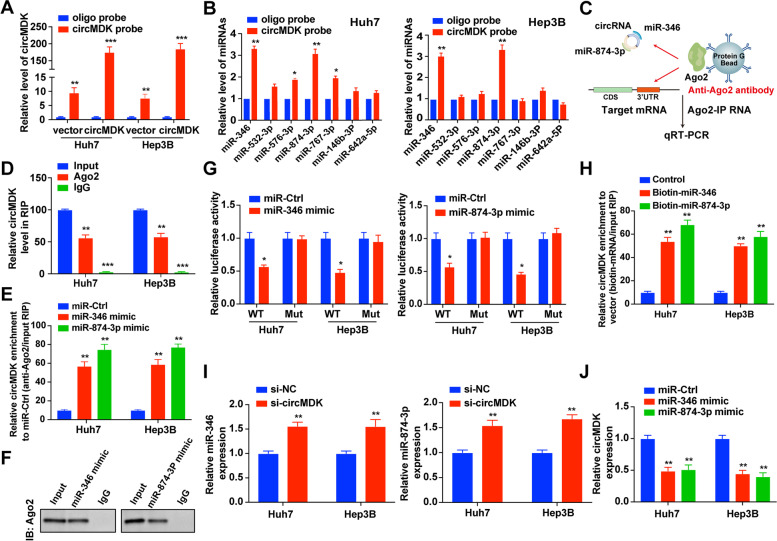
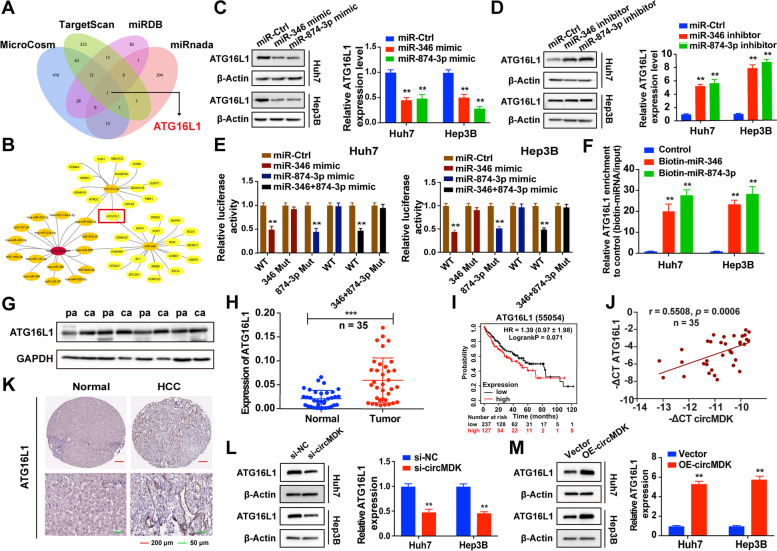
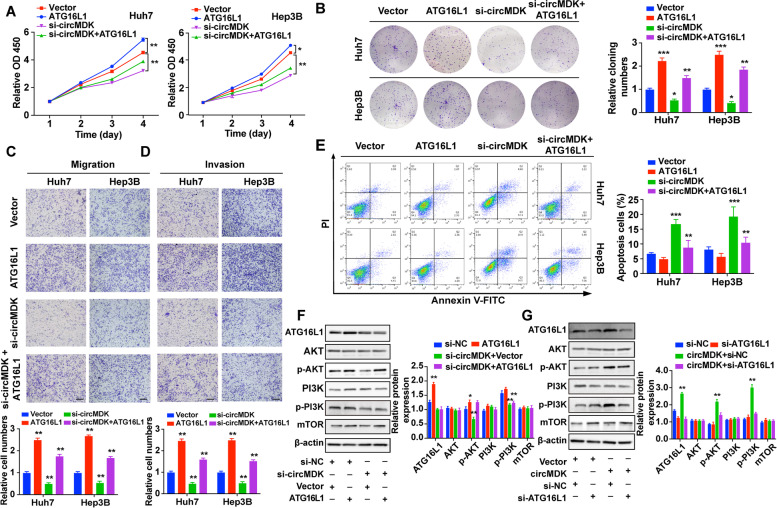
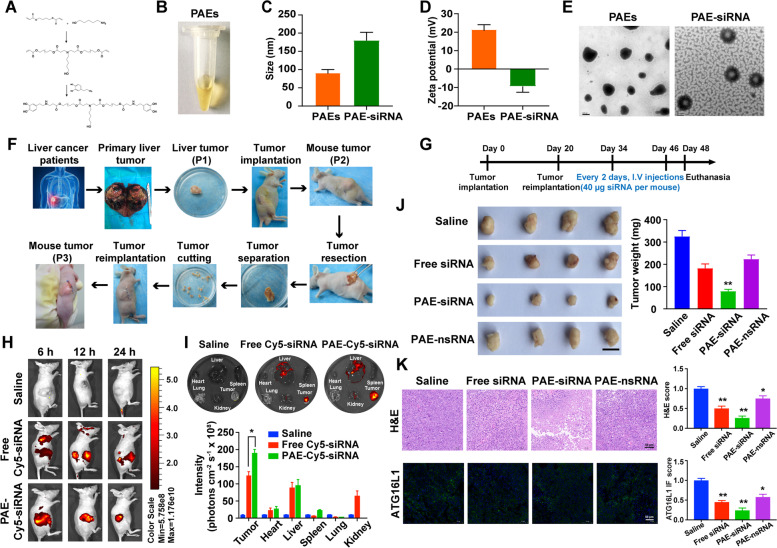
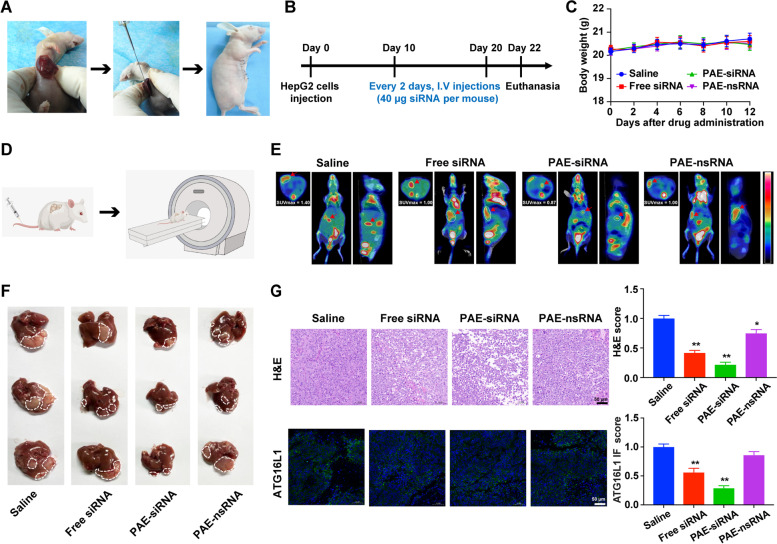
Results: Hsa_circ_0095868, derived from exon 5 of the MDK gene (named circMDK), was identified as a new oncogenic circRNA that was significantly upregulated in HCC. The upregulation of circMDK was associated with the modification of N6-methyladenosine (m6A) and poor survival in HCC patients. Mechanistically, circMDK sponged miR-346 and miR-874-3p to upregulate ATG16L1 (Autophagy Related 16 Like 1), resulting to the activation of PI3K/AKT/mTOR signaling pathway to promote cell proliferation, migration and invasion. Poly (β-amino esters) (PAEs) were synthesized to assist the delivery of circMDK siRNA (PAE-siRNA), which effectively inhibited tumor progression without obvious adverse effects in four liver tumor models including subcutaneous, metastatic, orthotopic and patient-derived xenograft (PDX) models.

Conclusions: CircMDK could serve as a potential tumor biomarker that promotes the progression of HCC via the miR-346/874-3p-ATG16L1 axis. The PAE-based delivery of siRNA improved the stability and efficiency of siRNA targeting circMDK. The PAE-siRNA nanoparticles effectively inhibited HCC proliferation and metastasis in vivo. Our current findings offer a promising nanotherapeutic strategy for the treatment of HCC.

Keywords: ATG16L1; Apoptosis; Hepatocellular carcinoma (HCC); IGF2BP1; N6-methyladenosine (m6A); Nanoparticles (NPs); Poly (β-amino esters) (PAEs); circRNA.


Conflict of interest statement

The authors declare that they have no competing interests.

Figures

Fig. 1
Fig. 1
CircMDK expression profiling reveals that circMDK is upregulated in HCC. A Clustered heat map of the 42 dysregulated circRNAs in HCC tumor and peritumor tissues. The red and green strips represented high and low expression, respectively. B Analysis for RNA levels of circMDK in 35 paired samples of HCC were determined by qRT-PCR. The error bars represent standard deviation (SD) (n = 35). ***p < 0.001. C Histogram and pie chart of the proportions of HCC samples in which circMDK expression was upregulated (26/35, 74.3%, red), downregulated (4/35, 14.2%, blue), or no change (5/35, 11.4%, green), respectively. Log2 (T/N expression) value > 1 as significantly higher expression, < -1 as lower expression, and between -1 and 1 as no significant change. T, tumorous tissue; N, nontumorous tissue. D Analysis for RNA levels of circMDK in HCC cell lines (HCCLM3, SK-Hep-1, SMMC-7721, PLC/PRF/5, HepG2, Huh7 and Hep3B) and normal liver cell line (LO2). E The back-splice junction site of circMDK was identified by Sanger sequencing. F PCR analysis for circMDK and MDK in complementary DNA (cDNA) and genomic DNA (gDNA). G Analysis for RNA levels of circMDK and MDK after treated with RNase R in Hep3B cells. ***p < 0.001. H qRT-PCR for the abundance of circMDK and MDK mRNA in Huh7 cells treated with Actinomycin D at the indicated time points. **p < 0.01; ***p < 0.001. I Levels of circMDK in the nuclear and cytoplasmic fractions of Hep3B cells. ***p < 0.001. Data are shown as mean ± SD of three independent experiments
Fig. 2
Fig. 2
circMDK promotes cell proliferation, migration, invasion and impedes apoptosis in HCC cells. A Cell proliferation assays for Huh7 and Hep3B cells with silencing circMDK. **p < 0.01; ***p < 0.001. B Cell proliferation assays for HCCLM3 and SK-Hep-1 cells with overexpressing circMDK. **p < 0.01; ***p < 0.001. C Colony formation assays for Huh7 and Hep3B cells with silencing circMDK. ***p < 0.001. D Colony formation assays for HCCLM3 and SK-Hep-1 cells with overexpressing circMDK. **p < 0.01. E Cell migration analysis of Huh7 and Hep3B cells with silencing circMDK (top) and HCCLM3 and SK-Hep-1 cells with overexpressing circMDK (bottom). **p < 0.01. F Cell invasion analysis of Huh7 and Hep3B cells with silencing circMDK (top) and HCCLM3 and SK-Hep-1 cells with overexpressing circMDK (bottom). **p < 0.01. G Cell apoptosis analysis of Huh7 and Hep3B cells with silencing circMDK (left) and HCCLM3 and SK-Hep-1 cells with overexpressing circMDK (right). ***p < 0.001; **p < 0.01. Data are shown as mean ± SD of three independent experiments
Fig. 3
Fig. 3
IGF2BP1 identifies m6A modified circMDK and improves the transcript stability of circMDK. A Bioinformatics analysis showed that there were m6A modification sites in circMDK. B The schematic diagram of MazF-PCR restriction endonuclease digestion. C The abundance of m6A modified circMDK in cells was detected by MazF-PCR. D The expression level of methylation-related proteins was verified by qRT-PCR. E The protein levels of IGF2BP1 in four paired HCC samples. pa: para-carcinoma tissues; ca: cancer tissues. F The qRT-PCR analysis of IGF2BP1 in 35 paired HCC samples. ***p < 0.001. G The schematic diagram of RIP assay. H Identification of the circMDK-protein complex pulled down by circMDK junction probe with protein extracts from Hep3B cells. The arrow indicates IGF2BP1. I RIP assays showing the association of IGF2BP1 with circMDK. Left, IP efficiency of IGF2BP1-antibody shown in western blotting. Right, relative enrichment representing RNA levels associated with IGF2BP1 relative to an input control. IgG antibody served as a control. **p < 0.01. J Transcript levels of IGF2BP1 and circMDK in negative control and si-IGF2BP1 HCC cells. **p < 0.01. K Reduction of circMDK RNA stability in IGF2BP1 knockdown HCC cells as compared with control. Cells were treated with Actinomycin D at the indicated time points. Error bars indicate SD. The t test was applied to analyze the statistical significance between two groups. **p < 0.01. L Correlation analysis revealed positive correlation between the levels of circMDK and IGF2BP1 mRNA in the tumorous tissues of the 35 HCC patients. Data are shown as mean ± SD of three independent experiments
Fig. 4
Fig. 4
CircMDK acts as a ceRNA and sponges miR-346 and miR-874-3p. A Lysates from Huh7 and Hep3B cells with circMDK overexpression were subjected to biotinylated-circMDK pull-down assay and the expression levels of circMDK were measured by qRT-PCR. **p < 0.01; ***p < 0.001. B Relative expression of candidate miRNAs was quantified by qRT-PCR after the biotinylated-circMDK pull-down assay in HCC cells. *p < 0.05; **p < 0.01. C Schematic diagram of the Ago2-RIP assay. D Fold enrichment of circMDK in Huh7 and Hep3B cells. **p < 0.01; ***p < 0.001. E Enrichment of circMDK in Huh7 and Hep3B cells transfected with miR-346, miR-874-3p mimic, or miR-Ctrl. **p < 0.01. F Ago2 protein immunoprecipitated by Ago2 antibody or IgG was detected by western blot analysis. G Luciferase activity in HCC cells co-transfected with WT or mutant (346 Mut/874-3p Mut) circMDK plasmid together with miR-346 or miR-874-3p mimic or miR-Ctrl. *p < 0.05. H Enrichment of circMDK pulled down by biotin-miR-346, biotin-miR-874-3p, or control. **p < 0.01. I Relative levels of miR-346 and miR-874-3p in HCC cells transfected with si-circMDK or control. **p < 0.01. J Relative levels of circMDK in HCC cells transfected with miR-346, miR-874-3p mimics or miR-Ctrl. **p < 0.01. Data are shown as mean ± SD of three independent experiments. Ctrl, negative control; Mut, mutant type; WT, wild type
Fig. 5
Fig. 5
CircMDK functions as a decoy of miR-346 and miR-874-3p to increase ATG16L1 expression. A ceRNA analysis for circMDK by Cytoscape. B Schematic illustration of overlapping target mRNAs of miR-346 and miR-874-3p predicted by MicroCosm, TargetScan, miRDB and miRanda databases. C Relative protein (left) and mRNA (right) levels of ATG16L1 in HCC cells transfected with miR-Ctrl, miR-346 mimic, and miR-874-3p mimic. **p < 0.01. D Relative protein (left) and mRNA (right) levels of ATG16L1 in HCC cells transfected with miR-Ctrl, miR-346 inhibitor, and miR-874-3p inhibitor. **p < 0.01. E Luciferase assay in HCC cells co-transfected WT or mutant (346 Mut/874-3p Mut) ATG16L1 plasmid together with miR-346 and miR-874-3p mimic or miR-Ctrl. **p < 0.01. F Enrichment of ATG16L1 pulled down by biotin-labeled miR-346 and miR-874-3p, or negative control. **p < 0.01. G Relative protein levels of ATG16L1 in four paired HCC samples. pa: para-carcinoma tissues; ca: cancer tissues. H Relative mRNA levels of ATG16L1 in 35 paired HCC samples. mRNA and protein levels of ATG16L1 in four paired HCC samples. ***p < 0.001. I Kaplan–Meier analysis revealed the prognostic values of ATG16L1. J Correlation analysis revealed positive correlation between the levels of circMDK and ATG16L1 mRNA in the tumorous tissues of the 35 HCC patients. K The expression of ATG16L1 in human HCC tissue compared to normal liver tissue. L Relative protein (left) and mRNA (right) levels of ATG16L1 in HCC cells transfected with si-circMDK or si-NC. **p < 0.01. M Relative protein (left) and mRNA (right) levels of ATG16L1 in HCC cells transfected with circMDK overexpression or its empty vector. **p < 0.01. Data are shown as mean ± SD of three independent experiments
Fig. 6
Fig. 6
ATG16L1 is responsible for circMDK-mediated proliferation, migration, invasion and apoptosis. A Cell proliferation assay for HCC cells with ATG16L1 overexpression and circMDK knockdown. *p < 0.05; **p < 0.01. B Representative images (left) and quantification (right) of the colony formation assay in HCC cells. *p < 0.05; **p < 0.01; ***p < 0.001. C Representative images (top) and quantification (bottom) of migration assays in HCC cells. **p < 0.01. D Representative images (top) and quantification (bottom) of invasion assays in HCC cells. **p < 0.01. E Representative images (left) and quantification (right) of apoptosis assays in HCC cells. **p < 0.01; ***p < 0.001. F Expression changes (left) and quantification (right) of ATG16L1, AKT, p-AKT, PI3K, p-PI3K, mTOR in Hep3B cells co-transfected with si-circMDK together with ATG16L1 overexpression or (G) si-ATG16L1 together with circMDK overexpression. *p < 0.05; **p < 0.01. H Schematic diagram of circMDK-miR-346/miR-874-3p-ATG16L1 axis. Data are shown as mean ± SD of three independent experiments
Fig. 7
Fig. 7
Characteristics and antitumor effects of PAE-siRNA complex in patient-derived xenograft (PDX) model. A Synthesis protocol and B appearance of positively charged PAEs nanoparticles. C Particle size of the PAEs and PAE-siRNA. D Zeta potential of the PAEs and PAE-siRNA. E TEM images of PAEs and PAE-siRNA. F Scheme of the establishment of PDX tumor model. Patient-derived primary liver tumors (P1) were cut into fragments with sizes of 3*3*3 mm and transplanted into the subcutaneous tissue of the Balb/c nude mice (P2). Then, tumor tissues of P2 were retransplanted into the subcutaneous tissue of the Balb/c nude mice (P3) using the same method. G Schematic illustration of PDX model establishment and treatment. H Biodistribution of PAE-siRNA complex in vivo. I Biodistribution of different Cy5-siRNA injections (n = 3) on major organs and tumors by ex vivo imaging after 24 h of treatment. *p < 0.05. J Representative images of the PDX tumors and tumor weight. Scale bar is 1 cm. **p < 0.01. K Representative images (left) and quantification (right) of H&E staining (top) and immunofluorescence (bottom) of ATG16L1. *p < 0.05; **p < 0.01. Scale bars are 50 µm
Fig. 8
Fig. 8
Antitumor effects of PAE-siRNA complex in orthotopic model. A Scheme of the establishment of orthotopic tumor model. HepG2 cells were injected into the lower lobe of liver of Balb/c nude mice to form orthotopic tumors. B Schematic illustration of orthotopic model establishment and treatment. C Changes of mouse body weight during experimental period. Data are shown as means ± SD (n = 6). D Schematic cartoon of PET/CT detection in mice. E Representative images of PET/CT scans from each group. Images of mice were acquired 24 h after intravenous injection of 18F-FDG. Shown from left to right are the axial, coronal, and lateral views. The white circles and red arrows indicated the regions of hepatic tumors. Standardized uptake values (SUV) were examined by 18F-FDG. F Representative images of the HepG2 orthotopic HCC tumors. The white dotted lines indicate tumor regions (n = 6). G Representative images (left) and quantification (right) of liver tumor sections stained with H&E (top) and immunofluorescence (bottom) of ATG16L1. *p < 0.05; **p < 0.01. Scale bars are 50 µm

Similar articles

Cited by

References

    1. Wei L, et al. The emerging role of microRNAs and long noncoding RNAs in drug resistance of hepatocellular carcinoma. Mol Cancer. 2019;18:147. doi: 10.1186/s12943-019-1086-z. - DOI - PMC - PubMed
    1. Huang A, Zheng H, Wu Z, Chen M, Huang Y. Circular RNA-protein interactions: functions, mechanisms, and identification. Theranostics. 2020;10:3503–3517. doi: 10.7150/thno.42174. - DOI - PMC - PubMed
    1. Zhou WY, et al. Circular RNA: metabolism, functions and interactions with proteins. Mol Cancer. 2020;19:172. doi: 10.1186/s12943-020-01286-3. - DOI - PMC - PubMed
    1. Fan L, Cao Q, Liu J, Zhang J, Li B. Circular RNA profiling and its potential for esophageal squamous cell cancer diagnosis and prognosis. Mol Cancer. 2019;18:16. doi: 10.1186/s12943-018-0936-4. - DOI - PMC - PubMed
    1. Wei WS, et al. LRPPRC regulates redox homeostasis via the circANKHD1/FOXM1 axis to enhance bladder urothelial carcinoma tumorigenesis. Redox Biol. 2021;48:102201. doi: 10.1016/j.redox.2021.102201. - DOI - PMC - PubMed

Publication types