. 2022 Aug 3;30(8):2828-2843.
doi: 10.1016/j.ymthe.2022.04.022. Epub 2022 May 5.

KLF16 enhances stress tolerance of colorectal carcinomas by modulating nucleolar homeostasis and translational reprogramming

Affiliations

KLF16 enhances stress tolerance of colorectal carcinomas by modulating nucleolar homeostasis and translational reprogramming

Xiao-Dan Ma et al. Mol Ther. .

Abstract

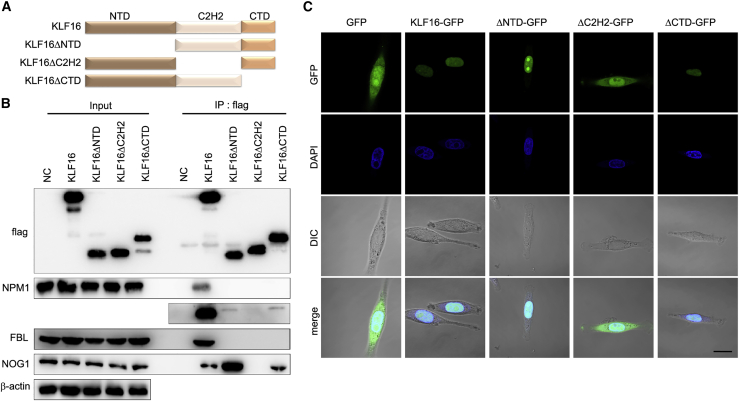
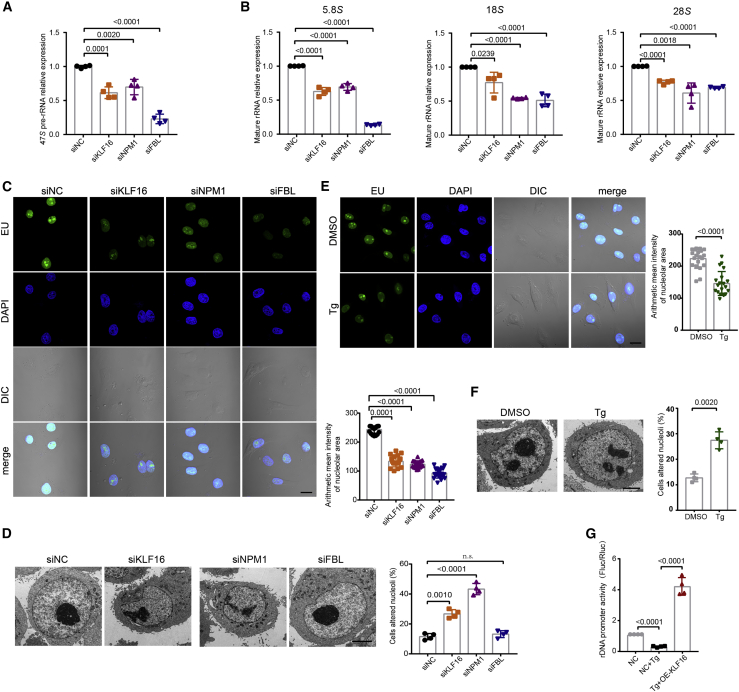
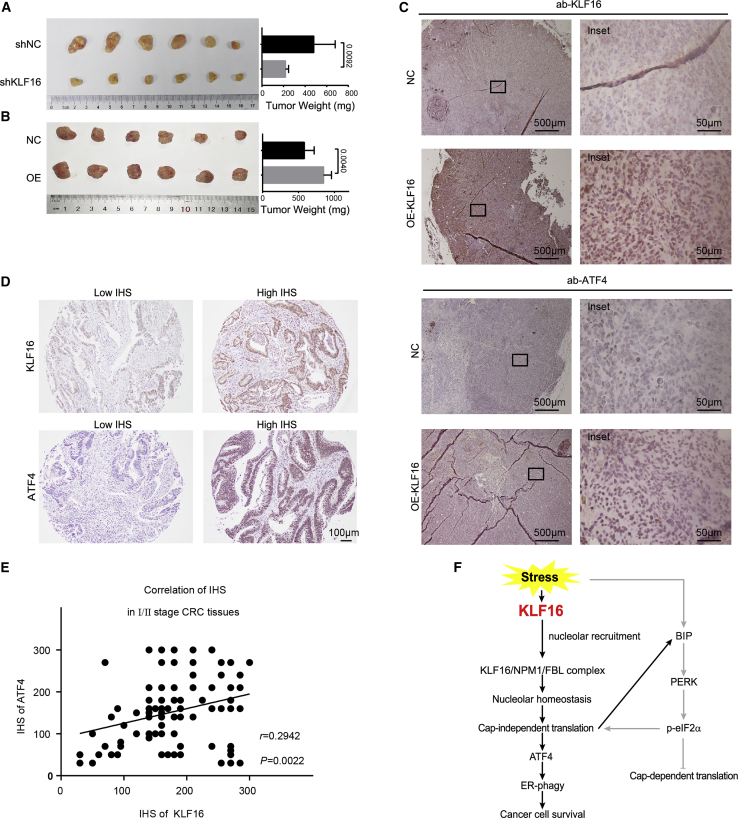
Translational reprogramming is part of the unfolded protein response (UPR) during endoplasmic reticulum (ER) stress, which acts to the advantage of cancer growth and development in different stress conditions, but the mechanism of ER stress-related translational reprogramming in colorectal carcinoma (CRC) progression remains unclear. Here, we identified that Krüppel-like factor 16 (KLF16) can promote CRC progression and stress tolerance through translational reprogramming. The expression of KLF16 was upregulated in CRC tissues and associated with poor prognosis for CRC patients. We found that ER stress inducers can recruit KLF16 to the nucleolus and increase its interaction with two essential proteins for nucleolar homeostasis: nucleophosmin1 (NPM1) and fibrillarin (FBL). Moreover, knockdown of KLF16 can dysregulate nucleolar homeostasis in CRC cells. Translation-reporter system and polysome profiling assays further showed that KLF16 can effectively promote cap-independent translation of ATF4, which can enhance ER-phagy and the proliferation of CRC cells. Overall, our study unveils a previously unrecognized role for KLF16 as an ER stress regulator through mediating translational reprogramming to enhance the stress tolerance of CRC cells and provides a potential therapeutic vulnerability.

Keywords: ER stress; ER-phagy; KLF16; PERK pathway; carcinogenesis; colorectal cancer; nucleolar homeostasis; stress tolerance; translational reprogramming.


Conflict of interest statement

Declaration of interests The authors declare no competing interests.

Figures

Figure 1
Figure 1
KLF16 regulates UPR activity and its expression in CRC (A) KLF16 expression was knocked down by specific siRNA. After 48 h of the transfection, siNC and siKLF16 SW480 cells were treated with 100 nM thapsigargin (Tg) for the indicated time points, followed by western blotting (WB) assays, with β-actin as loading control. (B) KLF16 expression was knocked down by specific siRNA. After 24 h of the transfection, siNC and siKLF16 SW480 cells were treated with tunicamycin (0, 5, 5 × 10, 5×10², 5×10³, and 5 × 104 ng) or Tg (0, 5 × 10−1, 5, 5 × 10, 5×10², and 5 × 103 nM) for 72 h, and the cell growth rate was tested by the CCK-8 assay. Data represent the mean ± SD from n = 3 biologically independent experiments. Statistical significance was determined by a 2-way ANOVA. (C) Quantitative real-time-PCR analysis of KLF16 mRNA expression in 30 CRC tissues and matched paracancerous tissues. Statistical significance was determined by a 2-tailed paired Student’s t test. (D) WB assays of KLF16 protein expression in 12 CRC tissues and matched paracancerous tissues. β-Actin was used as loading control. (E) Representative IHC staining for KLF16 in CRC tissues and matched paracancerous tissues. Scale bar, 100 μm (20 μm for insets). (F) Kaplan-Meier analysis of OS in patients with stages II to III CRC with low versus high expression of KLF16 protein from SYSUCC cohorts (n = 145). Statistical significance was determined by a log rank test.
Figure 2
Figure 2
KLF16 interacts with NPM1 and FBL (A) FLAG-KLF16 overexpression plasmids (OE-KLF16) and normal controlled plasmids (NC) were transfected into 293T cells. After 48 h of the transfection, cells were subjected to IP assay. Silver staining was carried out after IP assays. The arrows indicate the additional band present in OE-KLF16 cell extracts. (B) Anti-KLF16 antibody was used for endogenous IP assays in cell extracts from exponentially growing SW480, DLD-1, or 293T cells. Mouse immunoglobulin G (IgG) was used as a negative control. (C) Immunofluorescence (IF) staining of SW480 cells treated with DMSO or Tg and stained with anti-NPM1 (green) and anti-KLF16 (red) antibodies. DAPI staining shows nuclei. Line graphs represent signal intensity along the arrow bars for each protein. Scale bar, 20 μm (5 μm for insets). (D) IF staining of SW480 cells treated with DMSO or Tg and stained with anti-FBL (green) and anti-KLF16 (red) antibodies. DAPI staining shows nuclei. Line graphs represent signal intensity along the arrow bars for each protein. Scale bar, 20 μm (5 μm for insets). (E) OE-KLF16 and NC plasmids were transfected into 293T cells. After 48 h of the transfection, cells were subjected to IP assay followed by WB assays with the indicated antibodies. (F) Endogenous IP of NPM1 antibody in siNC and siKLF16 SW480 cells followed by WB assays with the indicated antibodies. (G) After 12h of the transfection with FLAG- and myc-tagged NPM1-expressing plasmids, 293T cells were transfected with siRNA. After 36 h of the transfection, cells subjected to IP assay of the exogenously expressed FLAG-NPM1 to show the interactions between NPM1 proteins in siNC and siKLF16 cells.
Figure 3
Figure 3
The role of KLF16 mutants in KLF16/NPM1/FBL complex (A) Domain organization of the KLF16 protein and its truncated mutants. (B) KLF16 or KLF16-mutant plasmids were transfected into 293T cells. IP assays were carried out 48 h after transfection and followed by WB assays with the indicated antibodies. (C) Laser scanning confocal microscopy was used 48 h after transfection to monitor the distribution of GFP-tagged KLF16 with full-length or truncated mutants. Scale bar, 20 μm.
Figure 4
Figure 4
KLF16 can regulate nucleolar homeostasis (A) The relative expression levels of the 47S pre-rRNAs were measured by quantitative real-time-PCR in SW480 cells transfected with the indicated siRNAs. β-Actin was used as a housekeeping gene for normalization. Data represent the mean ± SD from n = 4 biologically independent experiments. Statistical significance was determined by a two-tailed unpaired Student’s t test. (B) The relative expression levels of the cytoplasmic rRNA were measured by quantitative real-time-PCR in SW480 cells transfected with the indicated siRNAs. β-Actin was used as a housekeeping gene for normalization. Data represent the mean ± SD from n = 4 biologically independent experiments. Statistical significance was determined by a two-tailed unpaired Student’s t test. (C) SW480 cells transfected with the indicated siRNAs. After 36 h of the transfection, EU-labeled nascent RNA was evaluated by IF. DAPI staining shows nuclei. Scale bar, 20 μM. Arithmetic mean intensity of the nucleolar area of EU staining was calculated from 20 randomly selected cells for each group. Statistical significance was determined by a 2-tailed unpaired Student’s t test. (D) Representative transmission electron micrographs showing the nucleolus in SW480 cells transfected with the indicated siRNAs. Scale bar, 5 μM. Percentage of SW480 cells with altered nucleoli after transfection with the indicated siRNAs. Statistical significance was determined by a 2-tailed unpaired Student’s t test. (E) EU-labeled nascent RNA was measured by IF in SW480 cells with or without Tg treatment. DAPI staining shows nuclei. Scale bar, 20 μM. Arithmetic mean intensity of the nucleolar area of EU staining was calculated from 20 randomly selected cells for each group. Statistical significance was determined by a 2-tailed unpaired Student’s t test. (F) Representative transmission electron micrographs showing the nucleolus in SW480 cells treated with or without Tg. Scale bar, 5 μM. Percentage of SW480 cells with altered nucleoli with or without Tg treatment. Statistical significance was determined by a 2-tailed unpaired Student’s t test. (G) Luciferase activity of human rDNA promoter was measured in NC and OE-KLF16 SW480 cells with or without Tg treatment. Statistical significance was determined by a 2-tailed unpaired Student’s t test.
Figure 5
Figure 5
KLF16 regulates cap-independent translation activity of specific genes in the UPR (A) Diagram of the translation-reporter plasmid testing cap-independent translation. (B) ATF4 translation-reporter plasmids were transfected into SW480 cells or DLD-1 cells. After 12 h of the first transfection, the indicated siRNAs were transfected. Cap-independent translation activity of ATF4 was measured 36 h after the second transfection by using dual-luciferase assays. Data represent the means ± SDs from n = 3 biologically independent experiments. Statistical significance was determined by a 2-tailed Student’s t test. (C) ATF4 translation-reporter plasmids and OE plasmids were co-transfected into SW480. After 12 h of the first transfection, the indicated siRNAs were transfected. Then, cap-independent translation activity of ATF4 was measured 36 h after the second transfection by using dual-luciferase assays. Data represent the means ± SDs from n = 3 biologically independent experiments. Statistical significance was determined by a 2-tailed unpaired Student’s t test. (D and E) Polysome of the SW480 (D) and DLD-1 (E) cells with Tg treatment were extracted and subjected to a 10%–50% sucrose gradient by ultracentrifugation. Twelve polysome fractions were collected from top to bottom, followed by RNA extraction. ATF4 and GAPDH mRNA expression in each fraction was determined by quantitative real-time-PCR (upper) and visualized by DNA agarose gel (lower). The relative amounts of non-polysome (fractions 1–4), light polysome (fractions 5–8), and heavy polysome (fractions 9–12) were derived from 3 independent experiments and shown as means ± SDs. Statistical significance was determined by a 2-tailed unpaired Student’s t test. (F) The overview of polysome profiling assays. KLF16 expression was knocked down by specific siRNA. After 36 h of the transfection, siNC and siKLF16 SW480 cells were exposed to Tg treatment or not. (G) SW480 cells were transfected with indicated siRNAs. After 48 h of transfection, global protein synthesis was quantified by puromycylation assay. (H) SW480 cells transfected with the indicated siRNAs. After 48 h of transfection, cells were treated with or without Tg and followed by WB assays.
Figure 6
Figure 6
KLF16 upregulates ER-phagy in the UPR (A) Diagram of ssRFP-GFP-KDEL reporter of ER-phagy. (B) After 12 h of the transfection with ssRFP-GFP-KDEL plasmids, SW480 cells were then transfected with indicated siRNA. After 24 h of the transfection, cells were exposed to glucose starvation conditions for 30 h. Representative images and number of ssRFP+/GFP spots in siNC and siKLF16 SW480 cells during ER stress. The means ± SDs of the quantification of 30 cells from 3 biologically independent experiments are shown. Statistical significance was determined by a 2-tailed unpaired Student’s t test. Scale bar, 10 μm. (C) ssRFP-GFP-KDEL plasmids and OE-KLF16 plasmids were transfected into SW480 cells. After 12 h of the first transfection, cells were then transfected with indicated siRNA. After 24 h of the second transfection, cells were exposed to glucose starvation conditions for 30 h. Representative images and number of ssRFP+/GFP spots in NC or OE-KLF16 SW480 cells with or without ATF4 knockdown during ER stress. The means ± SDs of the quantification of 30 cells from 3 biologically independent experiments are shown. Statistical significance was determined by a 2-tailed unpaired Student’s t test. Scale bar, 10 μm . (D) CCK-8 assays assessed the proliferative capacity of NC or OE-KLF16 SW480 cells with or without ATF4 knockdown. Data represent the means ± SDs from n = 4 biologically independent experiments. Statistical significance was determined by a 2-way ANOVA. (E).ssRFP-GFP-KDEL plasmids and indicated plasmids were transfected into SW480 cells. After 12 h of the first transfection, cells were then transfected with indicated siRNA. After 24 h of the second transfection, cells were exposed to glucose starvation condition for 30h. Representative images and number of ssRFP+/GFP- spots in SW480 cells. The mean  ±  SD of the quantification of 30 cells from 3 biologically independent experiments is shown. Statistical significance was determined by a two-tailed unpaired Student’s t test. Scale bar, 10 µm.
Figure 7
Figure 7
ATF4 is correlated with KLF16 in xenograft and CRC tissue samples (A) 3 × 106 DLD-1 cells with lentivirus-mediated stable knockdown of KLF16 were implanted into nude mice (n = 6) for xenograft tumor models. Images and weights of the tumors are presented. Data represent the means ± SDs of the tumor weight. Statistical significance was determined by a 2-tailed unpaired Student’s t test. (B) 3 × 106 DLD-1 cells with lentivirus-mediated stable OE of KLF16 were implanted into nude mice (n = 6) for xenograft tumor models. Images and weights of the tumors are presented. Data represent the means ± SDs of the tumor weight. Statistical significance was determined by a 2-tailed unpaired Student’s t test. (C) Representative IHC staining for KLF16 and ATF4 in CRC xenograft tumor tissues samples. Scale bar, 100 μm. (D) Representative IHC staining images of low immunohistochemical score (IHS) and high IHS in stage I/II CRC tissues with the indicated antibodies. Scale bar, 100 μm. (E) The correlation of IHS was evaluated using Pearson’s correlation analysis. (F) Schematic depicting functions of KLF16 during ER stress.

References

    1. Chen X., Cubillos-Ruiz J.R. Endoplasmic reticulum stress signals in the tumour and its microenvironment. Nat. Rev. Cancer. 2021;21:71–88. doi: 10.1038/s41568-020-00312-2. - DOI - PMC - PubMed
    1. Cubillos-Ruiz J.R., Bettigole S.E., Glimcher L.H. Tumorigenic and immunosuppressive effects of endoplasmic reticulum stress in cancer. Cell. 2017;168:692–706. doi: 10.1016/j.cell.2016.12.004. - DOI - PMC - PubMed
    1. Hamanaka R., Bennett B.S., Bennett B., Cullinan S.B., Cullinan S., Diehl J.A., Diehl J. PERK and GCN2 contribute to eIF2α phosphorylation and cell cycle arrest after activation of the unfolded protein response pathway. Mol. Biol. Cell. 2005;16:5493–5501. doi: 10.1091/mbc.e05-03-0268. - DOI - PMC - PubMed
    1. Jackson R.J., Hellen C.U.T., Pestova T.V. The mechanism of eukaryotic translation initiation and principles of its regulation. Nat. Rev. Mol. Cell Biol. 2010;11:113–127. doi: 10.1038/nrm2838. - DOI - PMC - PubMed
    1. Jaud M., Philippe C., Di Bella D., Tang W., Pyronnet S., Laurell H., Mazzolini L., Rouault-Pierre K., Touriol C. Translational regulations in response to endoplasmic reticulum stress in cancers. Cells. 2020;9:540. doi: 10.3390/cells9030540. - DOI - PMC - PubMed

Publication types

MeSH terms

Substances

LinkOut - more resources