

Construction of lncRNA-miRNA-mRNA network based on ceRNA mechanism reveals the function of lncRNA in the pathogenesis of gout
- PMID: 35524416
- PMCID: PMC9169187
- DOI: 10.1002/jcla.24451
Construction of lncRNA-miRNA-mRNA network based on ceRNA mechanism reveals the function of lncRNA in the pathogenesis of gout
Abstract
Objective: To identify differentially expressed lncRNA, miRNA, and mRNA during the pathogenesis of gout, explore the ceRNA network regulatory mechanism of gout, and seek potential therapeutic targets.
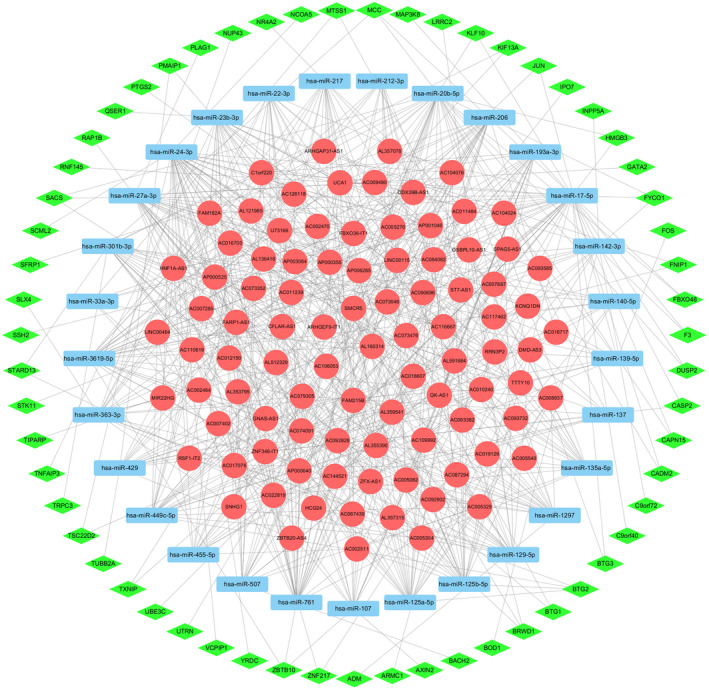
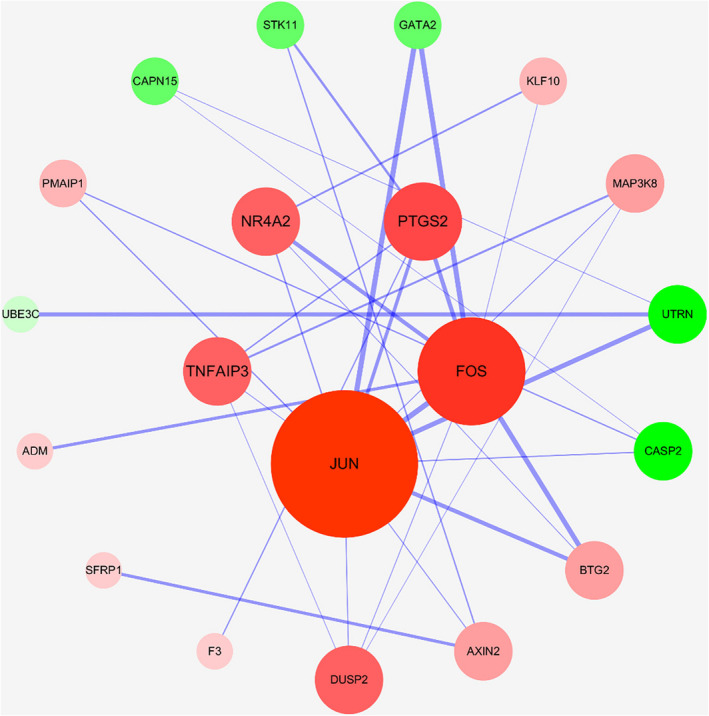
Method: First, gout-related chips were retrieved by GEO database. Then, the analysis of differentially expressed lncRNAs and mRNAs was conducted by R language and other software. Besides, miRNA and its regulated mRNA were predicted based on public databases, the intersection of differentially expressed mRNA and predicated mRNA was taken, and the lncRNA-miRNA-mRNA regulatory relationships were obtained to construct the ceRNA regulatory network. Subsequently, hub genes were screened by the STRING database and Cytoscape software. Then the DAVID database was used to illustrate the gene functions and related pathways of hub genes and to mine key ceRNA networks.
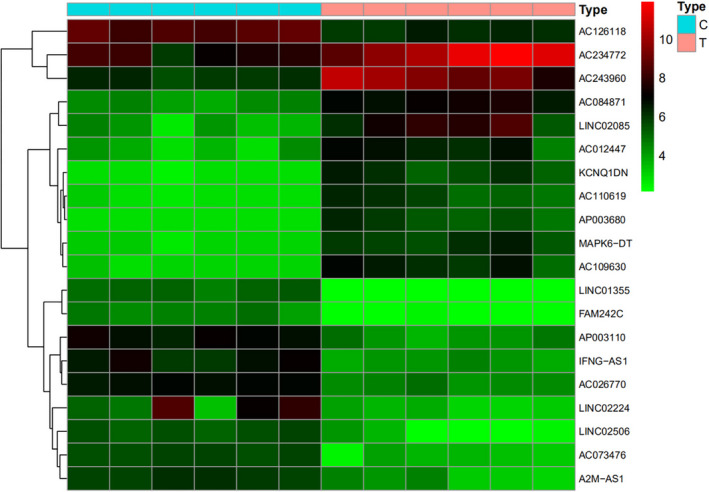
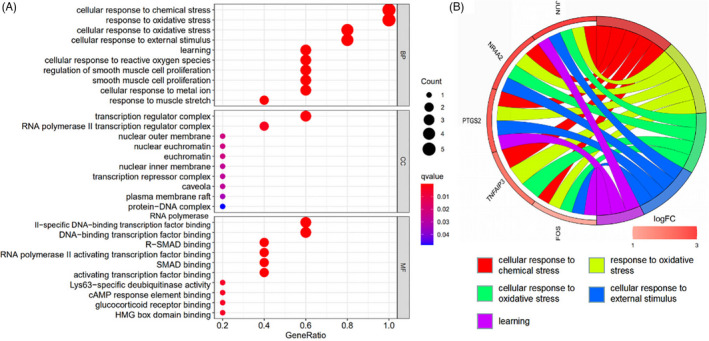
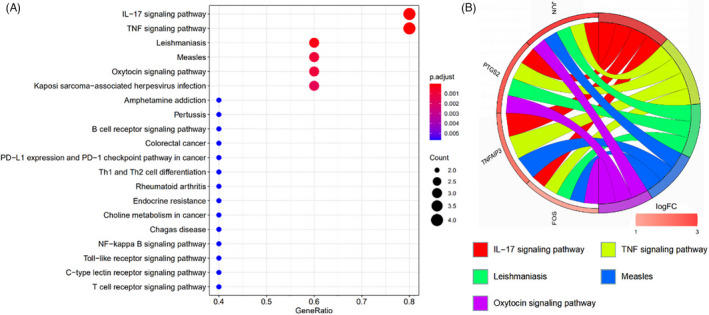
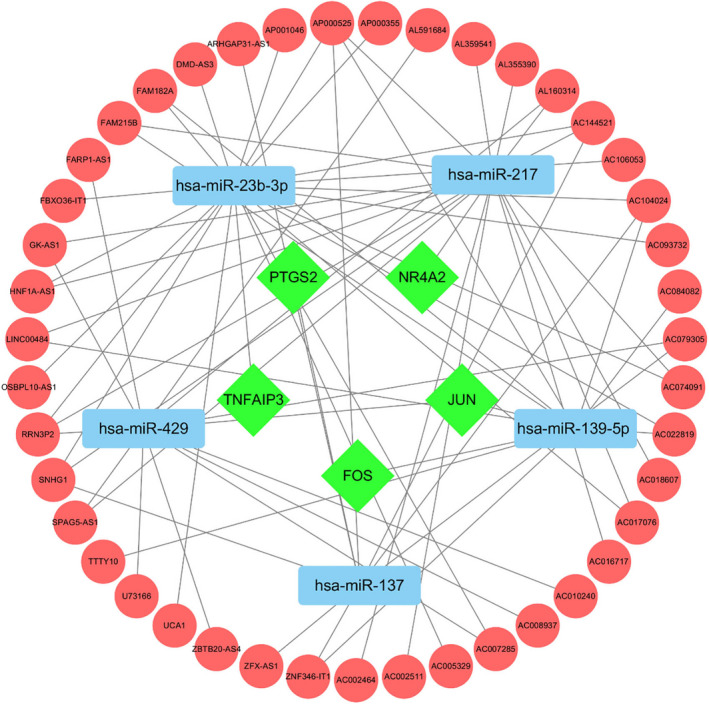
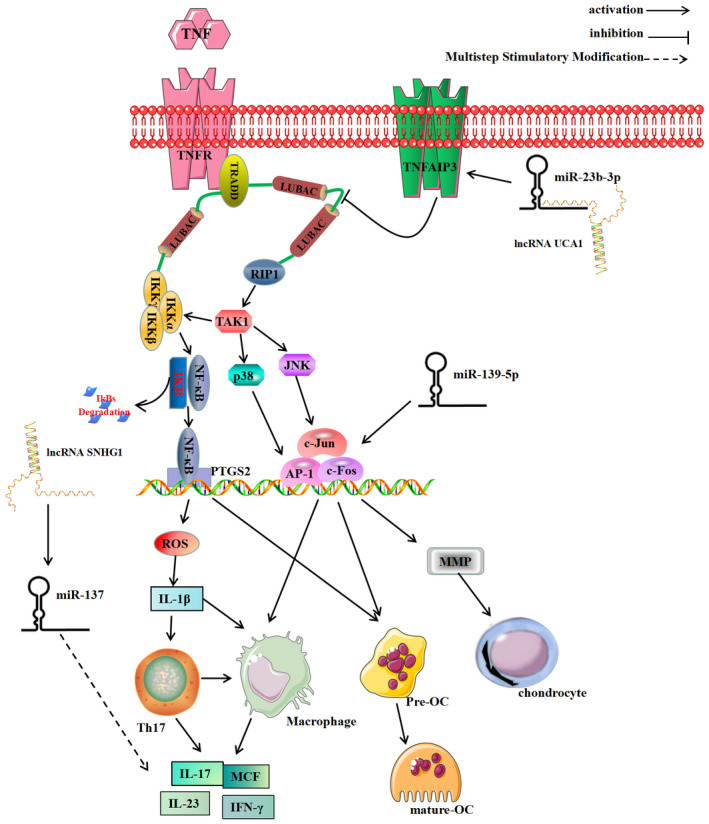
Results: Three hundred and eighty-eight lncRNAs and 758 mRNAs were identified with significant differential expression in gout patient, which regulates hub genes in the ceRNA network, such as JUN, FOS, PTGS2, NR4A2, and TNFAIP3. In the ceRNA network, lncRNA competes with mRNA for miRNA, thus affecting the IL-17 signaling pathway, TNF signaling pathway, Oxytocin signaling pathway, and NF-κB signaling pathway through regulating the cell's response to chemical stress. The research indicates that five miRNAs (miR-429, miR-137, miR-139-5p, miR-217, miR-23b-3p) and five lncRNAs (SNHG1, FAM182A, SPAG5-AS1, HNF1A-AS1, UCA1) play an important role in the formation and development of gout.
Conclusion: The interaction in the ceRNA network can affect the formation and development of gout by regulating the body's inflammatory response as well as proliferation, differentiation, and apoptosis of chondrocytes and osteoclasts. The identification of potential therapeutic targets and signaling pathways through ceRNA network can provide a reference for further research on the pathogenesis of gout.
Keywords: GEO database; LncRNA; bioinformatics; competitive endogenous RNA; gout.
© 2022 The Authors. Journal of Clinical Laboratory Analysis published by Wiley Periodicals LLC.
Figures
Similar articles
-
Regulatory Role of miRNAs and lncRNAs in Gout.Comput Math Methods Med. 2022 Jun 29;2022:6513565. doi: 10.1155/2022/6513565. eCollection 2022. Comput Math Methods Med. 2022. Retraction in: Comput Math Methods Med. 2023 Jul 19;2023:9864323. doi: 10.1155/2023/9864323. PMID: 35813414 Free PMC article. Retracted.
-
[Construction and analysis of competitive endogenous RNA regulatory network related to gastric cancer].Zhonghua Zhong Liu Za Zhi. 2020 Feb 23;42(2):115-121. doi: 10.3760/cma.j.issn.0253-3766.2020.02.006. Zhonghua Zhong Liu Za Zhi. 2020. PMID: 32135645 Chinese.
-
Identification of potential biomarkers of gout through competitive endogenous RNA network analysis.Eur J Pharm Sci. 2022 Jun 1;173:106180. doi: 10.1016/j.ejps.2022.106180. Epub 2022 Apr 1. Eur J Pharm Sci. 2022. PMID: 35378210
-
Bioinformatics analysis of ceRNA network of autophagy-related genes in pediatric asthma.Medicine (Baltimore). 2023 Dec 1;102(48):e36343. doi: 10.1097/MD.0000000000036343. Medicine (Baltimore). 2023. PMID: 38050261 Free PMC article. Review.
-
The Role of lncRNA-miR-26a-mRNA Network in Cancer Progression and Treatment.Biochem Genet. 2024 Jun;62(3):1443-1461. doi: 10.1007/s10528-023-10475-w. Epub 2023 Sep 20. Biochem Genet. 2024. PMID: 37730965 Review.
Cited by
-
IL1A regulates the inflammation in gout through the Toll-like receptors pathway.Int J Med Sci. 2024 Jan 1;21(1):188-199. doi: 10.7150/ijms.88447. eCollection 2024. Int J Med Sci. 2024. PMID: 38164346 Free PMC article.
-
Co-regulated ceRNA network mediated by circRNA and lncRNA in patients with gouty arthritis.BMC Med Genomics. 2024 Nov 7;17(1):264. doi: 10.1186/s12920-024-02038-8. BMC Med Genomics. 2024. PMID: 39511617 Free PMC article.
-
Exploration of the potential mechanism of Yiyi Tongfeng Formula in the treatment of acute gouty arthritis based on network pharmacology and molecular docking: A review.Medicine (Baltimore). 2024 Sep 13;103(37):e39609. doi: 10.1097/MD.0000000000039609. Medicine (Baltimore). 2024. PMID: 39287271 Free PMC article. Review.
References
-
- Tang YM, Zhang L, Zhu SZ, et al. Gout in China, 1990–2017: the Global Burden of Disease Study 2017. Public Health. 2021;191:33‐38. - PubMed
-
- Dalbeth N, Choi HK, Joosten LAB, et al. Gout. Nat Rev Dis Primers. 2019;5(1):69. - PubMed
-
- Williams LA. The history, symptoms, causes, risk factors, types, diagnosis, treatments, and prevention of gout, part 2. Int J Pharm Compd. 2019;23(1):14‐21. - PubMed
MeSH terms
Substances
LinkOut - more resources
Full Text Sources
Medical
Research Materials
Miscellaneous
