. 2022 May;11(5):e12216.
doi: 10.1002/jev2.12216.

The development of extracellular vesicle markers for the fungal phytopathogen Colletotrichum higginsianum

Affiliations

The development of extracellular vesicle markers for the fungal phytopathogen Colletotrichum higginsianum

Brian D Rutter et al. J Extracell Vesicles. 2022 May.

Abstract

Fungal phytopathogens secrete extracellular vesicles (EVs) associated with enzymes and phytotoxic metabolites. While these vesicles are thought to promote infection, defining the true contents and functions of fungal EVs, as well as suitable protein markers, is an ongoing process. To expand our understanding of fungal EVs and their possible roles during infection, we purified EVs from the hemibiotrophic phytopathogen Colletotrichum higginsianum, the causative agent of anthracnose disease in multiple plant species, including Arabidopsis thaliana. EVs were purified in large numbers from the supernatant of protoplasts but not the supernatant of intact mycelial cultures. We purified two separate populations of EVs, each associated with over 700 detected proteins, including proteins involved in vesicle transport, cell wall biogenesis and the synthesis of secondary metabolites. We selected two SNARE proteins (Snc1 and Sso2) and one 14-3-3 protein (Bmh1) as potential EV markers and generated transgenic strains expressing fluorescent fusions. Each marker was confirmed to be protected inside EVs. Fluorescence microscopy was used to examine the localization of each marker during infection on Arabidopsis leaves. These findings further our understanding of EVs in fungal phytopathogens and will help build an experimental system to study EV interkingdom communication between plants and fungi.

Keywords: 14-3-3 proteins; Colletotrichum higginsianum; SNARE proteins; extracellular vesicles; phytopathogen; protoplasts.


Conflict of interest statement

The authors do not declare any conflicts of interest.

Figures

FIGURE 1
FIGURE 1
Biotrophic hyphae of Colletotrichum higginsianum and C. lindemuthianum contain extracellular vesicle‐like structures in the paramural space. (a) Biotrophic hypha of C. higginsianum isolated from Arabidopsis leaves by fluorescence‐activated cell sorting showing paramural vesicles (arrowhead). (b) An extracellular vesicle (arrowhead) inside the interfacial matrix layer between the fungal cell wall (FW) and the plant plasma membrane (PP). (c‐d) Biotrophic hyphae of C. lindemuthianum infecting Phaseolus vulgaris epidermal cells. (c, d) Paramural vesicles (asterisks) between the fungal cell wall (FW) and fungal plasma membrane (FP). All cells were prepared for TEM by high‐pressure freezing and freeze‐substitution. FC, fungal cytoplasm; MVB, multivesicular body; PC, plant cytoplasm; PW, plant cell wall. Scale bars = 100 nm
FIGURE 2
FIGURE 2
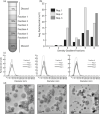
Vesicle‐like structures can be purified from C. higginsianum protoplasts. (a) Schematic of the Optiprep gradient used to purify vesicles. Crude vesicle pellets were bottom‐loaded into a discontinuous Optiprep gradient consisting of 5, 10, 20 and 40% layers. After centrifugation at 100K x g for 17 h, the 5% layer was discarded and the next six fractions of 1 ml each were collected and processed with further ultracentrifugation to obtain a pure vesicle pellet. (b) Nanoparticle tracking (NTA) data showing the average concentration of particles in each of the collected Optiprep fractions. Three independent experiments are shown in one graph. (c) NTA data showing the size distribution of particles in fractions 3, 5 and 6. Three replicates are shown in each line graph. (d) Transmission electron microscopy negative stain images of fractions 3, 5 and 6
FIGURE 3
FIGURE 3
Isolating particles from C. higginsianum protoplasts requires removal of the cell wall. Supernatant from mycelia in a mock digest solution or protoplasts were processed in parallel to purify vesicles. Significant numbers of particles were only detected in samples from protoplasts. Bars represent an average of three independent experiments. Error bars represent SD. Asterisks signify a significant difference based on a two‐tailed unpaired Student's t test (P < 0.05)
FIGURE 4
FIGURE 4
Viability stain of C. higginsianum protoplasts. (a) Protoplasts generated after cell wall digestion were mixed with Evans blue dye to a final concentration of 0.04% and observed for staining using a light microscope. A sample of protoplasts was incubated at 95 ℃ for 5 min and mixed with dye to provide a positive control for staining. (b) 300 protoplasts were tallied for untreated and heat‐treated. The graph represents the mean number of dead protoplasts from three independent experiments. Error bars represent SD. The asterisk signifies the value is significantly different from the other based on a two‐tailed unpaired Student's t test (P < 1e‐8)
FIGURE 5
FIGURE 5
Overview of the C. higginsianum EV Proteome. (a) Overview of categories of proteins found in both low density (LD) and high density (HD) vesicles purified from C. higginsianum protoplasts. (b) Venn diagrams showing the overlap of proteins detected by mass spectrometry between independent replicates of purified LD and HD vesicles (proteins selected were present in two out of four replicates, q‐value ≤ 0.01). The red outlined region contains proteins shared by at least two replicates. (c) Venn diagrams showing the overlap between the LD and HD vesicle proteomes. The red outlined region is shared. When the proteins selected were present in two out of four replicates with a q‐value ≤ 0.01, approximately 46% of proteins in each population of vesicles were shared. When stricter criteria were applied (i.e., four out of four replicates, q‐value ≤ 0.01), approximately 40% of LD and 60% of HD proteins were held in common
FIGURE 6
FIGURE 6
Localization of EV marker proteins in vegetative hyphae on Mathur's agar. Confocal laser scanning microscope images showing fluorescence and DIC channels. mScarlet‐ChSnc1 appeared to localize to the fungal plasma membrane (PM) and small, mobile punctae concentrated near the hyphal apex (a), as well as the Spitzenkörper (SPK, arrowhead) (b). In older, subapical regions, mScarlet‐ChSnc1 labelled septa (arrows), the PM and vacuoles (asterisks) (c). mNeonGreen‐ChSso2 labelled septa (arrow) and the PM in older subapical regions (e), with fluorescence intensity progressively decreasing toward the hyphal tip (d). ChBmh1‐mCherry was distributed throughout the hyphal cytoplasm but was excluded from vacuoles (f, g, asterisks) and in some hyphae the SPK (arrowhead) was strongly labelled (f). Scale bars = 5 μm
FIGURE 7
FIGURE 7
Detection of transgenic markers in EV samples. (a) Crude vesicle pellets from transgenic marker strains and nontransgenic wild‐type fungi were isolated and probed for the fluorescent‐tagged proteins RFP or mNeonGreen by immunoblot. EV markers were detected in samples of protoplast lysate as well as crude vesicle samples, while the contamination marker SOD2 was only detected in the sample of mycelial lysate. (b) EV marker band intensities were quantified and expressed as a percentage of the band intensity for the whole cell lysate. Bars represent the average of two independent replicates
FIGURE 8
FIGURE 8
Transgenic EV markers are protected inside of lipid vesicles. A sample of crude vesicles from each EV marker strain was split into three and either left untreated, treated with trypsin or treated with detergent followed by trypsin. EV markers were then detected by immunoblot. Detection of the fusion protein in the presence of trypsin but not in the presence of detergent plus trypsin indicates the protein is protected within a lipid compartment. All experiments were repeated twice
FIGURE 9
FIGURE 9
Localization of mScarlet‐ChSnc1 in C. higginsianum infecting Arabidopsis. Fungal transformants expressing mScarlet‐ChSnc1 were inoculated on Arabidopsis cotyledons and observed with confocal laser scanning microscopy. (a, b) mScarlet‐ChSnc1 labelled vacuoles in spores and small punctae in appressoria. (c‐f) In young biotrophic hyphae, mScarlet‐ChSnc1 appeared to localize to the plasma membrane (PM) and small punctae. (g‐h) At the transition to necrotrophy, mScarlet‐ChSnc1 labelled the PMs of both biotrophic and necrotrophic hyphae. (I, J) In necrotrophic hyphae, mScarlet‐ChSnc1 appeared to localize to the PM at hyphal tips and strongly labelled vacuoles. (b, d, f, h, j) fluorescence channel; (c, e, g) DIC channel; (a, i) Overlays of DIC and fluorescence channels. Scale bars = 5 μm. S, spore; A, appressorium; BH, biotrophic hypha; NH, necrotrophic hypha
FIGURE 10
FIGURE 10
Localization of mNeonGreen‐ChSso2 in C. higginsianum infecting Arabidopsis. Fungal transformants expressing mNeonGreen‐ChSso2 were inoculated on Arabidopsis cotyledons and observed with confocal laser scanning microscopy. In biotrophic hyphae (BH), mNeonGreen‐ChSso2 appeared to localize to the plasma membrane (PM) as well as to septa (arrowhead). PM labelling appeared weaker in necrotrophic hyphae (NH) than in biotrophic hyphae. (a, d) Overlays of DIC and fluorescence channels; (b) DIC channel; (c) fluorescence channel. Scale bars = 5 μm
FIGURE 11
FIGURE 11
Localization of ChBmh1‐mCherry in C. higginsianum infecting Arabidopsis. Fungal transformants expressing ChBmh1‐mCherry were inoculated on Arabidopsis cotyledons and observed with confocal laser scanning microscopy. (a, b) ChBmh1‐mCherry labelled vacuoles in spore and punctae in appressorium. (c‐f) ChBmh1‐mCherry localized to small punctae in young biotrophic hyphae. (g‐j) In older biotrophic and necrotrophic hyphae, fluorescent labelling was distributed through the cytoplasm and excluded from vacuoles.  (a, c, e, g, i) Overlays of DIC and fluorescence channels; b, d, f, h, j) DIC channel. Scale bars = 5 μm. S, spore; A, appressorium; BH, biotrophic hypha; NH, necrotrophic hypha

Similar articles

Cited by

References

    1. Aalto, M. K. , Ronne, H. , & Keranen, S. (1993). Yeast syntaxins Sso1p and Sso2p belong to a family of related membrane proteins that function in vesicular transport. Embo Journal, 12(11), 4095–4104. https://www.ncbi.nlm.nih.gov/pubmed/8223426 - PMC - PubMed
    1. Albuquerque, P. C. , Nakayasu, E. S. , Rodrigues, M. L. , Frases, S. , Casadevall, A. , Zancope‐Oliveira, R. M. , Almeida, I. C. , & Nosanchuk, J. D. (2008). Vesicular transport in Histoplasma capsulatum: An effective mechanism for trans‐cell wall transfer of proteins and lipids in ascomycetes. Cellular Microbiology, 10(8), 1695–1710. 10.1111/j.1462-5822.2008.01160.x - DOI - PMC - PubMed
    1. Almagro Armenteros, J. J. , Tsirigos, K. D. , Sonderby, C. K. , Petersen, T. N. , Winther, O. , Brunak, S. , von Heijne, G. , & Nielsen, H. (2019). SignalP 5.0 improves signal peptide predictions using deep neural networks. Nature Biotechnology, 37(4), 420–423. 10.1038/s41587-019-0036-z - DOI - PubMed
    1. Anderson, J. , Mihalik, R. , & Soll, D. R. (1990). Ultrastructure and antigenicity of the unique cell wall pimple of the Candida opaque phenotype. Journal of Bacteriology, 172(1), 224–235. 10.1128/jb.172.1.224-235.1990 - DOI - PMC - PubMed
    1. Baldrich, P. , Rutter, B. D. , Karimi, H. Z. , Podicheti, R. , Meyers, B. C. , & Innes, R. W. (2019). Plant extracellular vesicles contain diverse small RNA species and are enriched in 10‐ to 17‐nucleotide “Tiny” RNAs. Plant Cell, 31(2), 315–324. 10.1105/tpc.18.00872 - DOI - PMC - PubMed

Publication types

MeSH terms

Substances

Supplementary concepts