. 2022 May;11(5):e12213.
doi: 10.1002/jev2.12213.

Tetraspanins distinguish separate extracellular vesicle subpopulations in human serum and plasma - Contributions of platelet extracellular vesicles in plasma samples

Affiliations

Tetraspanins distinguish separate extracellular vesicle subpopulations in human serum and plasma - Contributions of platelet extracellular vesicles in plasma samples

Nasibeh Karimi et al. J Extracell Vesicles. 2022 May.

Abstract

Background: The ability to isolate extracellular vesicles (EVs) from blood is vital in the development of EVs as disease biomarkers. Both serum and plasma can be used, but few studies have compared these sources in terms of the type of EVs that are obtained. The aim of this study was to determine the presence of different subpopulations of EVs in plasma and serum.

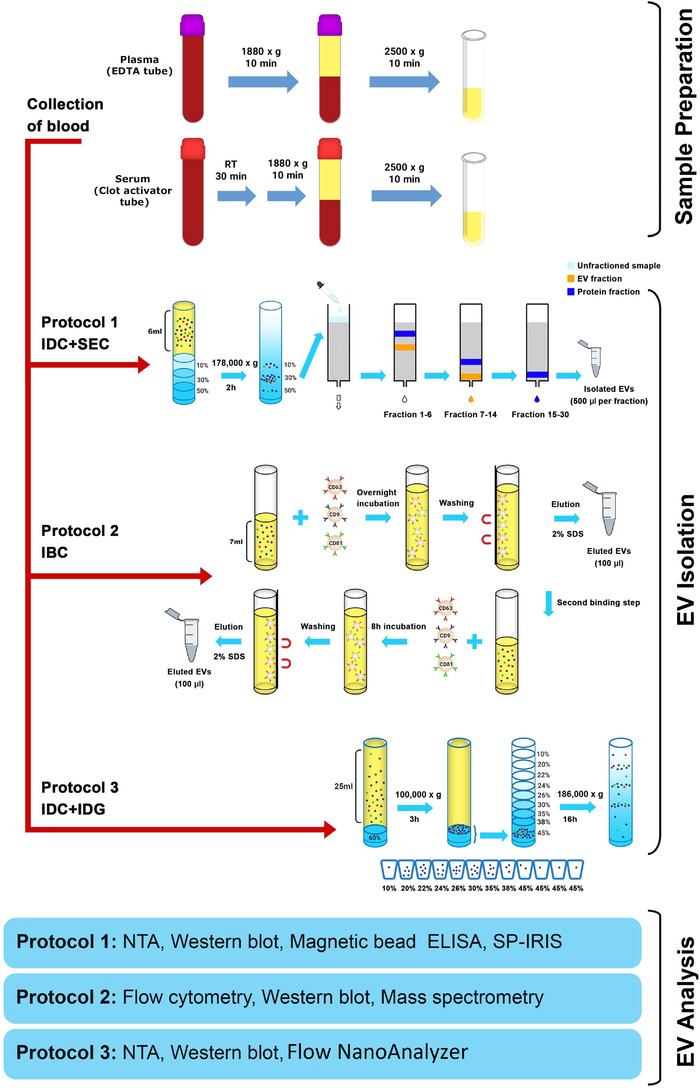
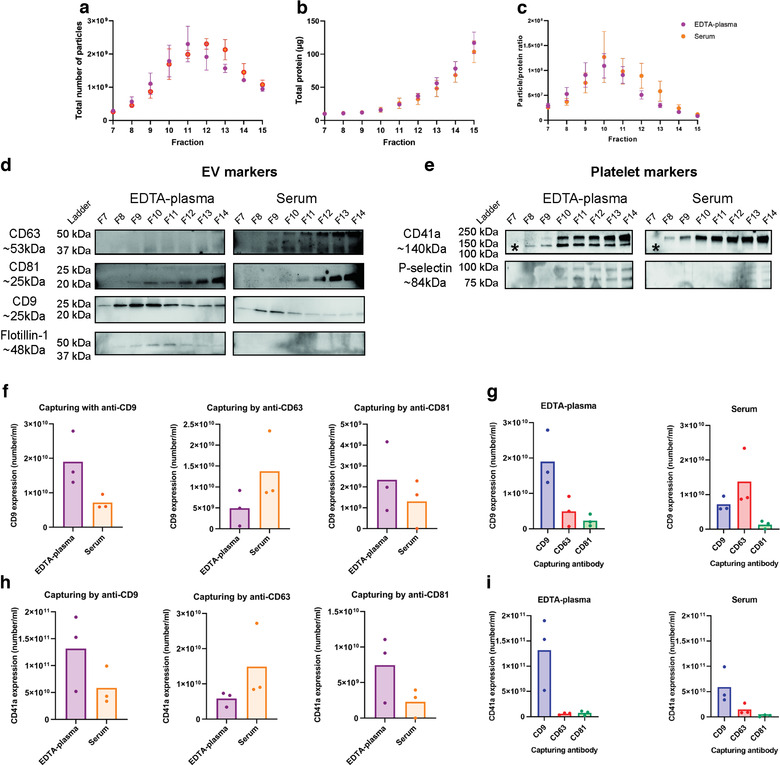
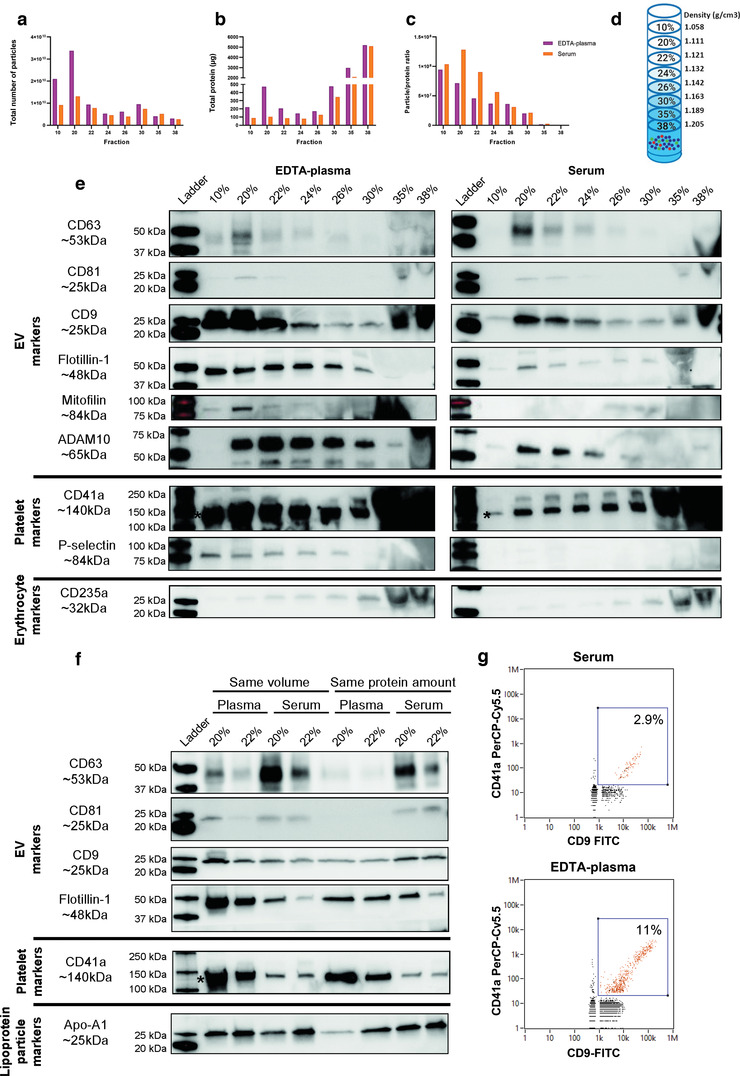
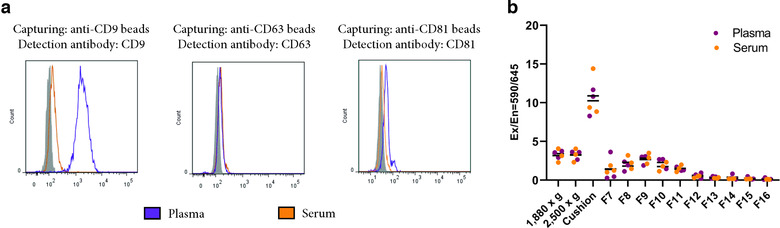
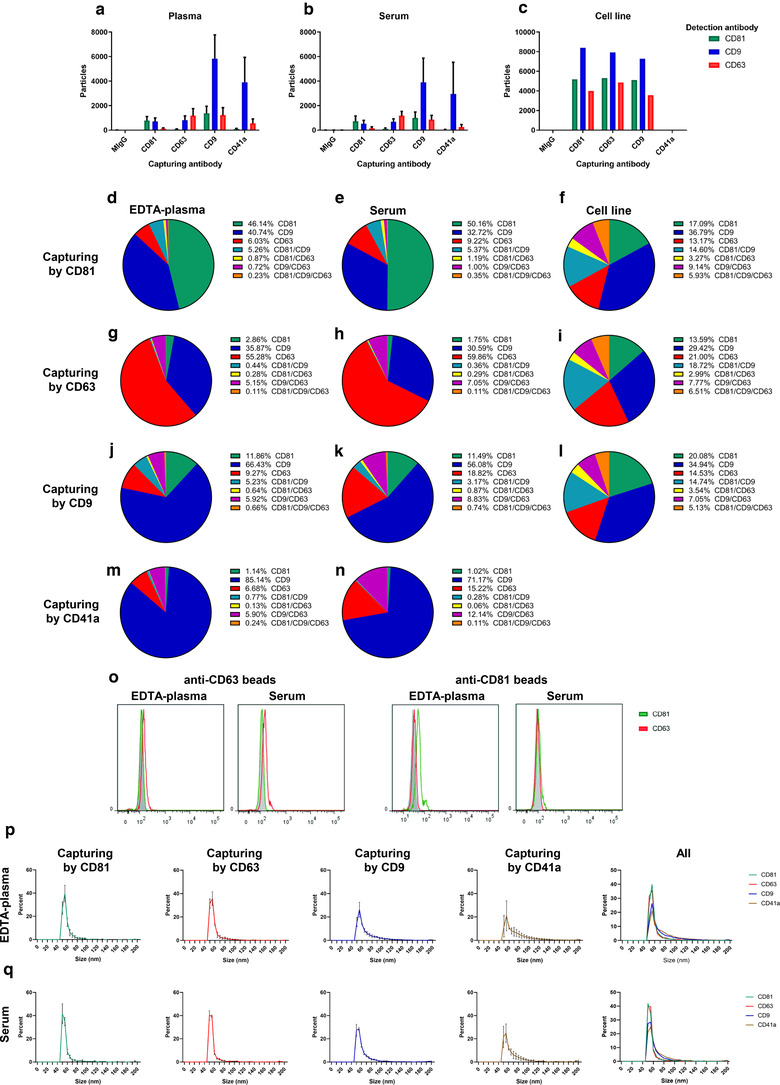
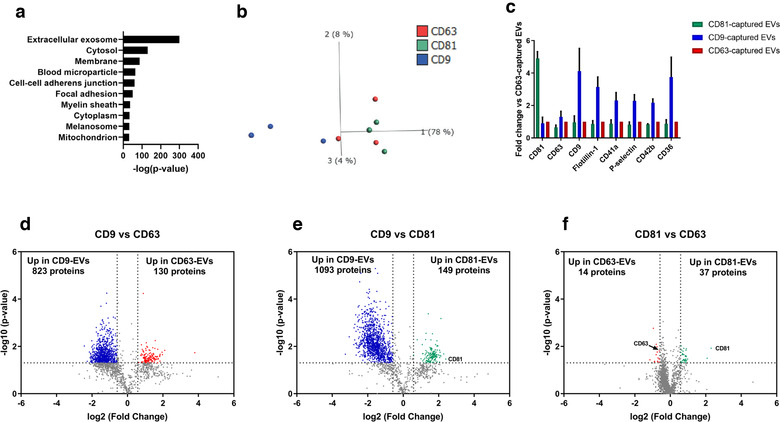
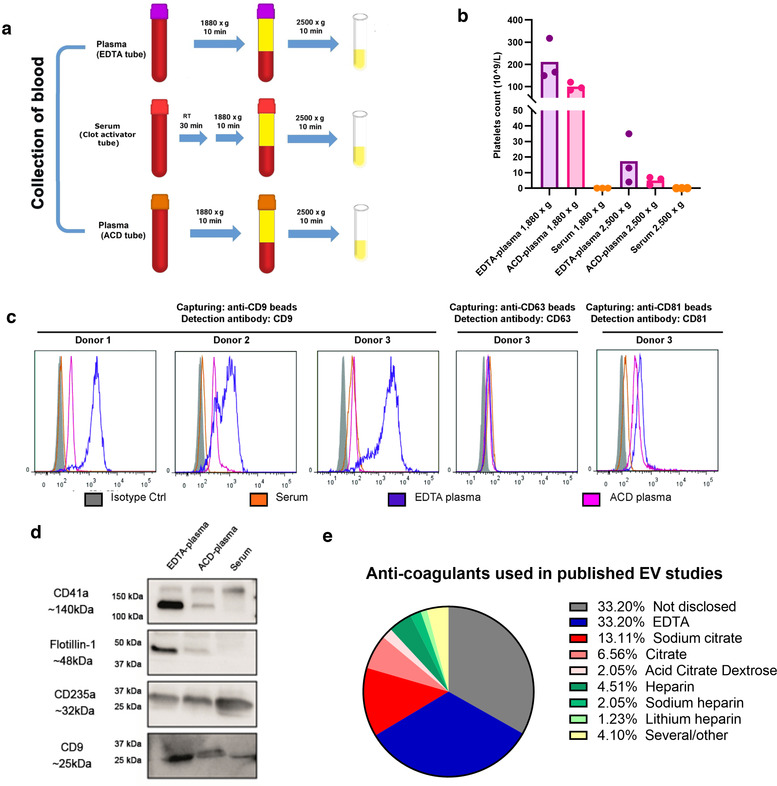
Method: Blood was collected from healthy subjects, and plasma and serum were isolated in parallel. ACD or EDTA tubes were used for the collection of plasma, while serum was obtained in clot activator tubes. EVs were isolated utilising a combination of density cushion and SEC, a combination of density cushion and gradient or by a bead antibody capturing system (anti-CD63, anti-CD9 and anti-CD81 beads). The subpopulations of EVs were analysed by NTA, Western blot, SP-IRIS, conventional and nano flow cytometry, magnetic bead ELISA and mass spectrometry. Additionally, different isolation protocols for plasma were compared to determine the contribution of residual platelets in the analysis.

Results: This study shows that a higher number of CD9+ EVs were present in EDTA-plasma compared to ACD-plasma and to serum, and the presence of CD41a on these EVs suggests that they were released from platelets. Furthermore, only a very small number of EVs in blood were double-positive for CD63 and CD81. The CD63+ EVs were enriched in serum, while CD81+ vesicles were the rarest subpopulation in both plasma and serum. Additionally, EDTA-plasma contained more residual platelets than ACD-plasma and serum, and two centrifugation steps were crucial to reduce the number of platelets in plasma prior to EV isolation.

Conclusion: These results show that human blood contains multiple subpopulations of EVs that carry different tetraspanins. Blood sampling methods, including the use of anti-coagulants and choice of centrifugation protocols, can affect EV analyses and should always be reported in detail.

Keywords: biomarkers; exosomes; extracellular vesicles; microvesicles; plasma; serum; subpopulations.


Conflict of interest statement

J.L. and C.L. have developed multiple EV‐associated patents for putative clinical utilization. J.L. owns equity in Codiak BioSciences Inc. and Exocure Biosciences Inc. and consults in the field of EVs through Vesiclebio AB. C.L. owns equity in Exocure Bioscience Inc.

Figures

FIGURE 1
FIGURE 1
Schematic overview of the experimental workflow. Plasma and serum were collected, and three different protocols were used to isolate EVs. EDTA, ethylenediaminetetraacetic acid; ELISA, enzyme‐linked immunosorbent assay; EV, extracellular vesicle; IBC, immuno‐bead capturing; IDC, iodixanol density cushion; IDG, iodixanol density gradient; NTA, nanoparticle tracking analysis; SDS, sodium dodecyl sulfate; SEC, size exclusion chromatography; SP‐IRIS, single‐particle interferometric reflectance imaging sensing
FIGURE 2
FIGURE 2
CD9+ and CD41a+ extracellular vesicles (EVs) are more prominent in EDTA‐plasma compared to serum. EVs were isolated with Protocol 1 starting with 6‐ml plasma or serum. a,b. Concentrations of particles (a) and proteins (b) in the SEC fractions were determined with NTA and Qubit, respectively. Data are presented as the total amount of particles or proteins in fractions 7–15. N = 4, and the results are presented as the average ± SEM. c. The particle to protein ratio based on the values from panels a and b. N = 4, and the results are presented as the average ± SEM. d,e. The presence of the EV markers CD63, CD81, CD9 and flotillin‐1 (d) and the platelet markers CD41a and p‐selectin (e) were determined in SEC fractions 7–14 (36 μl/fraction) with Western blotting. CD41a is detected at 140 kDa, which is the lower band only detected in plasma and highlighted with *. F–I. The presence of the EV marker CD9 (f,g) and the platelet‐marker CD41a (h,i) was determined on EVs from pooled fractions 9 and 10 from EDTA‐plasma and serum, respectively, captured by anti‐CD9, anti‐CD63 and anti‐CD81 magnetic bead ELISA. N = 3. f and g show the same data but displayed either per protein or per biofluid. EVs were captured with anti‐CD9, anti‐CD63 or anti‐CD81 beads and CD9 was detected. h and i show the same data but displayed either per protein or per biofluid. EVs were captured with anti‐CD9, anti‐CD63 or anti‐CD81 beads, and CD41a was detected. No significance was observed for G and I when paired Student's t‐test was used
FIGURE 3
FIGURE 3
EDTA‐plasma and serum‐derived extracellular vesicles (EVs) have similar densities. EVs were isolated with Protocol 3 (the starting volume of plasma and serum was 25 ml), which is a non‐pelleting protocol consisting of the combination of an iodixanol density cushion and an iodixanol density gradient. a,b. Concentrations of particles (a) and proteins (b) in the density fractions were determined with NTA (ZetaView®) and Qubit, respectively. Data are presented as the total amount of particles or proteins in fractions 10%–38%. N = 1. c. The particle to protein ratio based on the values from panels a and b. N = 1. d. The densities for the different fractions according to the information sheet for iodixanol. e. The presence of the EV markers CD63, CD81, CD9, flotillin‐1, mitofillin and ADAM10; the platelet markers CD41a and p‐selectin; and the erythrocyte marker CD235a were determined with Western blot in the top eight 1‐ml fractions from the iodixanol gradient fractions (36 μl/fraction). CD41a is detected at 140 kDa, which is the lower band highlighted with *. f. The majority of the EVs were present in the 20% and 22% fractions, and we, therefore, loaded these fractions from both serum and plasma onto the same gels, normalised both for volume (36 μl) and protein amount (3 μg). The presence of the EV markers CD63, CD81, CD9 and flotillin‐1; the platelet marker CD41a and the lipoprotein marker Apo‐A1 were determined in the 20% and 22% fractions from the iodixanol gradient. g. The presence of CD41a and CD9 on single EVs was determined with Flow NanoAnalyzer for the pooled 20% and 22% fractions from plasma and serum, respectively. For serum, 2577 events/min were recorded and for plasma 5059 events/min were recorded
FIGURE 4
FIGURE 4
Serum clotting does not trap extracellular vesicles (EVs). (a) EVs were isolated with Protocol 2. Anti‐CD63, anti‐CD9 or anti‐CD81 beads were added directly to 1.2‐ml plasma and serum. Bead‐EV complexes were stained with anti‐CD63, anti‐CD9, anti‐CD63 or anti‐CD81, respectively, and analysed with flow cytometry. N = 1. b. mCherry‐CD63 EVs (15 μl) were spiked into blood collection tubes immediately after blood was drawn, and their presence was measured along all steps of Protocol 1 in both plasma and serum by measuring their fluorescence with a Varioskan™ LUX multimode microplate reader. N = 3
FIGURE 5
FIGURE 5
Few extracellular vesicles (EVs) in plasma and serum are double‐positive for CD63 and CD81. EVs were isolated with Protocol 1 for panels (a–n) and (p–q) (the starting volume of plasma and serum was 6 ml) and with Protocol 3 for panel O (the starting volume of plasma and serum was 1.2 ml). a–c. Thirty‐five microliters from fraction 9 were analysed with SP‐IRIS using the Tetraspanin Plasma kit on an ExoView™ R100 instrument. This kit captures EVs with anti‐CD81, anti‐CD63, anti‐CD9 and anti‐CD41a antibodies. On the chip is also the mouse IgG as a negative control. The anti‐CD81‐CF555, anti‐CD9‐CF488 and anti‐CD63‐CF647 antibodies were used for detection. N = 3 for plasma and serum. N = 1 for cell‐line‐derived EVs. Data are presented as the mean ± SEM. d–n. The data from panels A–C were analysed in depth to determine the percentage of single, double and triple‐positive (CD81, CD9, CD63) EVs captured with CD81, CD63, CD9 and CD41a. o. Anti‐CD63 and anti‐CD81 beads were added directly to the plasma and serum samples and were then analysed with flow cytometry to determine their expression of CD63 and CD81. Representative graphs are shown. N = 2. p,q. Size of EVs from plasma (p) and serum (q) captured by anti‐CD81, anti‐CD63, anti‐CD9 and anti‐CD41a as determined by the ExoView™ R100 instrument. N = 3 for plasma and serum. Data are presented as the mean ± SEM
FIGURE 6
FIGURE 6
Distribution of different tetraspanins among subpopulations of extracellular vesicles (EVs) in plasma and serum. EVs were isolated with Protocol 2. EVs were eluted off the anti‐CD9, anti‐CD63 and anti‐CD81 beads from plasma with 2% SDS, and 40 μg per samples was quantified with tandem mass tag LC‐MS/MS. N = 3. a. The top 10 ‘cellular compartments’ GO terms associated with the proteome of plasma EVs. b. PCA illustrating the relationship between the proteome of CD9‐captured EVs (blue), CD63‐captured EVs (red) and CD81‐captured EVs (green). c. Fold change of the three tetraspanins, flotillin‐1 and four platelet proteins. The fold change was calculated compared to the CD63‐captured EVs. d–f. Volcano plots of the proteome of CD9 versus CD63 (f), CD9 versus CD81 (g), and CD81 versus CD63 (h). Dotted lines indicate cut‐offs, which were 1.3 on the Y‐axis (corresponding to p <  0.05) and 0.67 on the X‐axis (corresponding to fold change >1.5)
FIGURE 7
FIGURE 7
EDTA‐plasma contains more residual platelets than ACD‐plasma and serum. a. ETDA‐plasma, ACD‐plasma and serum were collected according to the schematic overview. b. Number of residual platelets in EDTA‐plasma, ACD‐plasma and serum as measured by a Sysmex automated counter. N = 3. c. Anti‐CD63, anti‐CD9 or anti‐CD81 beads were added directly to EDTA‐plasma, ACD‐plasma and serum. Bead‐EV complexes were stained with anti‐CD63, anti‐CD9 or anti‐CD81, respectively, and analysed by flow cytometry. N = 3 for anti‐CD9 beads and N = 1 for anti‐CD63 and anti‐CD81 beads. d. EVs were eluted off the anti‐CD9 beads from EDTA‐plasma, ACD‐A plasma and serum with 2% SDS, and the presence of CD41a, flotillin‐1, CD235a and CD9 was determined by Western blot. In total, 36 μg/well was loaded. e. The EV‐TRACK knowledgebase was searched for all human plasma studies, and the methods sections of the identified studies were manually read to identify which type of anti‐coagulant had been used. In total, 244 studies were analysed
FIGURE 8
FIGURE 8
Two centrifugations are crucial to reduce residual platelets. a. ETDA‐ and ACD‐plasmas were collected according to the schematic overview, where our current protocol was compared to the one recommended by the ISTH. b. The number of residual platelets in EDTA‐ and ACD‐plasmas after the two isolation protocols was as measured by a Sysmex automated counter. N = 4. c. The EV‐TRACK knowledgebase was searched for all human plasma studies, and the methods sections of the identified studies were manually read to identify how the blood/plasma was centrifuged prior to freezing and EV isolation. In total, 244 studies were analysed. d. EVs were isolated with Protocol 1 starting with 6‐ml plasma. The presence of the EV markers CD81, CD9, and flotillin‐1, the platelet marker CD41a and the endoplasmic reticulum marker calnexin was determined in SEC fractions 7–14 (36 μl/fraction) by Western blotting. CD41a is detected at 140 kDa, which is the lower band highlighted with *. Platelets pelleted from platelet‐rich‐plasma were used as a positive control for calnexin

References

    1. Ax, E. , Jevnikar, Z. , Cvjetkovic, A. , Malmhäll, C. , Olsson, H. , Rådinger, M. , & Lässer, C. (2020). T2 and T17 cytokines alter the cargo and function of airway epithelium‐derived extracellular vesicles. Respiratory Research, 21(1), 115. - PMC - PubMed
    1. Bachurski, D. , Schuldner, M. , Nguyen, P. H. , Malz, A. , Reiners, K. S. , & Grenzi, P. C. (2019). Extracellular vesicle measurements with nanoparticle tracking analysis ‐ An accuracy and repeatability comparison between NanoSight NS300 and ZetaView. Journal of Extracellular Vesicles, 8(1), 1596016. - PMC - PubMed
    1. Baek, R. , Sondergaard, E. K. , Varming, K. , & Jorgensen, M. M. (2016). The impact of various preanalytical treatments on the phenotype of small extracellular vesicles in blood analyzed by protein microarray. Journal of Immunological Methods, 438, 11–20. - PubMed
    1. Bobrie, A. , Colombo, M. , Krumeich, S. , Raposo, G. , & Théry, C. (2012). Diverse subpopulations of vesicles secreted by different intracellular mechanisms are present in exosome preparations obtained by differential ultracentrifugation. Journal of Extracellular Vesicles, 1, 18397. - PMC - PubMed
    1. Boing, A. N. , van der Pol, E. , Grootemaat, A. E. , Coumans, F. A. , Sturk, A. , & Nieuwland, R. (2014). Single‐step isolation of extracellular vesicles by size‐exclusion chromatography. Journal of Extracellular Vesicles, 3, PMID: 25279113. - PMC - PubMed

Publication types