

Abnormal dynamic functional connectivity after sleep deprivation from temporal variability perspective
- PMID: 35524680
- PMCID: PMC9294309
- DOI: 10.1002/hbm.25886
Abnormal dynamic functional connectivity after sleep deprivation from temporal variability perspective
Abstract
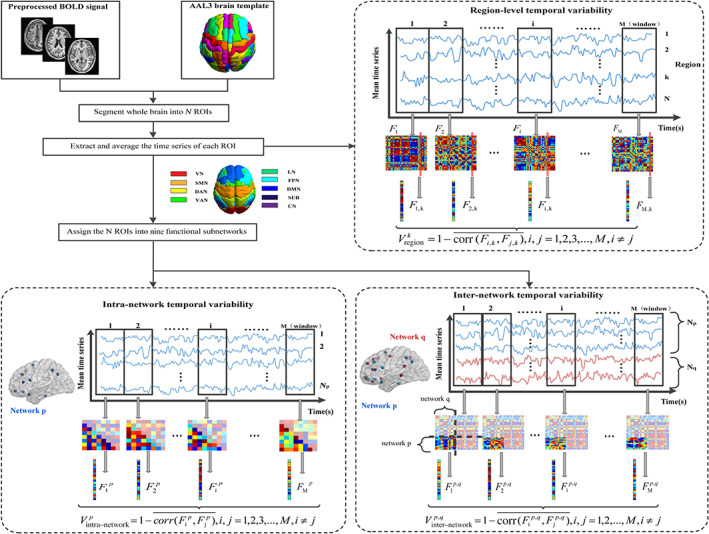
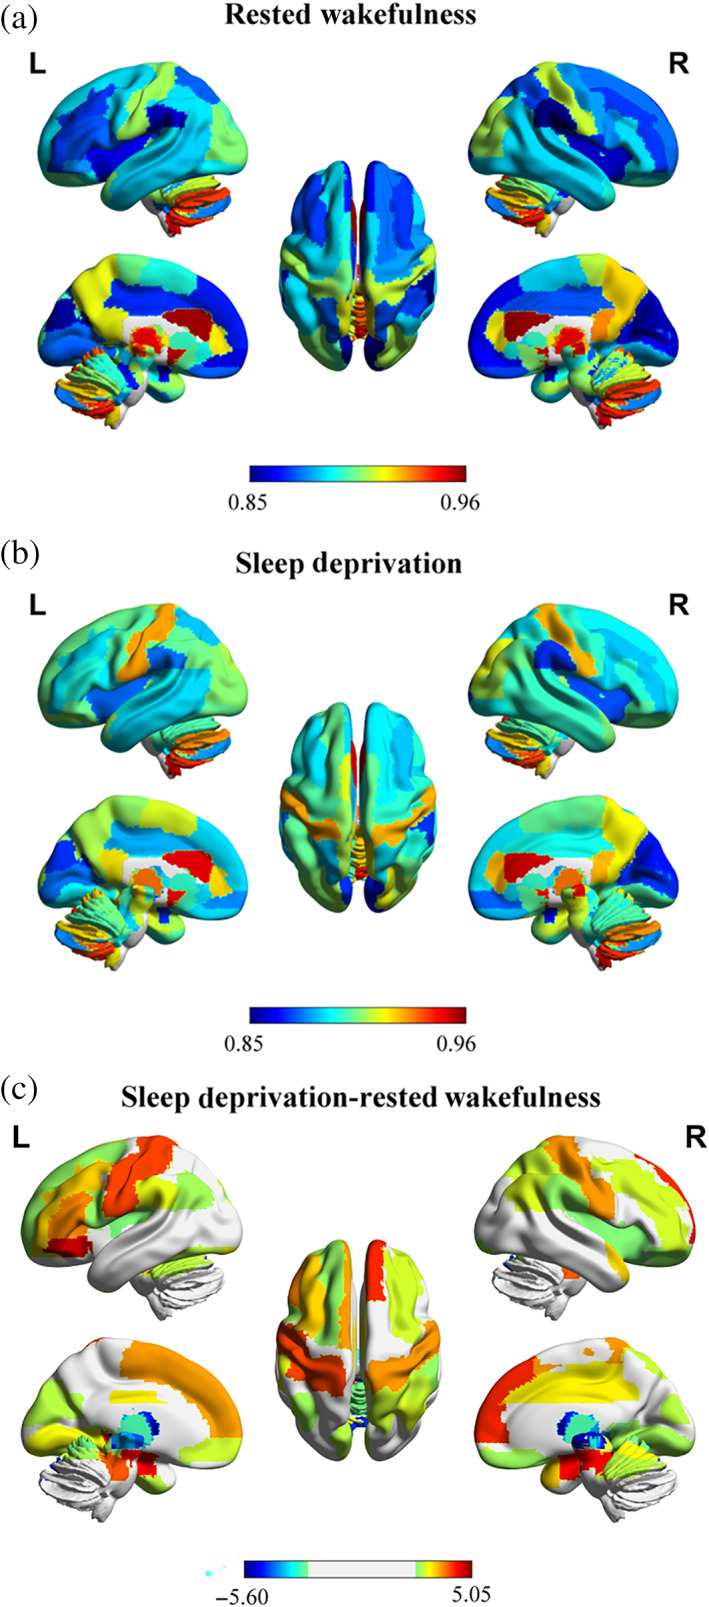
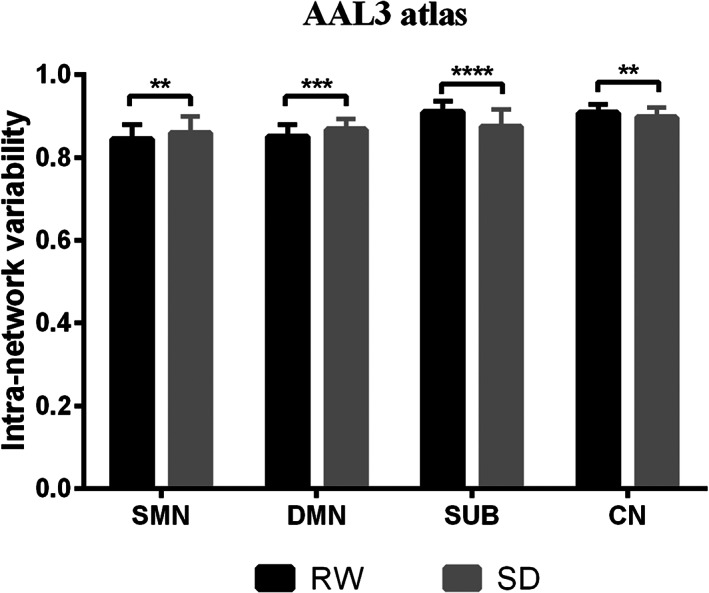
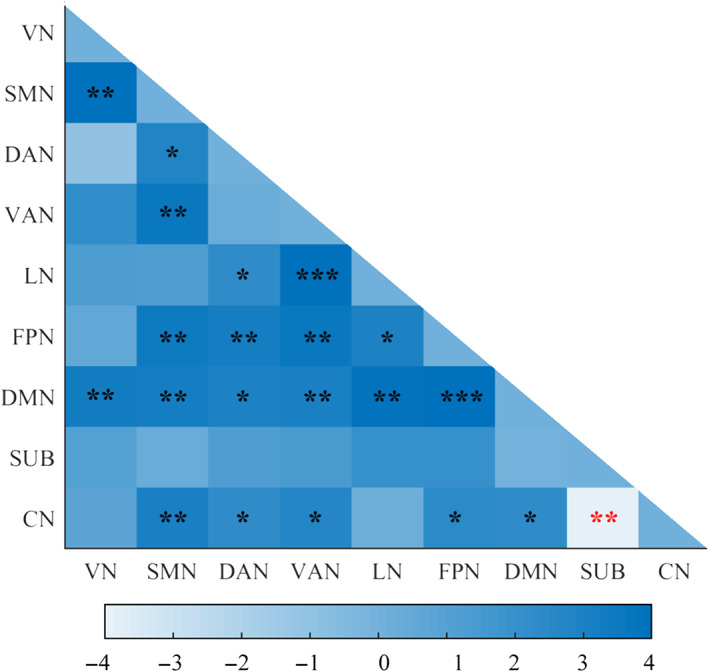
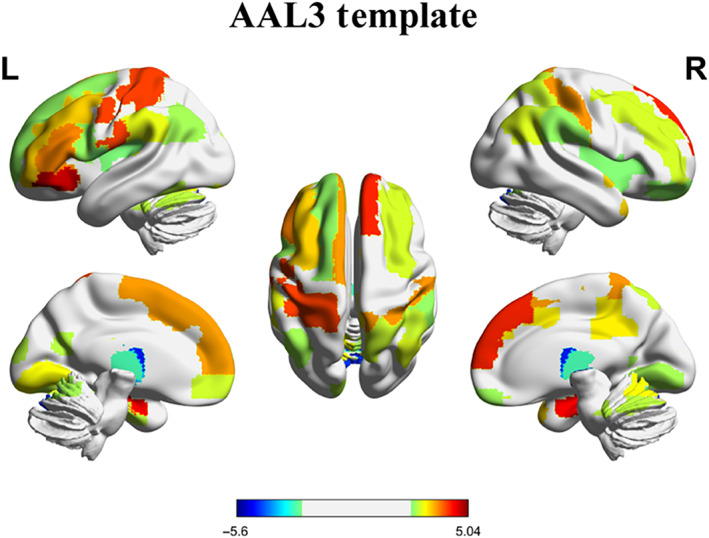
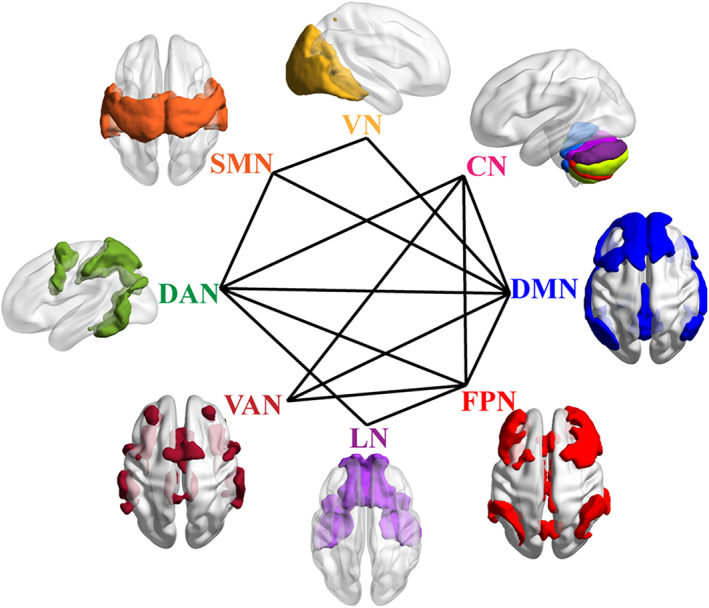
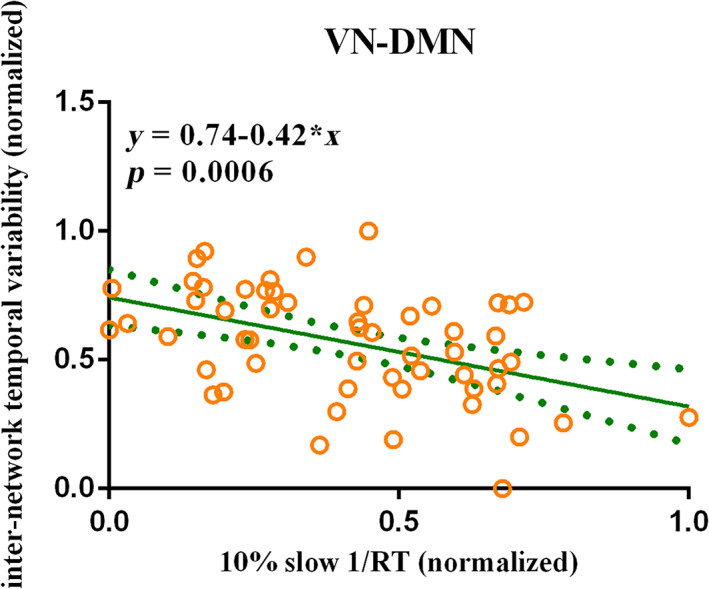
Sleep deprivation (SD) is very common in modern society and regarded as a potential causal mechanism of several clinical disorders. Previous neuroimaging studies have explored the neural mechanisms of SD using magnetic resonance imaging (MRI) from static (comparing two MRI sessions [one after SD and one after resting wakefulness]) and dynamic (using repeated MRI during one night of SD) perspectives. Recent SD researches have focused on the dynamic functional brain organization during the resting-state scan. Our present study adopted a novel metric (temporal variability), which has been successfully applied to many clinical diseases, to examine the dynamic functional connectivity after SD in 55 normal young subjects. We found that sleep-deprived subjects showed increased regional-level temporal variability in large-scale brain regions, and decreased regional-level temporal variability in several thalamus subregions. After SD, participants exhibited enhanced intra-network temporal variability in the default mode network (DMN) and increased inter-network temporal variability in numerous subnetwork pairs. Furthermore, we found that the inter-network temporal variability between visual network and DMN was negative related with the slowest 10% respond speed (β = -.42, p = 5.57 × 10⁻⁴ ) of the psychomotor vigilance test after SD following the stepwise regression analysis. In conclusion, our findings suggested that sleep-deprived subjects showed abnormal dynamic brain functional configuration, which provides new insights into the neural underpinnings of SD and contributes to our understanding of the pathophysiology of clinical disorders.
Keywords: dynamic functional connectivity; psychomotor vigilance test; resting-state functional magnetic resonance imaging; sleep deprivation; temporal variability.
© 2022 The Authors. Human Brain Mapping published by Wiley Periodicals LLC.
Conflict of interest statement
The authors declare no potential conflict of interest.
Figures
Similar articles
-
Effects of one night of sleep deprivation on whole brain intrinsic connectivity distribution using a graph theory neuroimaging approach.Sleep Med. 2025 Jan;125:89-99. doi: 10.1016/j.sleep.2024.11.010. Epub 2024 Nov 8. Sleep Med. 2025. PMID: 39566269
-
Impact of 36 h of total sleep deprivation on resting-state dynamic functional connectivity.Brain Res. 2018 Jun 1;1688:22-32. doi: 10.1016/j.brainres.2017.11.011. Epub 2017 Nov 22. Brain Res. 2018. PMID: 29174693
-
Dissociable effects of sleep deprivation on functional connectivity in the dorsal and ventral default mode networks.Sleep Med. 2018 Oct;50:137-144. doi: 10.1016/j.sleep.2018.05.040. Epub 2018 Jun 23. Sleep Med. 2018. PMID: 30055480
-
Functional connectivity and the sleep-deprived brain.Prog Brain Res. 2019;246:159-176. doi: 10.1016/bs.pbr.2019.02.009. Epub 2019 Mar 21. Prog Brain Res. 2019. PMID: 31072560 Review.
-
Impact of sleep deprivation on dynamic functional connectivity states.Handb Clin Neurol. 2025;206:27-36. doi: 10.1016/B978-0-323-90918-1.00012-5. Handb Clin Neurol. 2025. PMID: 39864929 Review.
Cited by
-
Abnormal changes in neuropsychological function, brain structure and cerebral perfusion in patients with unruptured intracranial aneurysms.Front Neurol. 2024 Oct 8;15:1463156. doi: 10.3389/fneur.2024.1463156. eCollection 2024. Front Neurol. 2024. PMID: 39440250 Free PMC article.
-
Integration of temporal & spatial properties of dynamic functional connectivity based on two-directional two-dimensional principal component analysis for disease analysis.PeerJ. 2024 Apr 9;12:e17078. doi: 10.7717/peerj.17078. eCollection 2024. PeerJ. 2024. PMID: 38618569 Free PMC article.
-
The effect of deep magnetic stimulation on the cardiac-brain axis post-sleep deprivation: a pilot study.Front Neurosci. 2025 Jan 10;18:1464299. doi: 10.3389/fnins.2024.1464299. eCollection 2024. Front Neurosci. 2025. PMID: 39867450 Free PMC article.
-
Altering Temporal Dynamics of Sleepiness and Mood During Sleep Deprivation: Evidence from Resting-State EEG Microstates.Brain Sci. 2025 Apr 21;15(4):423. doi: 10.3390/brainsci15040423. Brain Sci. 2025. PMID: 40309897 Free PMC article.
-
Altered Postcentral Connectivity after Sleep Deprivation Correlates to Impaired Risk Perception: A Resting-State Functional Magnetic Resonance Imaging Study.Brain Sci. 2023 Mar 20;13(3):514. doi: 10.3390/brainsci13030514. Brain Sci. 2023. PMID: 36979324 Free PMC article.
References
-
- Andersson, J. L. R. , Hutton, C. , Ashburner, J. , Turner, R. , & Friston, K. (2001). Modeling geometric deformations in EPI time series. NeuroImage, 13, 903–919. - PubMed
-
- Arslan, S. , Ktena, S. I. , Makropoulos, A. , Robinson, E. C. , Rueckert, D. , & Parisot, S. (2018). Human brain mapping: A systematic comparison of parcellation methods for the human cerebral cortex. NeuroImage, 170, 5–30. - PubMed
-
- Ashburner, J. , & Friston, K. J. (2005). Unified segmentation. NeuroImage, 26, 839–851. - PubMed
-
- Bandyopadhyay, A. , & Sigua, N. L. (2019). What is sleep deprivation? American Journal of Respiratory Critical Care Medicine, 199, P11–P12. - PubMed
Publication types
MeSH terms
LinkOut - more resources
Full Text Sources
