Protist feeding patterns and growth rate are related to their predatory impacts on soil bacterial communities
- PMID: 35524686
- PMCID: PMC9126823
- DOI: 10.1093/femsec/fiac057
Protist feeding patterns and growth rate are related to their predatory impacts on soil bacterial communities
Abstract
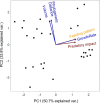
Predatory protists are major consumers of soil micro-organisms. By selectively feeding on their prey, they can shape soil microbiome composition and functions. While different protists are known to show diverging impacts, it remains impossible to predict a priori the effect of a given species. Various protist traits including phylogenetic distance, growth rate and volume have been previously linked to the predatory impact of protists. Closely related protists, however, also showed distinct prey choices which could mirror specificity in their dietary niche. We, therefore, aimed to estimate the dietary niche breadth and overlap of eight protist isolates on 20 bacterial species in plate assays. To assess the informative value of previously suggested and newly proposed (feeding-related) protist traits, we related them to the impacts of predation of each protist on a protist-free soil bacterial community in a soil microcosm via 16S rRNA gene amplicon sequencing. We could demonstrate that each protist showed a distinct feeding pattern in vitro. Further, the assayed protist feeding patterns and growth rates correlated well with the observed predatory impacts on the structure of soil bacterial communities. We thus conclude that in vitro screening has the potential to inform on the specific predatory impact of selected protists.
Keywords: in vitro assay; dietary niche; microbes; microcosm; predation; soil.
© The Author(s) 2022. Published by Oxford University Press on behalf of FEMS.
Figures


References
-
- Agaras BC, Noguera F, González Anta Get al. . Biocontrol potential index of pseudomonads, instead of their direct-growth promotion traits, is a predictor of seed inoculation effect on crop productivity under field conditions. Biol Control. 2020;143:104209.
-
- Asiloglu R, Kenya K, Samuel SOet al. . Top-down effects of protists are greater than bottom-up effects of fertilisers on the formation of bacterial communities in a paddy field soil. Soil Biol Biochem. 2021;156:108186.
-
- Asiloglu R, Shiroishi K, Suzuki Ket al. . Protist-enhanced survival of a plant growth promoting rhizobacteria, azospirillum sp. B510, and the growth of rice (Oryza sativa L.) plants. Applied Soil Ecology. 2020;154:103599.
-
- Bjørnlund L, Liu M, Rønn Ret al. . Nematodes and protozoa affect plants differently, depending on soil nutrient status. Eur J Soil Biol. 2012;50:28–31.

