. 2022 Jul:53:102319.
doi: 10.1016/j.redox.2022.102319. Epub 2022 Apr 30.

Nitric oxide biosensor uncovers diminished ferrous iron-dependency of cultured cells adapted to physiological oxygen levels

Affiliations

Nitric oxide biosensor uncovers diminished ferrous iron-dependency of cultured cells adapted to physiological oxygen levels

Gulsah Sevimli et al. Redox Biol. 2022 Jul.

Erratum in

Abstract

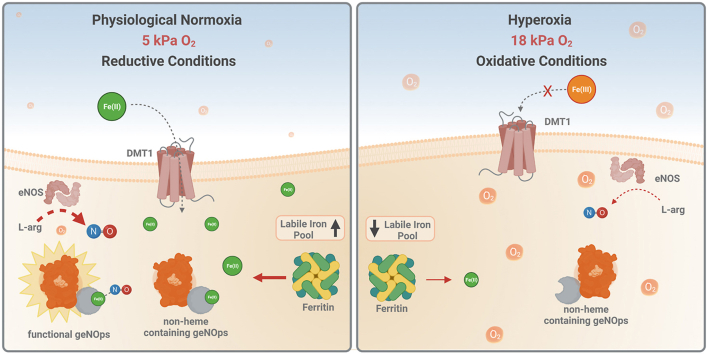
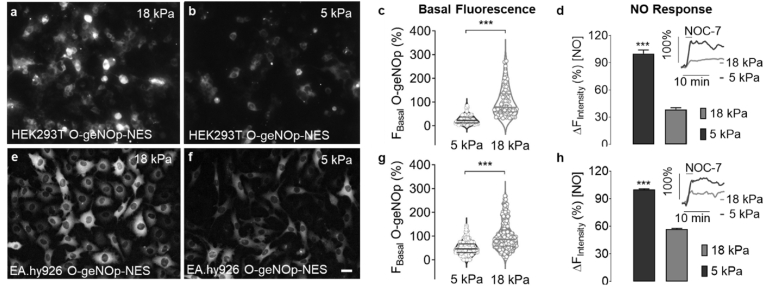
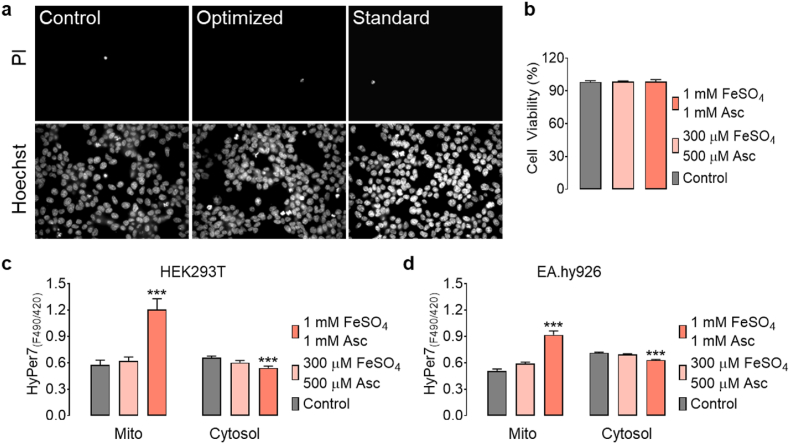
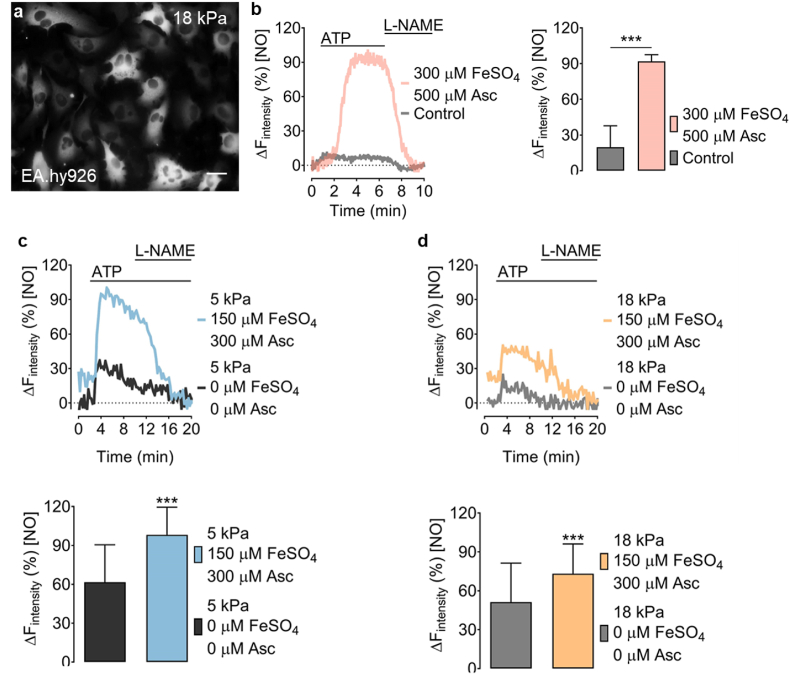
Iron is an essential metal for cellular metabolism and signaling, but it has adverse effects in excess. The physiological consequences of iron deficiency are well established, yet the relationship between iron supplementation and pericellular oxygen levels in cultured cells and their downstream effects on metalloproteins has been less explored. This study exploits the metalloprotein geNOps in cultured HEK293T epithelial and EA.hy926 endothelial cells to test the iron-dependency in cells adapted to standard room air (18 kPa O2) or physiological normoxia (5 kPa O2). We show that cells in culture require iron supplementation to activate the metalloprotein geNOps and demonstrate for the first time that cells adapted to physiological normoxia require significantly lower iron compared to cells adapted to hyperoxia. This study establishes an essential role for recapitulating oxygen levels in vivo and uncovers a previously unrecognized requirement for ferrous iron supplementation under standard cell culture conditions to achieve geNOps functionality.

Keywords: Cell culture; Culture media; Ferric iron; Ferrous iron; Hydrogen peroxide; Hyperoxia; NO bioavailability; Normoxia; Pericellular oxygen; geNOps.


Conflict of interest statement

The authors declare that they have no known competing financial interests or personal relationships that could have appeared to influence the work reported in this paper.

Figures

Image 1
Graphical abstract
Fig. 1
Fig. 1
Effects of ambient oxygen levels on basal and NOC-7 induced geNOps responses in HEK293T and EA.hy926 cells. Representative widefield images of HEK293T cells stably expressing O-geNOp-NES adapted for five days to a, hyperoxic (18 kPa) or b, normoxic (5 kPa) O2 levels. Scale bar represents 20 μm c, Violin plot shows the basal fluorescence intensity of O-geNOp-NES in HEK293T cells after adaptation to 18 kPa (light grey dots, n = 3/70) or 5 kPa (dark grey dots, n = 3/73) O2. Average of cells adapted to 18 kPa O2 have been set as 100% and average of cell adapted to 5 kPa O2 have been normalized, respectively. d, Bar and inset show, respectively, maximum O-geNOp-NES response and representative real-time traces of NO in cells in response to 10 μM NOC-7 after adaptation to 18 kPa (light grey bar and curve, n = 3/33) or 5 kPa O2 (dark grey bar and curve, n = 3/34). e-h, Same experimental setup in EA.hy926 cells as shown in the panels a–d. g, Violin plot shows the measurements of basal fluorescence intensity in EA.hy926 cells after adaptation to 18 kPa (light grey plot, n = 3/327) or 5 kPa (dark grey plot, n = 3/322) O2. h, Bars indicate maximum O-geNOp-NES signals in response to 10 μM NOC-7 in EA.hy926 cells adapted to 18 kPa (light grey bar, n = 3/40) or 5 kPa (dark grey bar, n = 3/41) O2. Insets show representative real-time traces of cells expressing O-geNOp-NES adapted to 18 kPa or 5 kPa O2 in response to 10 μM NOC-7. Students t-test was applied for statistical analysis. All values denote mean ± S.D., ***P < 0.0001.
Fig. 2
Fig. 2
geNOps functionality correlates with cellular iron (II) uptake. a, Representative electron micrographs of HEK293T cells stained with Perls/DAB under control condition (1st image), treated with 1 mM ascorbate (2nd image), treated with 1 mM FeSO4 (3rd image), or treated with 1 mM FeSO4 + 1 mM ascorbate (4th image). Pink arrows indicate accumulated iron particles. Scale bars indicate 10 μm b, Representative low-magnification images of HEK293T cells stained with Hoechst, FeRhoNox-1, and Perls/DAB for CLEM experiments upon treatment with 1 mM FeSO4 for 20 min c, Representative CLEM images of HEK293T cells following treatment with 1 mM ascorbate +1 mM FeSO4 for 20 min. Micrographs (pink bordered) show high magnification of the indicated region. The yellow lines indicate structures of the endoplasmic reticulum (ER). Scale bars of light microscopy images represent 15 μm, 5 μm for low magnification, and 2 μm for high magnification EM images. Representative data were selected from n = 8–15 replicates. (For interpretation of the references to color in this figure legend, the reader is referred to the Web version of this article.)
Fig. 3
Fig. 3
Optimization of iron (II) supplementation in HEK293T cells adapted to 18 kPa O2. a, Representative confocal images of HEK293T cells stained with FeRhoNox-1 under non-treated conditions (left image), treated with optimized iron (II) levels of 300 μM FeSO4 + 500 μM ascorbate for 15 min (middle image) and standard procedure 1 mM FeSO4 + 1 mM ascorbate for 20 min (right image). Bars show FeRhoNox-1 intensities under control conditions (grey bar, n = 7/443), optimized iron (II) concentration conditions (light pink bar, n = 10/469), or standard iron (II) treatment conditions (pink bar, n = 11/511). b, Representative real-time traces of geNOps signals in HEK293T cells in response to 10 μM NOC-7 (NO donor). Representative curves show NO signals in cells without iron (II) treatment (grey curve), with optimized iron (II) solution (light pink curve) and cells treated with the standard iron protocol (pink curve). Bars show respective maximum NO responses: control conditions; grey bar, n = 3/36, optimized iron supplementation; light pink bar, n = 3/48, and standard conditions; pink bar, n = 3/53. c, Representative micrographs of SEM/EDX measurements in HEK293T cells untreated (left image), optimized iron supplementation (middle image), or treated with the standard iron protocol (right image). Bars represent total cellular iron content without (grey bar, n = 3) or upon optimized (light pink bar, n = 3) or standard iron (II) supplementation (pink bar, n = 3). Dunnett's Multiple Comparison Test was applied to compare the total iron content following treatments relative to the control column. All values denote mean ± S.D., P < 0.0001 (###Control vs 300 μM FeSO4 + 500 μM ascorbate; ***Control vs 1 mM FeSO4 + 1 mM ascorbate). Scale bar represents 5 μm. (For interpretation of the references to color in this figure legend, the reader is referred to the Web version of this article.)
Fig. 4
Fig. 4
Analysis of cell toxicity and mitochondrial reactive oxygen species following iron (II) supplementation in HEK293T and/or EA.hy926 cells adapted to 18 kPa O2. a, Representative widefield images of HEK293T cells co-stained with propidium iodide and Hoechst under control conditions (left images), treated with 300 μM FeSO4 + 500 μM ascorbate for 15 min (middle images), or treated with 1 mM FeSO4 + 1 mM ascorbate for 20 min (right images). b, Bars represent cell viability under control conditions (grey bar, n = 6/60), 300 μM FeSO4 + 500 μM ascorbate (light pink bar, n = 6/60), and 1 mM FeSO4 + 1 mM ascorbate (pink bar, n = 6/60). (c) Bars show basal HyPer7 ratio levels in the mitochondria and cytosol of HEK293T cells under control conditions (mito: grey bar, n = 28/280; cyto: n = 30/300) and following acute treatment with 300 μM FeSO4 + 500 μM ascorbate (mito: light pink bar, n = 27/270; cyto: n = 30/300), or 1 mM FeSO4 + 1 mM ascorbate (mito: pink bar, n = 25/250; cyto: n = 30/300). d, Basal HyPer7 ratio levels in mitochondria and cytosol of EA.hy926 cells under control conditions (mito: grey bar, n = 18/180; cyto: n = 34/340) and following acute treatment with 300 μM FeSO4 + 500 μM ascorbate (mito: light pink bar; n = 18/180; cyto: n = 34/340), or 1 mM FeSO4 + 1 mM ascorbate (mito: pink bar, n = 18/180; cyto: n = 34/340). HyPer7 ratio signals have been calculated by post image processing from static images (F490/F420). Dunnett's Multiple Comparison Test was applied to compare all treatments relative to the control column. All values denote mean ± S.E.M., P < 0.0001. (For interpretation of the references to color in this figure legend, the reader is referred to the Web version of this article.)
Fig. 5
Fig. 5
Visualizing intracellular NO signals in endothelial cells adapted to physiological normoxia or hyperoxia. a, Representative widefield image of EA.hy926 cells stably expressing O-geNOp-NES adapted to 18 kPa O2. b, Representative real-time traces of endogenous NO signals in EA.hy926 cells in response to 100 μM ATP and subsequent administration of 500 μM l-NAME under control conditions (no iron treatment, grey curve, and bar, n = 3/54) or pretreated with the optimized iron solution (pink curve and bar, n = 3/29). c, Representative real-time traces show endogenous NO signals in EA.hy926 cells, expressing O-geNOp-NES adapted to 5 kPa O2. Cells were treated with 30 μM ATP and subsequently with 1 mM l-NAME. The blue curve shows cells pretreated with 150 μM FeSO4 + 300 μM ascorbate and the dark grey curve the NO response in cells without any treatment prior to imaging. Bars show maximum NO responses in cells without iron (II) treatment (dark grey bar, n = 3/107) or treatment with 150 μM FeSO4 + 300 μM ascorbate (blue bar, n = 3/107). d, Experiments were conducted with cells under the same treatment conditions shown in panel (c), but following adaptation of cells for five days to 18 kPa O2. Light grey curve and bars show NO responses with no iron (II) treatment (n = 3/107), and yellow curve and bars show NO responses in cells treated with 150 μM FeSO4 + 300 μM ascorbate (n = 3/107). Student's t-test, was performed to determine statistical differences. All values denote mean ± S.D., ***P < 0.0001. (For interpretation of the references to color in this figure legend, the reader is referred to the Web version of this article.)

Similar articles

Cited by

References

    1. Rouault T.A. Iron metabolism in the CNS: implications for neurodegenerative diseases. Nat. Rev. Neurosci. 2013;14:551–564. - PubMed
    1. Crielaard B.J., Lammers T., Rivella S. Targeting iron metabolism in drug discovery and delivery. Nat. Rev. Drug Discov. 2017;16:400–423. - PMC - PubMed
    1. Torti S.V., Torti F.M. Iron and cancer: more ore to be mined. Nat. Rev. Cancer. 2013;13:342–355. - PMC - PubMed
    1. Beard J.L. Iron biology in immune function, muscle metabolism and neuronal functioning. J. Nutr. 2001;131:568S–580S. - PubMed
    1. Stephenson E., Nathoo N., Mahjoub Y., Dunn J.F., Yong V.W. Iron in multiple sclerosis: roles in neurodegeneration and repair. Nat. Rev. Neurol. 2014;10:459–468. - PubMed

Publication types