. 2022 Jul 6;110(13):2124-2138.e8.
doi: 10.1016/j.neuron.2022.04.008. Epub 2022 May 6.

Walking strides direct rapid and flexible recruitment of visual circuits for course control in Drosophila

Affiliations

Walking strides direct rapid and flexible recruitment of visual circuits for course control in Drosophila

Terufumi Fujiwara et al. Neuron. .

Abstract

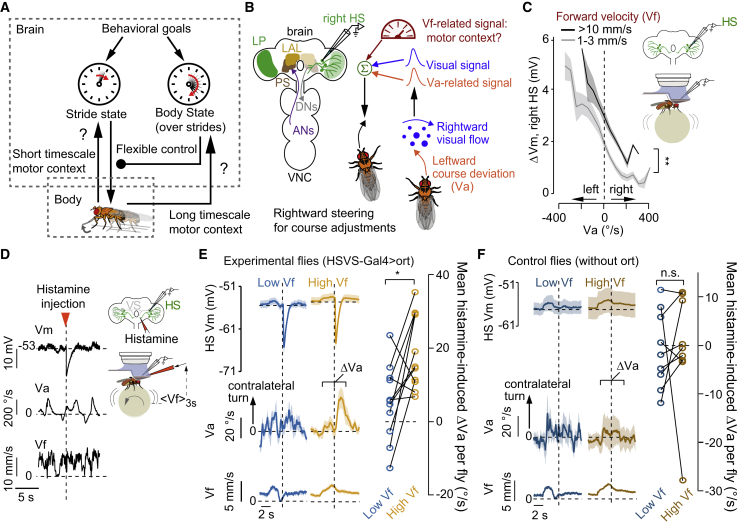
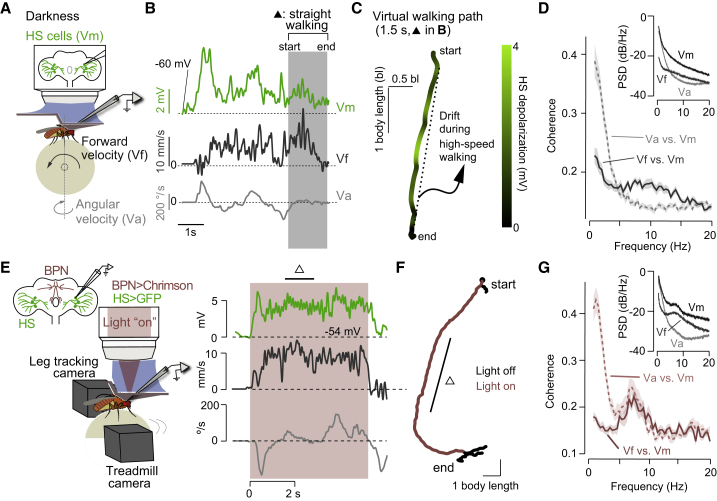
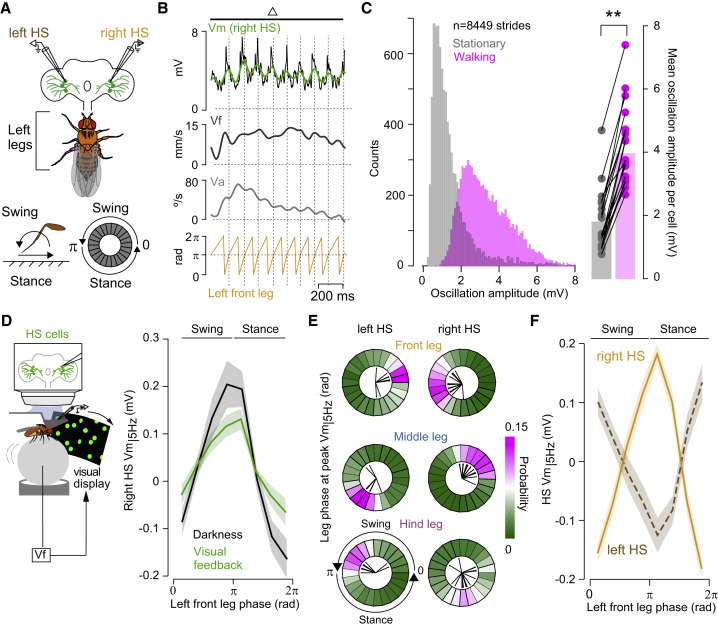
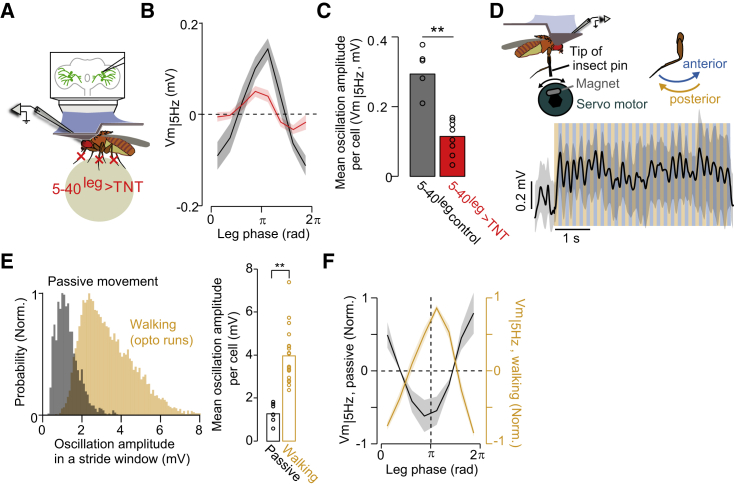
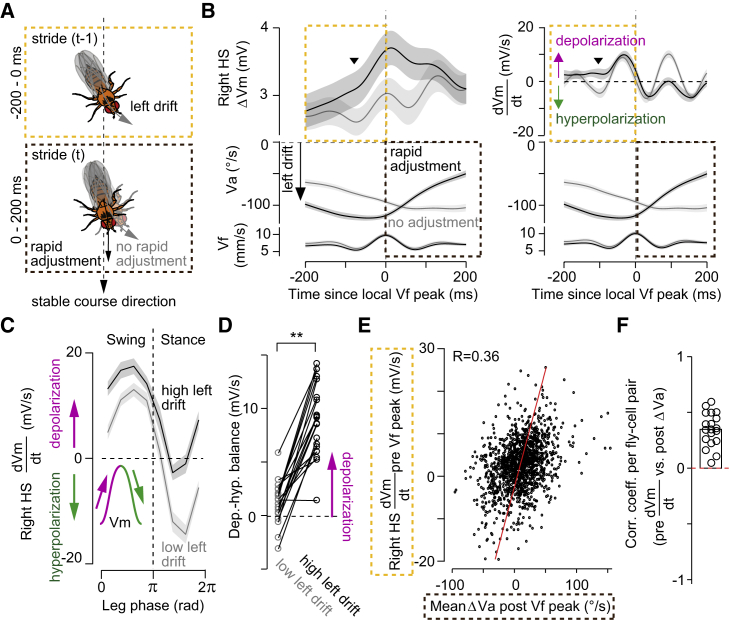
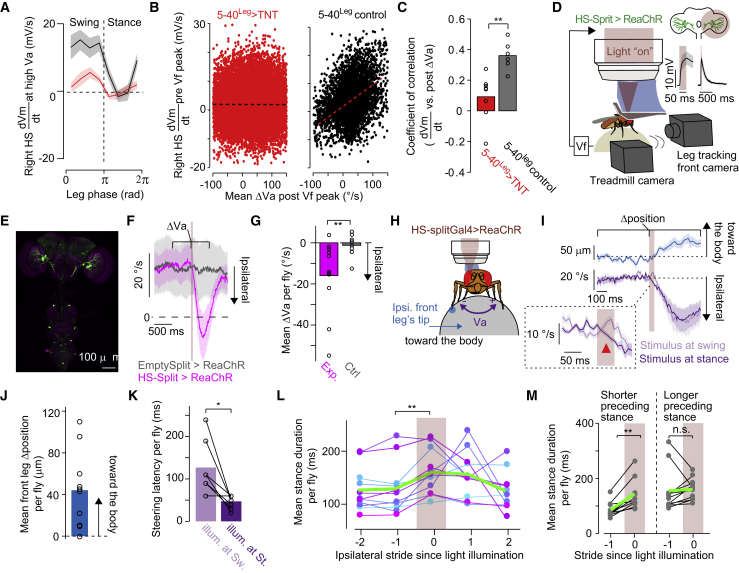
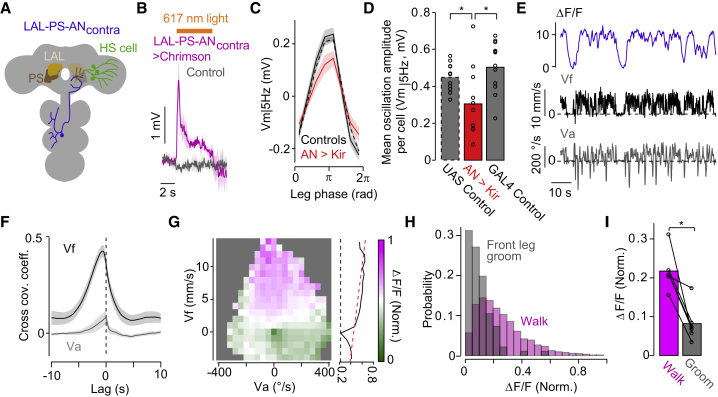
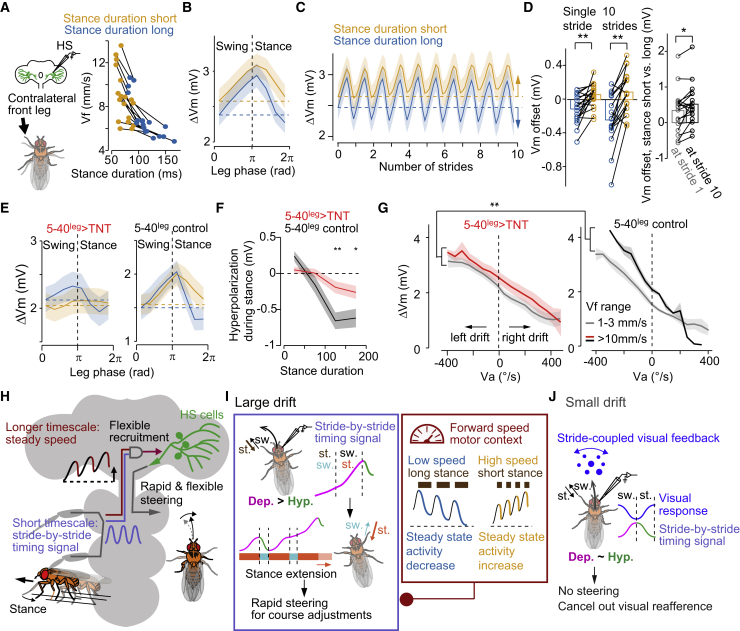
Flexible mapping between activity in sensory systems and movement parameters is a hallmark of motor control. This flexibility depends on the continuous comparison of short-term postural dynamics and the longer-term goals of an animal, thereby necessitating neural mechanisms that can operate across multiple timescales. To understand how such body-brain interactions emerge across timescales to control movement, we performed whole-cell patch recordings from visual neurons involved in course control in Drosophila. We show that the activity of leg mechanosensory cells, propagating via specific ascending neurons, is critical for stride-by-stride steering adjustments driven by the visual circuit, and, at longer timescales, it provides information about the moving body's state to flexibly recruit the visual circuit for course control. Thus, our findings demonstrate the presence of an elegant stride-based mechanism operating at multiple timescales for context-dependent course control. We propose that this mechanism functions as a general basis for the adaptive control of locomotion.

Keywords: Drosophila; ascending neurons; locomotion control; motor context; multi-timescale processing; steering; stride cycle; visuomotor integration.


Conflict of interest statement

Declaration of interests The authors declare no competing interests.

Figures

Figure 1
Figure 1
HS cells contribute to steering in high- but not low-speed walking bouts (A) Schematic of brain-body interactions across timescales. (B) Schematic of the anatomy (left) and physiological properties of HS cells during walking (right). (C) Change in membrane potential (ΔVm) as a function of the angular velocity (Va) of the fly in walking bouts with low (gray) or high (black) forward velocity (Vf) (p = 0.79 for the slope; p = 0 for the offset difference between curves, grand mean ± SEM, n = 556 bouts from 9 flies, bootstrapping method). (D) Conditional unilateral inhibition in HS cells (right). Example time series of Vm, Va, and Vf with a single histamine application in HS cells expressing the Ort histamine receptor. (E) Left, Vm, Va, and Vf traces in experimental flies (grand mean ± SEM, n = 11 flies) triggered at histamine injection during low (blue) or high (orange) Vf. Right, mean histamine-induced change in Va (ΔVa) per fly. Lines connect the same individual (p = 0.019, n = 11 flies, the signed-rank test). (F) Same as (E) but for controls (p = 0.36, n = 9 flies, signed-rank test). See also Figure S1.
Figure 2
Figure 2
HS cells and the forward velocity of the fly oscillate at high frequencies during fast walking (A) Schematic of the experimental configuration. (B) Example traces of Vm (green, right HS cell), Vf (black), and Va (gray). The shade highlights a segment with high Vf and low Va (i.e., straight walking). (C) Virtual walking path from the straight walking segment in (B). Color code: Vm activity. (D) Coherence between Va and Vm (dashed), or Vf and Vm (solid, grand mean ± SEM, n = 25 fly cell pairs). The inlet shows the power spectral density of Vm, Vf, and Va. (E) Left, schematic of the opto-run paradigm. Right, example traces of Vm (green, right HS cell), Vf (black), and Va (gray) in opto-runs (red shade). (F) The virtual path for traces in (E). Δ: straight segment. (G) Same as (D) but in opto-runs (n = 19 fly cell pairs).
Figure 3
Figure 3
High-speed walking bouts reveal specific phase relations between neural activity and the stride cycle (A) Schematic of experimental configuration and definitions. (B) Example traces of Vm (black: raw, green: filtered), Vf, Va, and the left front leg phase, triggered at the stance onset. (C) Left, distribution of the magnitude of the oscillations during walking (magenta) versus quiescence (gray) across 19 fly-cell pairs. Right, mean amplitude of oscillations during walking (3.95 ± 0.29 mV) and quiescence (1.79 ± 0.22 mV) (p = 0.00013, Z = 3.823, the signed-rank test). (D) Left, schematic of the experimental configuration. Right, tuning of right HS cells (Vm|5 Hz) to the stride cycle of the left front leg during spontaneous walking in darkness (black) and under visual feedback (green, n = 8 fly cell pairs, grand mean ± SEM). (E) Probability distributions of the phase of the stride cycle at the peak of Vm|5 Hz oscillation (contralateral/ipsilateral cells, 4,182–4,747/1,937–2,269 strides, n = 19/11 fly cell pairs). Black lines indicate the mean per cell. (F) Vm|5 Hz as a function of the stride cycle of the left front leg during opto-runs (right cells: solid orange, n = 19 fly cell pairs; left cells: dashed maroon, n = 11 fly cell pairs). See also Figures S2–S4 and Video S1.
Figure 4
Figure 4
The stride-coupled modulation in HS cells depends on leg mechanosensory signals (A) Schematic of the experimental configuration. (B) Vm|5 Hz as a function of the stride cycle of the left front leg (grand mean ± SEM). Red, 5-40leg > TNT flies (n = 8 fly cell pairs); black, controls (n = 6 fly cell pairs). (C) Mean amplitude of oscillations of Vm|5 Hz (∗∗p = 0.00067, the rank-sum test). (D) Top, schematic of the experimental configuration. Bottom, time series of Vm (mean ± SD, n = 10 trials) during passive leg motion along the anterior (blue)-posterior (orange) axis. (E) Distribution of the magnitude of oscillations in Vm during walking (orange, same as in Figure 3C) and passive leg motion (gray, 1,920 fictive strides from 8 flies). Right, mean amplitude of oscillations per cell during walking (3.95 ± 0.29 mV) and passive leg motion (1.27 ± 0.15 mV) (p < 10−4, Z = 4, the rank-sum test). (F) Vm|5 Hz as a function of the stride (orange)/passive motion (black) cycle. Curves were normalized per cell. See also Figure S5.
Figure 5
Figure 5
Imbalanced depolarization-hyperpolarization in HS cells within a stride correlates with rapid steering adjustments (A) Schematic with time windows used for analysis. (B) ΔVm (left), or its temporal derivative dVm/dt (right), Va, and Vf triggered at the local Vf peak in walking segments drifting leftwards (Va < −50°/s, grand mean ± SEM, n = 19 fly cell pairs). Traces were separated based on drift adjustment after the peak in Vf. Arrowheads highlights an overall increase in ΔVm for segments with rapid adjustments (black trace). (C) dVm/dt as a function of the stride cycle of the left front leg during low (−50 < Va < 0°/s) or high (−200 < Va < −150°/s) drift. (D) Depolarization-hyperpolarization balance across strides during low or high drift (p = 0.00016, Z = −3.78, n = 19 fly cell pairs, signed-rank test). (E) Mean dVm/dt before peak Vf (−200:0 ms window, with peak Vf at 0, see A) as a function of the mean drift attenuation after peak Vf (0–200-ms window) for every segment (n = 1,378 segments from 19 fly cell pairs). The linear regression fit is indicated. (F) Correlation between dVm/dt before peak Vf and drift attenuation after Vf per cell. The correlation was consistently positive (p = 0.00013, Z = 3.82, n = 19 fly cell pairs, the signed-rank test). See also Figure S6.
Figure 6
Figure 6
A rapid depolarization in HS cells leads to steering in a stride-dependent manner (A) dVm/dt (right HS cells) in segments drifting leftwards (−200 < Va < −150°/s) as a function of the stride cycle (left front leg) in 5-40Leg > TNT (red, grand mean ± SEM, n = 8 fly cell pairs) or control (black, n = 6 fly cell pairs) flies. (B) Mean dVm/dt before peak Vf as a function of the drift attenuation after peak Vf (see Figure 5) per walking segment (5-40Leg > TNT, red: n = 18,319 segments; control, black: n = 3,065 segments). Linear regression fits are indicated (5-40Leg > TNT: R = −0.01, p = 0.41; control: R = 0.38, p < 10−16, Student’s t test). (C) Analysis in (B) was performed per fly (p = 0.0013, the rank-sum test). (D) Schematic of the experimental configuration. The inlet shows ReaChR-expressing HS cells’ response to light (red shades) at different timescales (n = 9 cells). (E) Confocal image of the split-HS line expressing ReaChR. (F) Va traces in experimental (magenta, n = 11 flies) and control (gray, n = 8 flies) flies triggered at light stimulation. (G) Mean change in Va (ΔVa) per fly upon light stimulation (p = 0.0091, the rank-sum test). (H) Schematic of the experimental configuration. (I) The leg’s horizontal position (n = 11 flies) and the fly’s Va (baseline subtracted per fly, n = 7 flies), triggered at light stimulation (red shade). Va traces are separated by the stride-cycle phase of the leg at stimulation, either in swing (light purple) or stance (dark purple). The inlet highlights the onset steering response, with the red arrowhead indicating the offset between the traces. (J) Mean shift in leg position (Δposition) per fly (p = 0.0020, n = 11 flies, the rank-sum test). (K) Steering onset latency for stimulation at swing (light purple) or stance (dark purple, p = 0.031, n = 7 flies, the signed-rank test). (L) Mean stance duration of five consecutive strides around light stimulation (strides preceding versus at stimulation: p = 0.0020, n = 11 flies, the signed-rank test). Colored lines show individual fly data and green indicate the grand mean. (M) Mean stance duration of strides preceding versus at light delivery, in strides with shorter (p = 0.0010, left) or longer (p = 0.32, right) preceding stance duration. n = 11 flies, signed-rank test. See also Video S2.
Figure 7
Figure 7
Vf-sensitive ascending neurons (ANs) contribute to the stride-coupled modulation (A) Schematic of the anatomy of the identified ANs. (B) HS cells’ activity upon optogenetic activation of LAL-PS-ANcontra (orange bar) in experimental (magenta, grand mean ± SEM, n = 5 cells) or control (gray, n = 3 cells) flies. (C) Vm|5 Hz as a function of the stride cycle (left front leg) in AN-silenced (red, n = 11 fly cell pairs), GAL4 (solid black, n = 12 fly cell pairs), and UAS (dashed black, n = 14 fly cell pairs) control flies. (D) Mean Vm|5 Hz oscillation amplitude in experimental (red), GAL4 (solid black, p = 0.029, Z = −2.18, signed-rank test) and UAS (dashed black, p = 0.040, Z = −2.05, the signed-rank test) controls. (E) Example traces of the left LAL-PS-ANcontra (calcium signal, ΔF/F), Vf, and Va. (F) The cross-covariance coefficient between ΔF/F and Vf or Va (n = 7 fly cell pairs). (G) ΔF/F (normalized per fly and pooled across 7 flies) as a function of Va and Vf. Right, the Vf tuning (mean ΔF/F over Va) plotted with a linear fit. (H) Probability distributions of the magnitude of ΔF/F in walking (magenta, 2,909 events from 6 flies) versus front leg grooming (gray, 96 events). (I) Mean ΔF/F in walking versus grooming per fly (p = 0.031, n = 6 fly cell pairs, the signed-rank test). See also Figure S7.
Figure 8
Figure 8
The duration of the stance controls the hyperpolarization in HS cells at multiple timescales (A) Left, schematic of the experimental configuration. Right, the relation between Vf and stance duration during head-fixed walking on the ball. Orange/blue: short/long stances (n = 19 fly cell pairs; lines connect the same individual). The fly walks faster with shorter stances (p = 0.000163, Z = 3.82, the signed-rank test). (B) ΔVm (grand mean ± SEM, n = 19 fly cell pairs) as a function of the stride cycle for shorter (orange) and longer (blue) stances. (C) Same as (B), but for 10 consecutive strides (n = 17 fly cell pairs). (D) The difference between Vm at the beginning versus the end (“offset,” dashed lines in B and C) of a single (left) or ten consecutive strides (middle). p = 0.00054, Z = −3.46, n = 19 fly cell pairs for a single stride; p = 0.00060, Z = −3.43, n = 17 fly cell pairs for ten strides. Right, the offset in Vm was compared between the end of stride 1 and 10. P = 0.019, Z = −2.34, n = 17 fly cell pairs, the signed-rank test. (E) Same as (B) but for 5-40Leg > TNT (n = 8 fly cell pairs) and control (n = 6 fly cell pairs) flies. (F) The hyperpolarization of HS cells during stance as a function of stance duration (5-40Leg > TNT, red, n = 8 fly cell pairs; control, black, n = 6 fly cell pairs). p < 0.05; ∗∗p < 0.01, the rank-sum test. (G) ΔVm as a function of Va during low and high Vf in 5-40Leg > TNT (n = 8 fly cell pairs) and control (n = 5 fly cell pairs) flies. Vf-dependent Vm offset in 5-40Leg > TNT flies was smaller than in control flies (∗∗p = 0, bootstrapping, see also Figure 1). (H–J) Summary of the findings (H) and the proposed function for the stride-coupled modulation during fast and drifting walking (I) and during fast, straight walking (J) in HS cells. See also Figure S8.

Similar articles

Cited by

References

    1. Augustine V., Lee S., Oka Y. Neural control and modulation of thirst, sodium appetite, and hunger. Cell. 2020;180:25–32. - PMC - PubMed
    1. Bargmann C.I. Beyond the connectome: how neuromodulators shape neural circuits. BioEssays. 2012;34:458–465. - PubMed
    1. Bässler U., Büschges A. Pattern generation for stick insect walking movements—multisensory control of a locomotor program. Brain Res. Brain Res. Rev. 1998;27:65–88. - PubMed
    1. Bates A.S., Manton J.D., Jagannathan S.R., Costa M., Schlegel P., Rohlfing T., Jefferis G.S.X.E. The natverse, a versatile toolbox for combining and analysing neuroanatomical data. eLife. 2020;9:1–35. - PMC - PubMed
    1. Bernstein N. Pergamon Press; 1967. The Coordination and Regulation of Movements.

Publication types

LinkOut - more resources