. 2022 May 26;185(11):1924-1942.e23.
doi: 10.1016/j.cell.2022.04.019. Epub 2022 May 6.

Lymph node colonization induces tumor-immune tolerance to promote distant metastasis

Affiliations

Lymph node colonization induces tumor-immune tolerance to promote distant metastasis

Nathan E Reticker-Flynn et al. Cell. .

Abstract

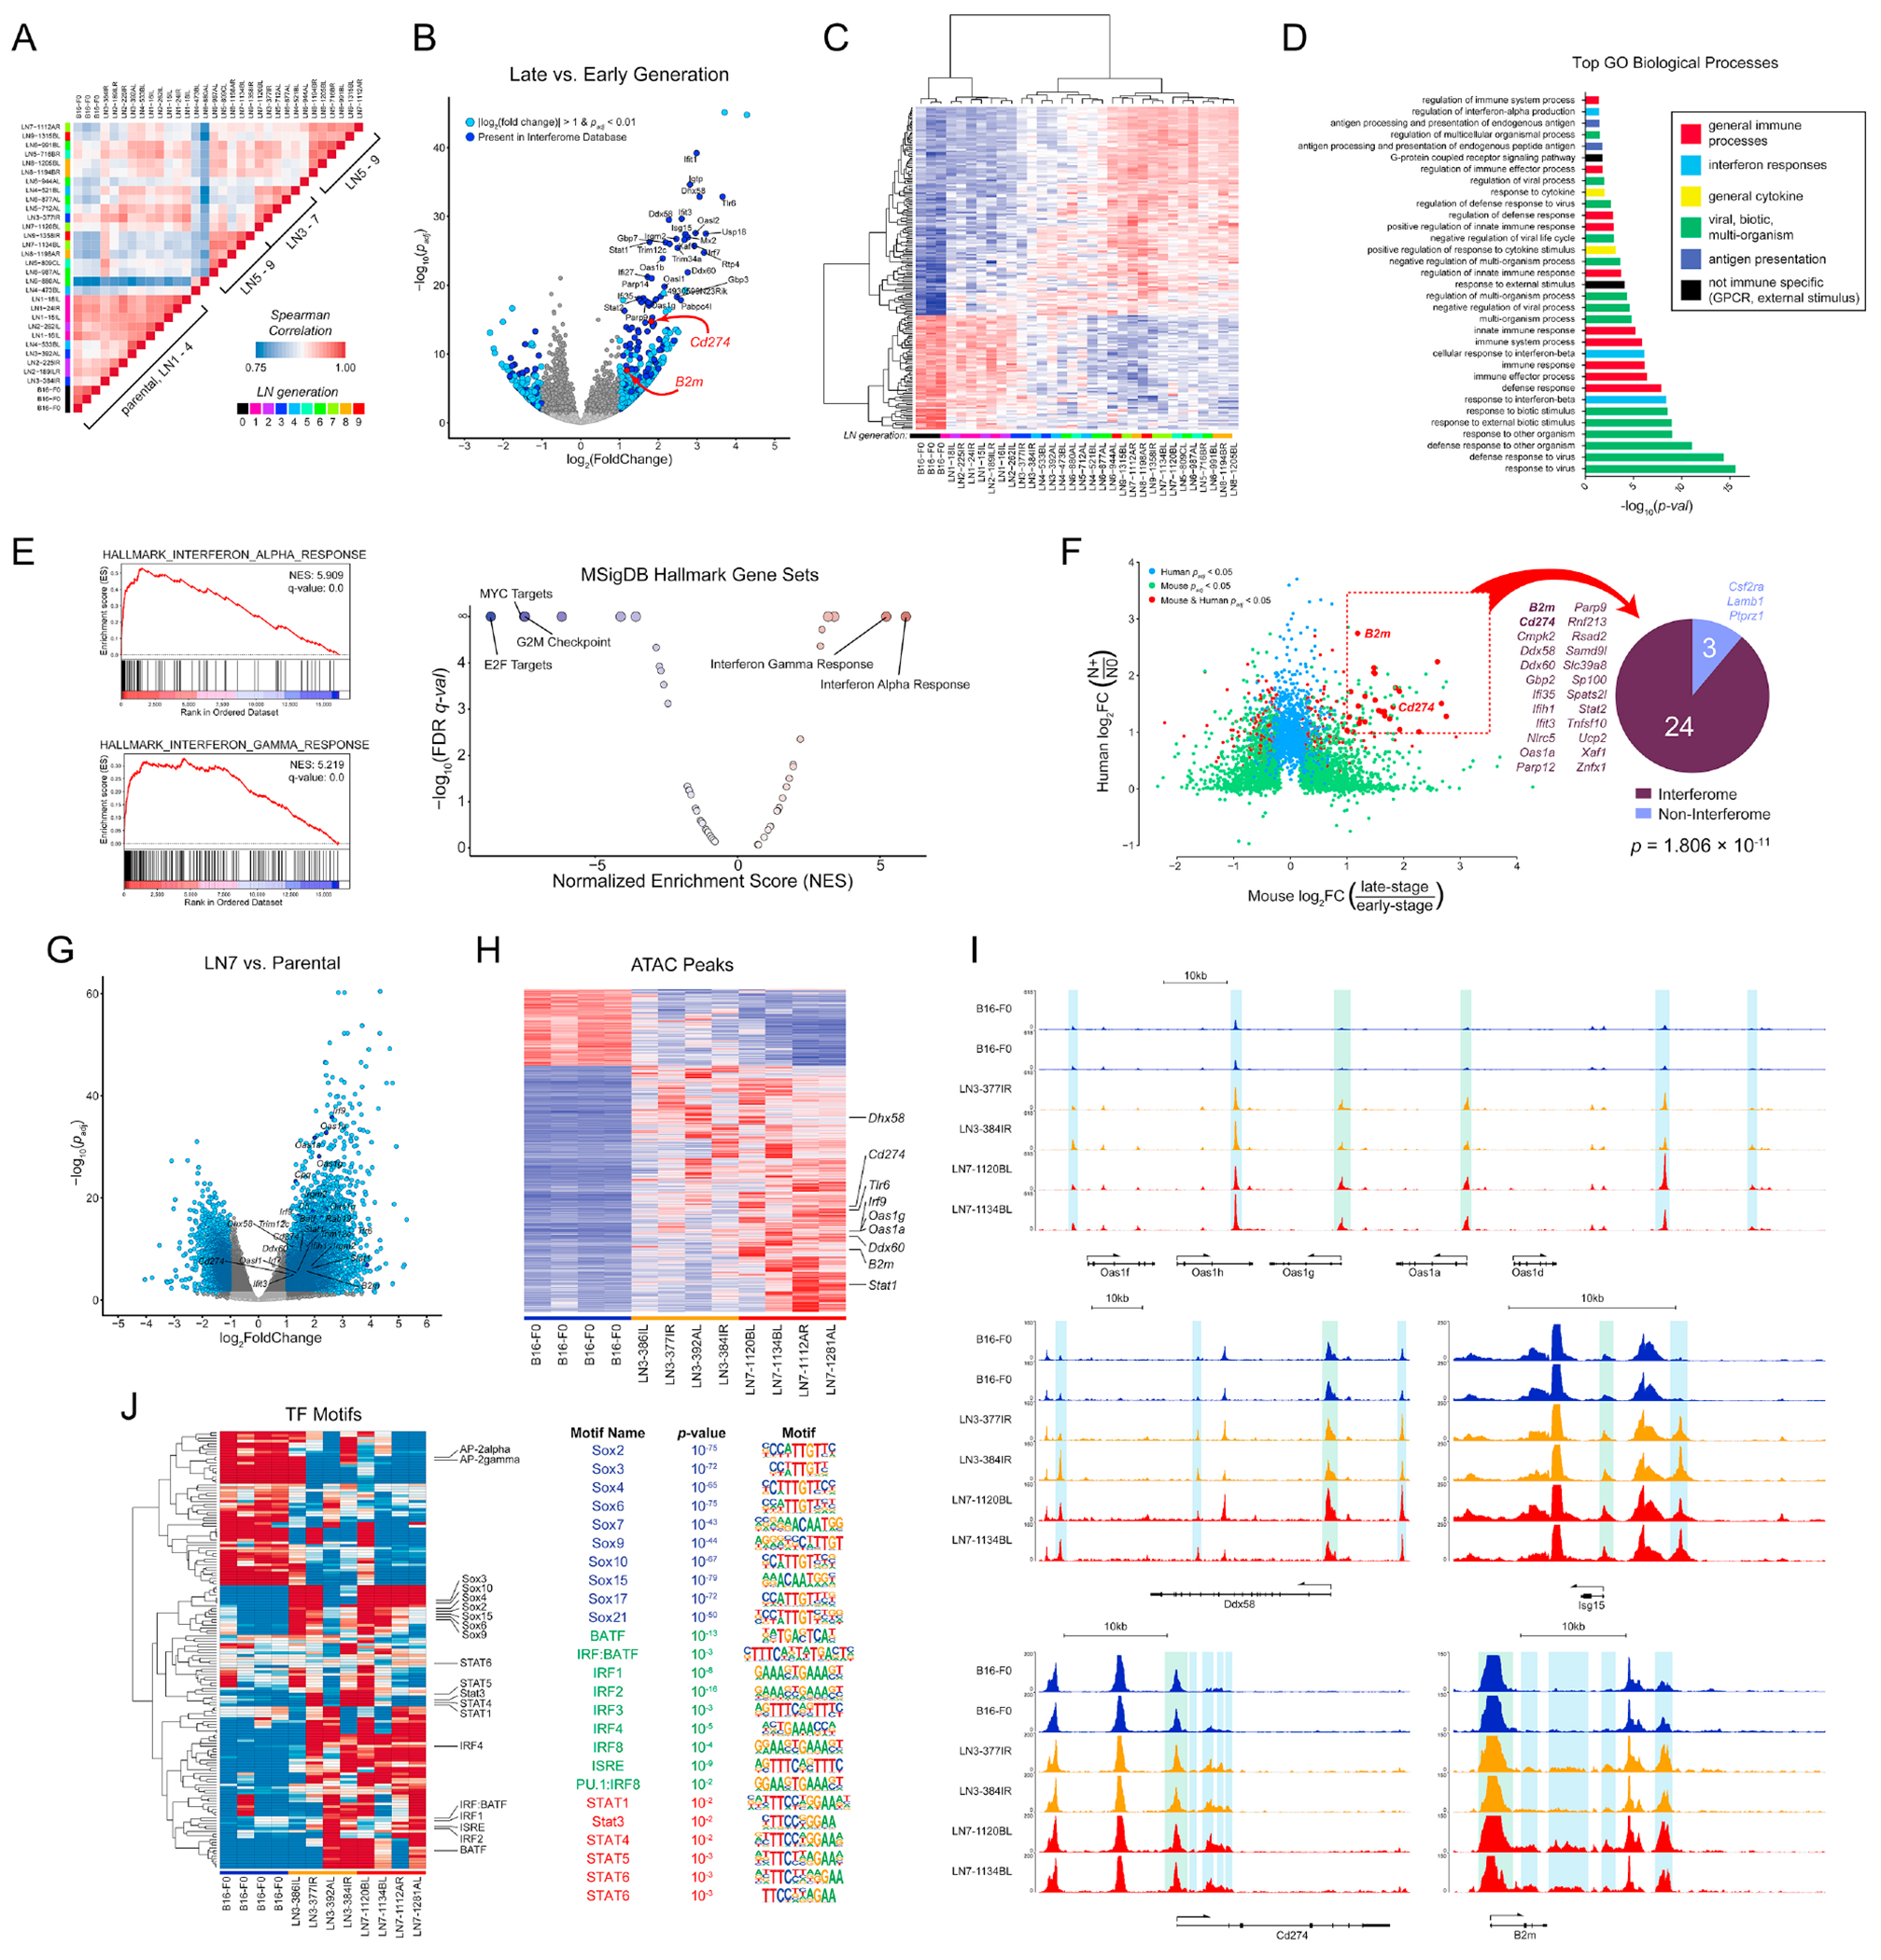
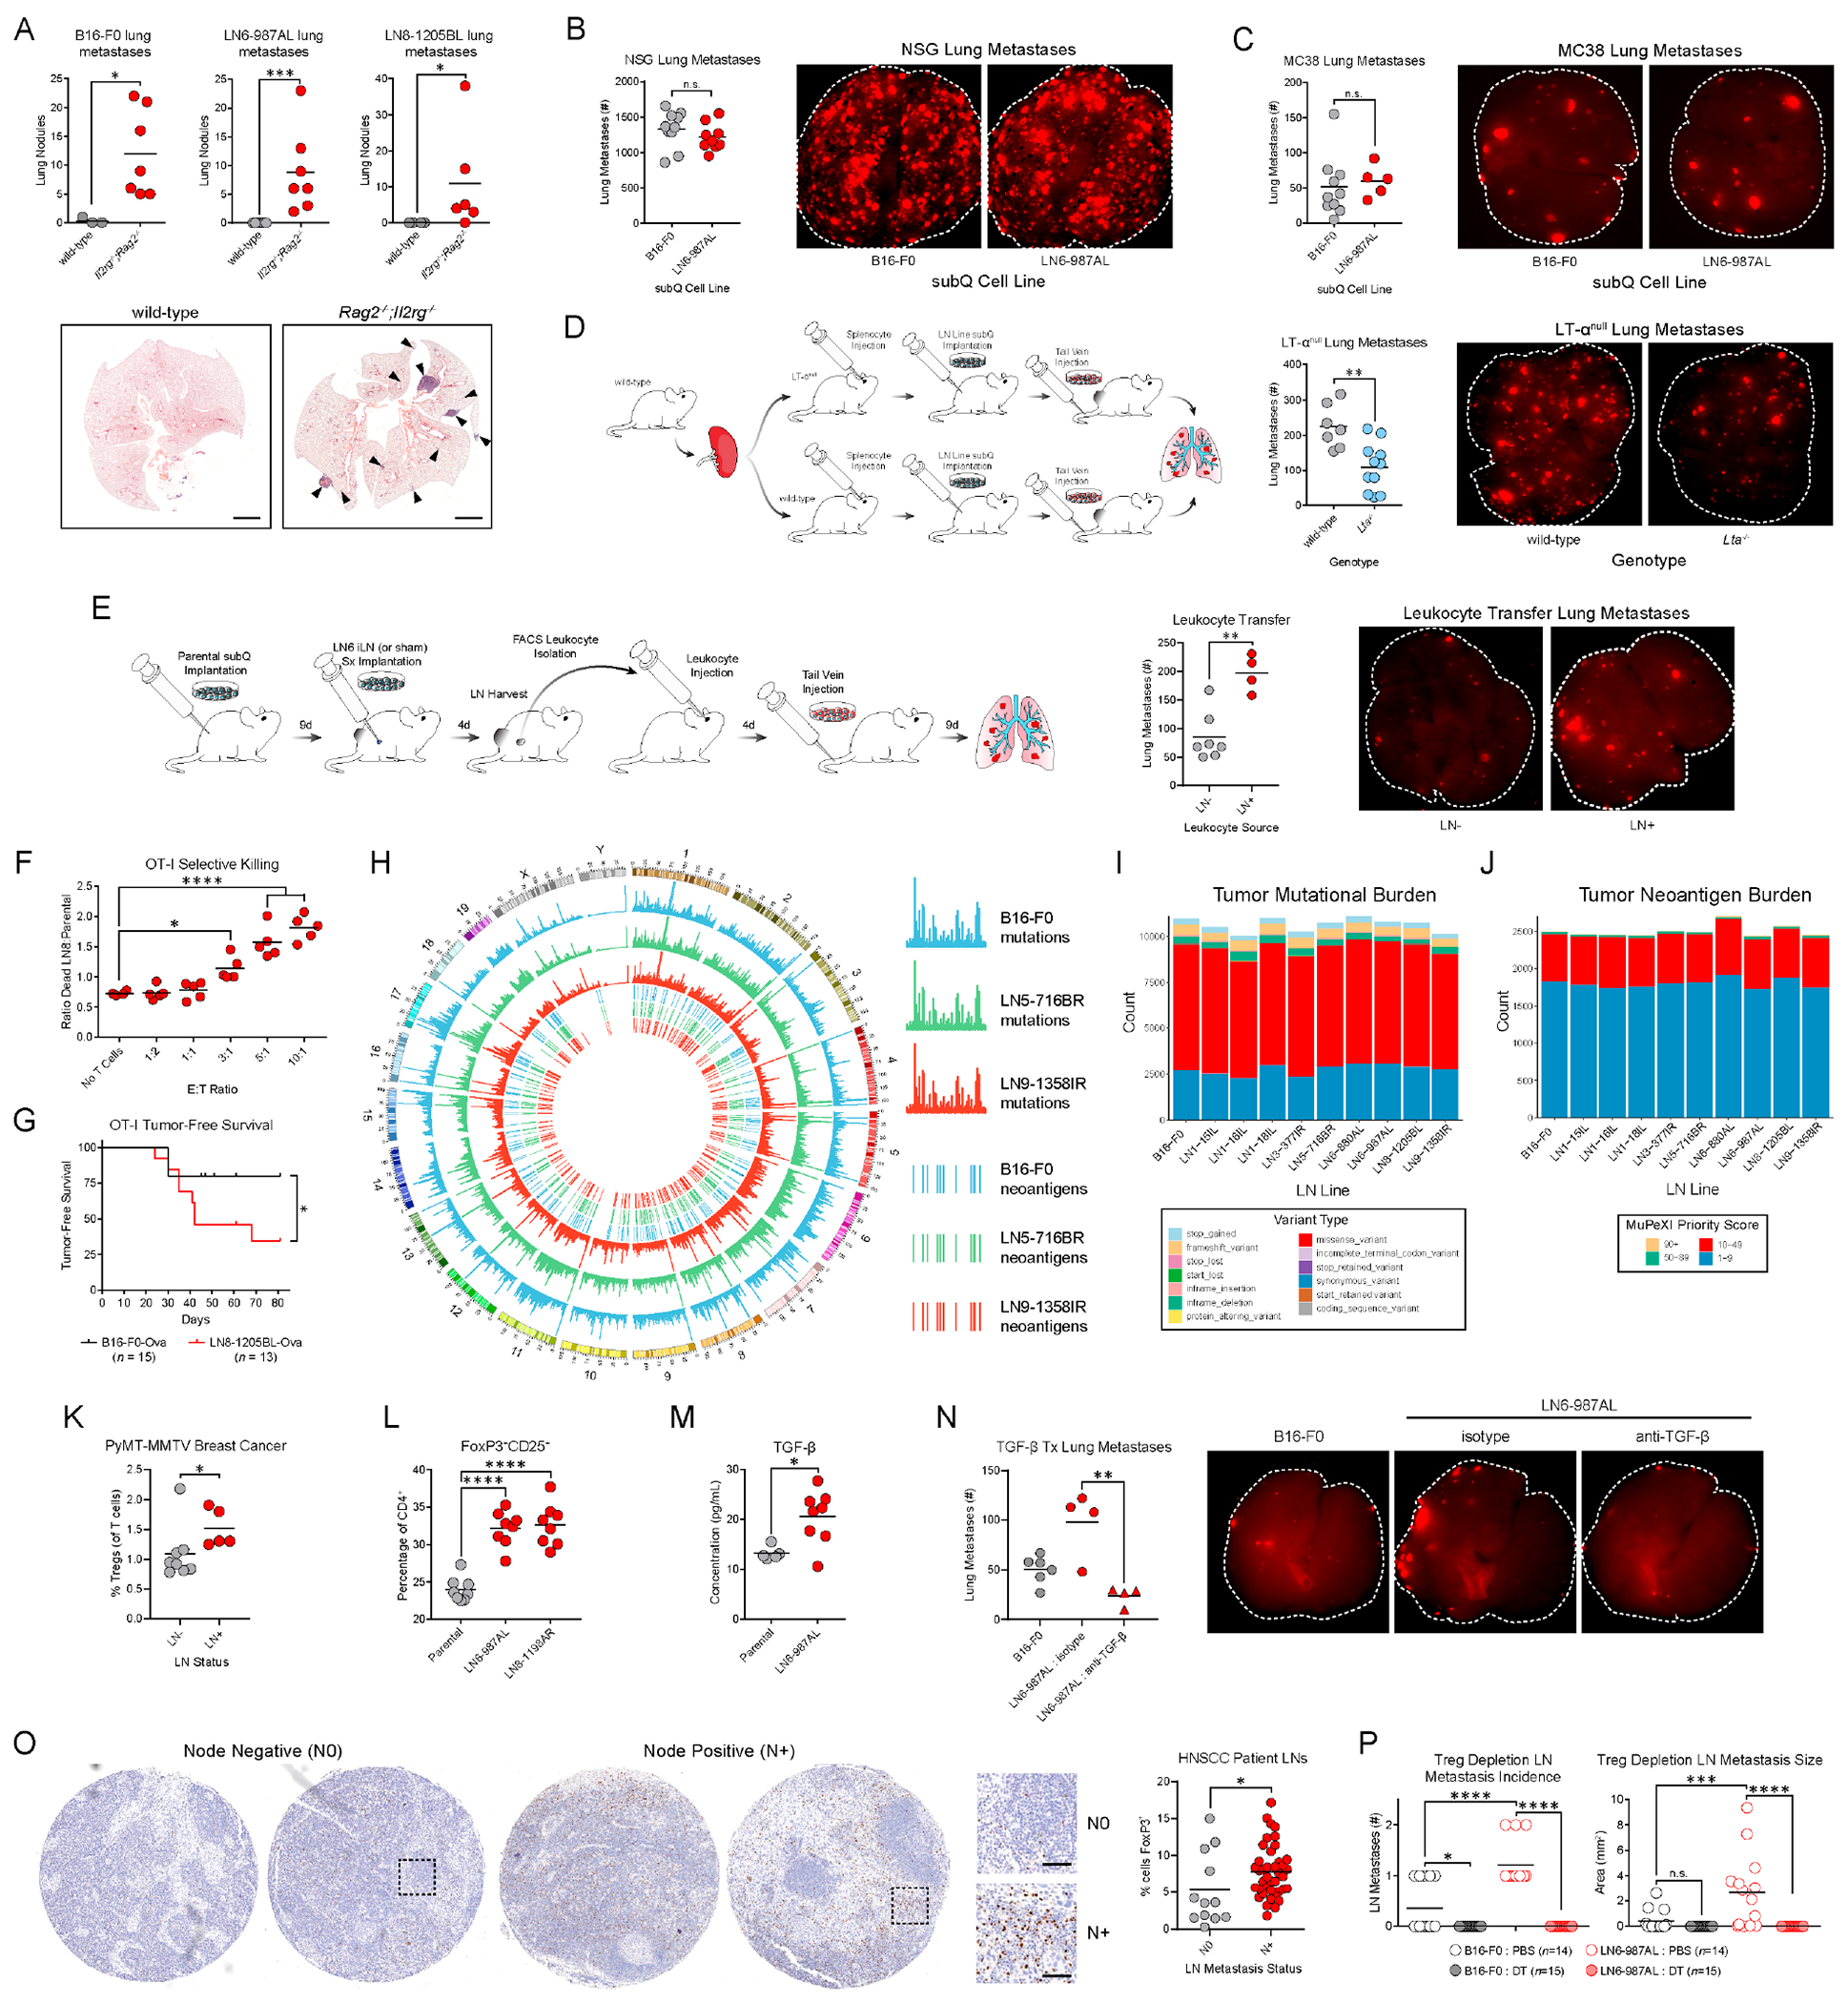
For many solid malignancies, lymph node (LN) involvement represents a harbinger of distant metastatic disease and, therefore, an important prognostic factor. Beyond its utility as a biomarker, whether and how LN metastasis plays an active role in shaping distant metastasis remains an open question. Here, we develop a syngeneic melanoma mouse model of LN metastasis to investigate how tumors spread to LNs and whether LN colonization influences metastasis to distant tissues. We show that an epigenetically instilled tumor-intrinsic interferon response program confers enhanced LN metastatic potential by enabling the evasion of NK cells and promoting LN colonization. LN metastases resist T cell-mediated cytotoxicity, induce antigen-specific regulatory T cells, and generate tumor-specific immune tolerance that subsequently facilitates distant tumor colonization. These effects extend to human cancers and other murine cancer models, implicating a conserved systemic mechanism by which malignancies spread to distant organs.

Keywords: ISGs; MHC-I; NK cells; PD-L1; Tregs; interferon; lymph nodes; metastasis; regulatory T cells; tolerance.


Conflict of interest statement

Declaration of interests The authors declare no competing interests.

Figures

Figure 1 |
Figure 1 |. LN metastases promote distant tissue metastasis.
(A) LN metastatic tumor lines were generated through serial in vivo selection of LN metastases over nine generations. (B) Phylogenetic relationships between the cell lines. IL/IR, left/right inguinal; AL/AR, left/right axillary; BL/BR, left/right brachial. (C) Incidence of metastases in inguinal, axillary, or brachial LNs for different cell lines (n denoted in parentheses). (D) Setup of metastatic competition assay. (E) Tumor line percentages in draining LNs by flow cytometry. Representative whole-tissue fluorescence images of excised LNs (F) and lungs (G). (H) Histology of a lung metastasis. Scale bar: 100μm. (I) Percentage of lung metastases derived from parental or LN6 lines compared to draining LN metastases in the same mice. (J) Lung metastases following transplantation of parental, LN6, or LN8 cells and tail vein injections of B16-F0-tdTomato. See also Figure S1.
Figure 2 |
Figure 2 |. LN metastases exhibit a transcriptional profile dominated by ISGs.
(A) Pairwise Spearman correlations of tumor line transcriptional profiles. (B) Changes in gene expression between late to early generation lines. Light blue: genes with |log2FC| > 1 and padj < 0.01. Dark blue genes are in the Interferome database. (C) Unsupervised hierarchical clustering of the top 200 differentially expressed genes between early and late generation lines. (D) Gene Ontology Biological Processes statistically associated with the LN-metastatic transcriptional signature. (E) GSEA of transcriptional profiles using the Hallmark Gene Set of MSigDB. NES, normalized enrichment score; FDR, false discovery rate. (F) Differentially expressed genes in tumor cells of HNSCC patients and the murine melanoma lines. N0: patients without LN metastases (n = 4); N+: patients with LN metastases (n = 10). Pie chart: number of shared genes present (dark blue) or absent (light blue) in the Interferome database. (G) Changes in chromatin accessibility between LN7 and parental lines. (H) Hierarchical clustering of chromatin accessibility between parental, LN3, and LN7 lines. (I) Chromatin accessibility at various ISG loci. Green shading: transcription start sites; blue shading: cis-regulatory regions. (J) ChromVAR analysis of transcription factor motif activity. See also Figure S2.
Figure 3 |
Figure 3 |. Exposure to exogenous IFNs is required for the acquisition, but not maintenance, of the LN metastasis-promoting ISG signature.
(A) Transcript levels of B2m and Cd274. (B) H-2Kb, H-2Db, and PD-L1 on parental (black), LN6 (red), IFNR knockout parental (blue), and IFNRKOLN1 (blue-green). Shaded histograms: cells stimulated with IFN-α and IFN-γ. (C) Number of mice exhibiting LN metastases following subcutaneous implantation of the parental vs. the IFNR knockout parental (left) and LN1 lines from the wild-type parental vs. LN1 lines from the IFNR knockout parental (IFNRKOLN1) (right). (D) Knockout versions of the parental and LN6-987AL lines were generated for Ifnar1, Ifngr1, Stat1, and a control sgRNA. An Ifnar1/Ifngr1 double-knockout line was also generated for the parental, implanted into mice, and new lines were generated from the resultant LN metastases (IFNRKOLN1). (E) Surface H-2Kb, H-2Db, and PD-L1 on parental and LN6 control and knockout lines with or without IFN-α or IFN-γ stimulation. (F-G) RNA-seq of the knockout lines. (F) Transcript levels of H2 genes and ISGs in the wild-type and knockout lines (TPM, Transcripts Per Kilobase Million). (G) Unsupervised hierarchical clustering of the variably expressed genes in the knockout lines. (H) LN metastases in mice implanted with LN6-987AL engineered with control or different Stat1 sgRNAs (sgStat1-1 and sgStat1-3). See also Figure S3.
Figure 4 |
Figure 4 |. Upregulation of MHC-I and PD-L1 promotes LN metastasis.
(A) Unsupervised clustering of differentially expressed genes in the parental and LN1 tumor lines. (B) Expression of H2 genes. (C) Specific lysis of parental, LN6, and LN7 lines co-cultured with NK cells. (D) LN metastases in wild-type mice depleted of NK cells and implanted with B16-F0-Cd274. (E, F) Spontaneous LN metastasis of LN6-987AL-sgB2m following implantation subcutaneously (E) or directly into LNs (F). (G) LN metastasis of B2m knockout tumors in NK cell-depleted mice. (H) PD-L1, H-2Db, and H-2Kb on parental, LN1, and LN6 cells. (I) PD-L1 and H-2Kb on the parental, three LN6, and the lung metastatic B16-F10 lines. (J) PD-L1 and MHC-I on the parental and LN1 lines generated in wild-type (red), Rag2−/− (green), and Rag2−/−;Il2rg−/− (blue) mice. (K) LN metastasis of LN6-sgCd274 tumors. (L) LN metastasis of LN6-sgCd274 in T cell depleted mice. (M) LN metastases in mice implanted with B16-F0 transduced to express PD-L1. (N) PD-L1 and H-2Db expression by a KrasG12D;Trp53−/−; PDAC line and a corresponding LN metastasis line. (O) PD-L1 in a HNSCC primary MOC2 tumor and LN metastases. Scale bars: 50μm. (P) PD-L1 staining on primary tumors and LN metastases of human melanoma tissue microarrays. (Q) CD274, HLA, and B2M transcripts in human HNSCC tumor cells. N0 (n = 4); N+ (n = 10). Whiskers, min and max. (R) CD274 expression in the TCGA SKCM dataset of primary melanomas (n = 415), LN metastases (n = 224), and distant metastases (n = 68). Whiskers, 10th to 90th percentile. Adjusted p-values in (B) calculated by the Wald test by the DESeq2 package and P-values in (G) calculated by One-Way ANOVA with Tukey’s post hoc test. See also Figure S4.
Figure 5 |
Figure 5 |. LN colonization induces broad alterations in the local immune repertoire.
T : B cell ratios (A) and Treg percentages (B) in draining LNs of mice bearing parental or LN tumors. (C) UMAP visualization of scRNA-seq clusters in the LNs of mice bearing no tumors, parental tumors, or LN6 tumors. Relative fractions of distinct B cell clusters (D), CD4 T cell clusters (E), and CD8 T cell clusters (F). (G) Unsupervised hierarchical clustering of differentially expressed genes across B cell clusters. (H) Expression levels of ISGs across B cell clusters and (I-K, M) of various genes for different cell clusters in mice without tumors, parental tumors, and LN6 tumors. (L) Activated (top) and PD-1+ (bottom) CD8 T cells in the LNs by flow cytometry in mice with no tumors (naïve), primary tumors only (LN−), or primary tumors and LN metastases (LN+). (N) Myeloid populations and PD-L1 levels in the LNs of naïve, LN−, and LN+ mice. (O) Immune populations in LNs of BrafV600E mice. cDC PD-L1 p-values in (N) calculated by Two-Way ANOVA. See also Figure S5.
Figure 6 |
Figure 6 |. LN metastases suppress T cell responses and induce Tregs.
(A) Spontaneous lung metastases in wild-type and Rag2−/−,Il2rg−/− mice of the parental, LN6-987AL, or LN8-1205BL tumor lines. Scale bars: 2mm. (B) Parental or LN6 tumor cells were implanted into NSG mice, followed by tail vein injections of B16-F0-tdTomato. (C) Analogous experiments were performed in wild-type mice with tail vein injections of MC38. (D) Wild-type splenocytes were transferred into wild-type or LTαnull mice. LN6 tumor cells were implanted into their flanks and B16-F0-tdTomato cells were subsequently injected intravenously. (E) Parental tumors were implanted subcutaneously and LN6-987AL injections (LN+) or sham injections (LN−) were performed on the draining LNs. LN leukocytes were transferred to tumor-naïve recipients that were subsequently challenged intravenously with B16-F0-tdTomato. (F) B16-F0-Ova and LN8-Ova cells labeled with distinct fluorescent dyes were mixed at a 1:1 ratio. OT-I CD8 T cells were added to the cultures at various effector to target (E:T) ratios, and tumor cells viability was evaluated. (G) OT-I mice were implanted with B16-F0-Ova or LN8-Ova cells. Kaplan-Meier plot depicts the time mice remain tumor-free following implantation. (H) Locations of mutations and neoantigens across the genome for the parental (blue), LN5 (green), and LN9 (red) lines. Outer three tracks: mutation counts. Inner three tracks: top candidate neoantigens (score of 10 or higher) determined using MuPeXI (Bjerregaard et al., 2017). (I) Total mutation counts. (J) Total neoantigen counts. (K) Treg percentages in draining LNs of MMTV-PyMT breast cancer mice with or without LN metastases. (L) Treg induction following culture of naïve CD4 T cells with the parental, LN6, or LN8 lines. (M) TGF-β in the serum of tumor-bearing mice. (N) Analogous experiments to (B) were performed in wild-type mice where mice bearing LN6-987AL tumors were also treated with TGF-β neutralizing antibodies (or isotype control). (O) FOXP3 staining in LNs of HNSCC patients with (N+) or without (N0) LN metastases. Scale bars: 50μm. (P) Foxp3DTR mice were implanted with parental or LN6 tumor lines and depleted of Tregs with diphtheria toxin (DT) and LN metastases were evaluated. P-value in (G) calculated by Log-rank (Mantel-Cox) test, (M) by unpaired two-tailed t-test, and (F, P) by One-Way ANOVA with Tukey’s post hoc test. See also Figure S6.
Figure 7 |
Figure 7 |. LN metastases induce antigen-specific Tregs that promote distant metastasis.
(A) Foxp3DTR mice implanted with LN6 tumors and depleted of Tregs were subsequently injected with B16-F0-tdTomato cells intravenously, and lung metastases were quantified. (B) Foxp3EGFP mice implanted with parental tumors subcutaneously were subsequently injected with intra-LN LN6 or sham control. Equivalent numbers of FoxP3+ Tregs harvested from LNs were transferred to recipient mice implanted subcutaneously with parental tumor lines and challenged with B16-F0-tdTomato. (C) Mice were implanted with B16-F0-Ova tumors subcutaneously and LN8-1205BL-Ova tumors (or sham) intra-LN. Ova specific Tregs in LNs were quantified by MHC-II-Ova-tetramer staining. (D) OT-II transgenic TCR mice were implanted subcutaneously with parental or LN6 tumors and challenged with B16-F0-tdTomato cells. (E) CD45.1 congenic wild-type mice were implanted with B16-F0-Ova or LN8-1205BL-Ova tumors subcutaneously. Naïve T cells from CD45.2 reporter or CD45.2 OT-II mice were transferred to the tumor-bearing recipients following mixing at a 1:1 ratio. After 3 weeks, LNs were harvested and reporter and OT-II CD45.2+ Tregs were quantified. (F) Proposed model of LN metastasis and resultant immunosuppression. P-values in (E) calculated by Two-Way ANOVA with Sidak’s post hoc test.

Comment in

References

    1. Ahmadzadeh M, Pasetto A, Jia L, Deniger DC, Stevanović S, Robbins PF, and Rosenberg SA (2019). Tumor-infiltrating human CD4+ regulatory T cells display a distinct TCR repertoire and exhibit tumor and neoantigen reactivity. Science Immunology 4, eaao4310. - PMC - PubMed
    1. Ai HW, Olenych SG, Wong P, Davidson MW, and Campbell RE (2008). Hue-shifted monomeric variants of Clavularia cyan fluorescent protein: identification of the molecular determinants of color and applications in fluorescence imaging. BMC biology 6, 13. - PMC - PubMed
    1. Ashburner M, Ball CA, Blake JA, Botstein D, Butler H, Cherry JM, Davis AP, Dolinski K, Dwight SS, Eppig JT, et al. (2000). Gene ontology: tool for the unification of biology. The Gene Ontology Consortium. Nat Genet 25, 25–29. - PMC - PubMed
    1. Bakhoum SF, Ngo B, Laughney AM, Cavallo JA, Murphy CJ, Ly P, Shah P, Sriram RK, Watkins TBK, Taunk NK, et al. (2018). Chromosomal instability drives metastasis through a cytosolic DNA response. Nature 553, 467–472. - PMC - PubMed
    1. Bankhead P, Loughrey MB, Fernandez JA, Dombrowski Y, McArt DG, Dunne PD, McQuaid S, Gray RT, Murray LJ, Coleman HG, et al. (2017). QuPath: Open source software for digital pathology image analysis. Sci Rep 7, 16878. - PMC - PubMed

Publication types