

Engineering a 3D hydrogel system to study optic nerve head astrocyte morphology and behavior
- PMID: 35525298
- PMCID: PMC9233048
- DOI: 10.1016/j.exer.2022.109102
Engineering a 3D hydrogel system to study optic nerve head astrocyte morphology and behavior
Abstract
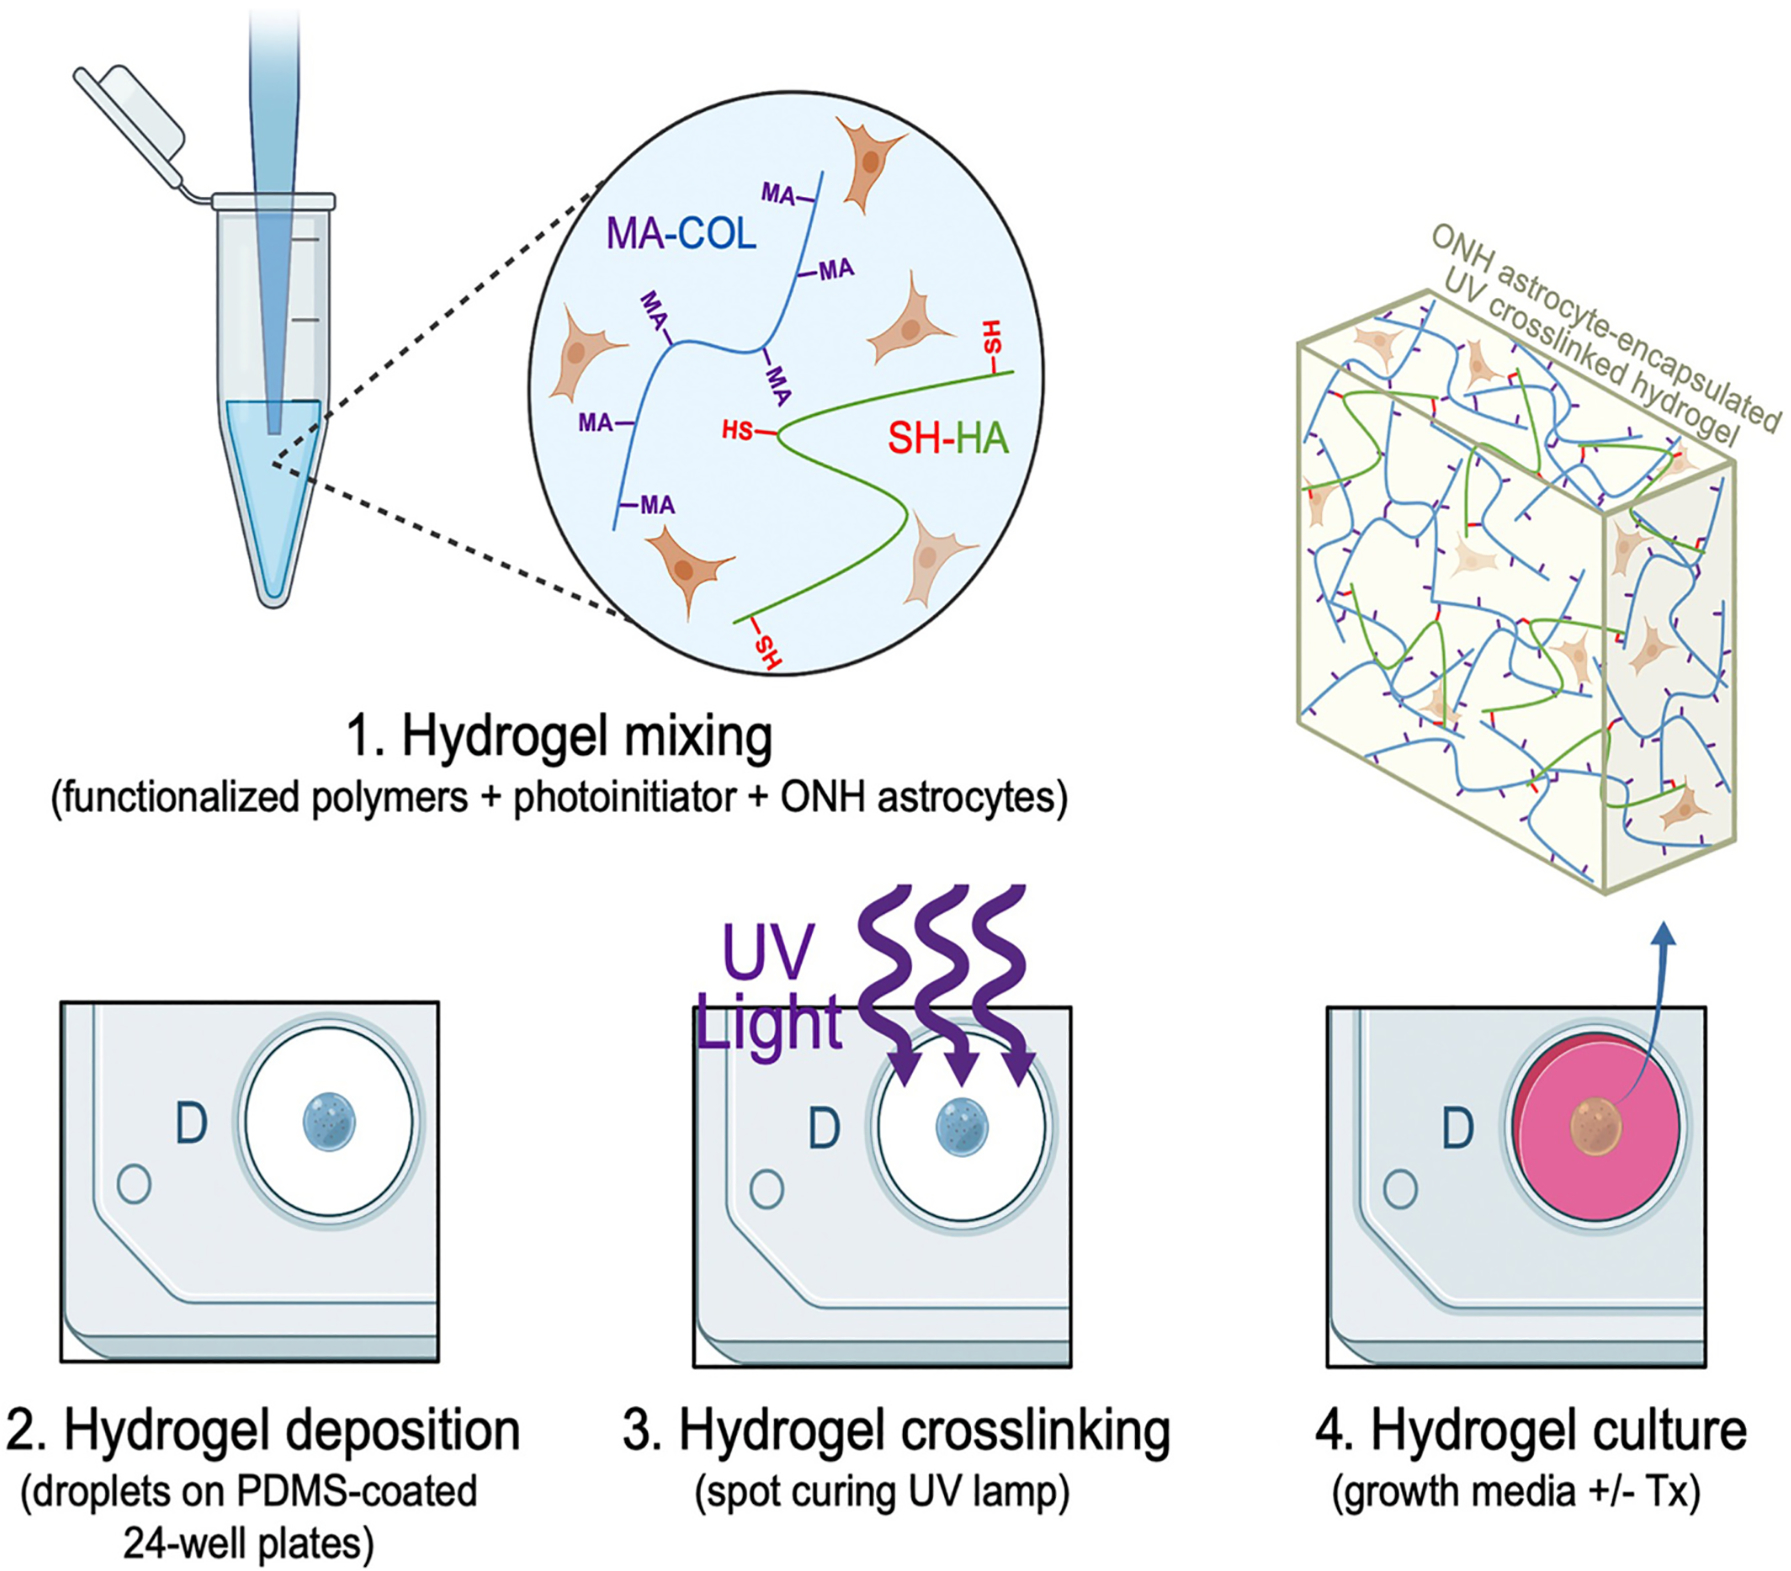
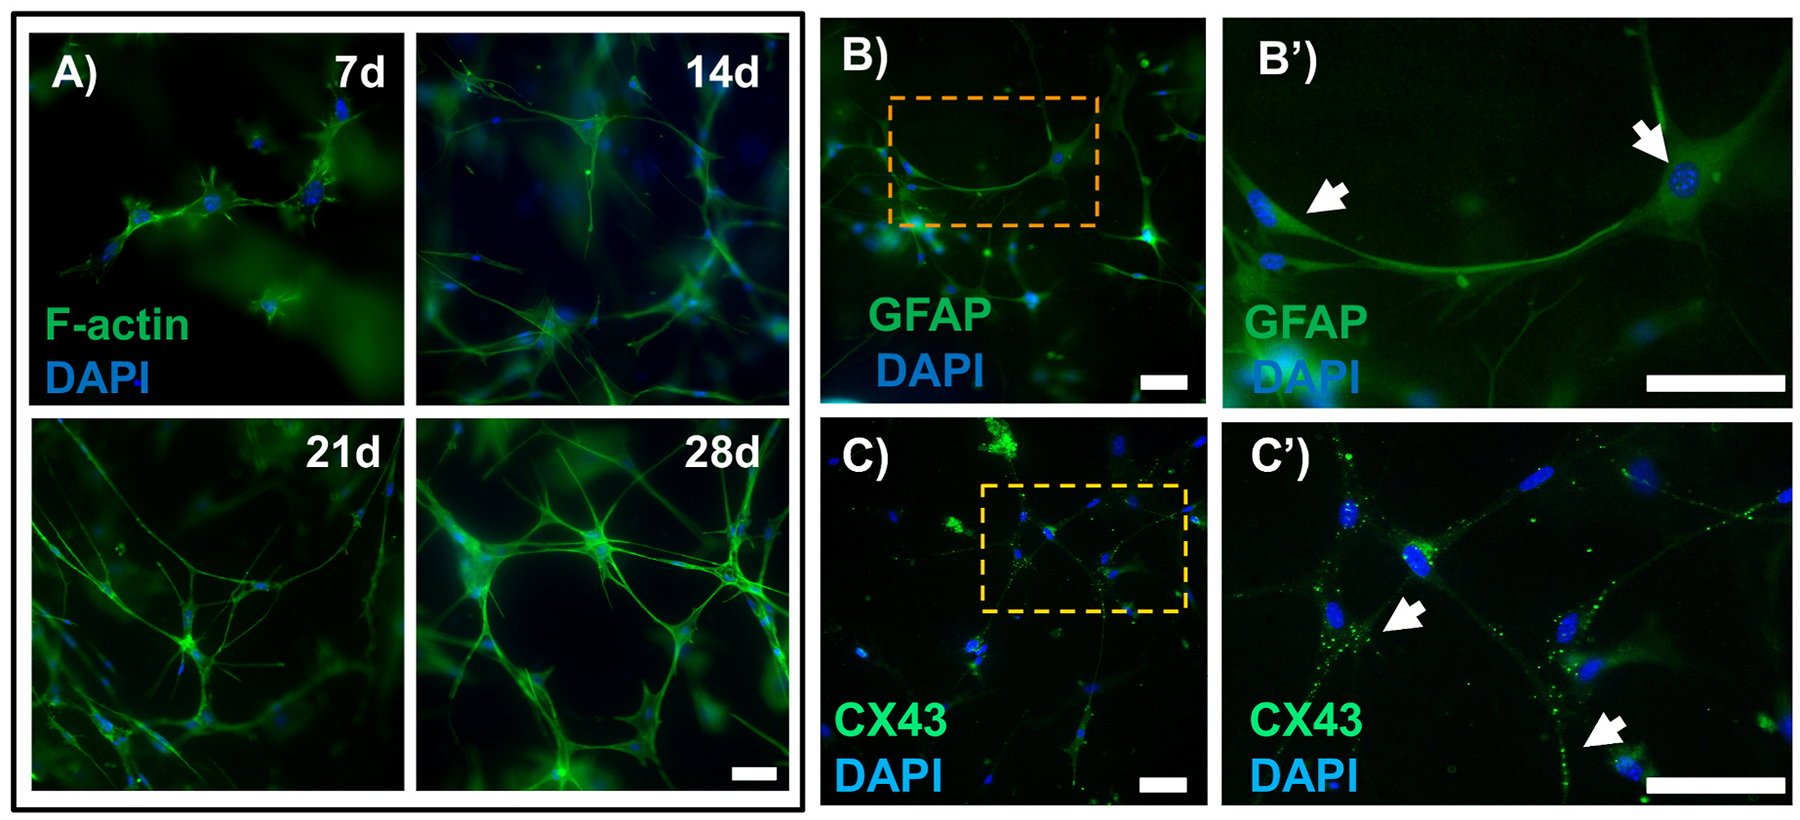
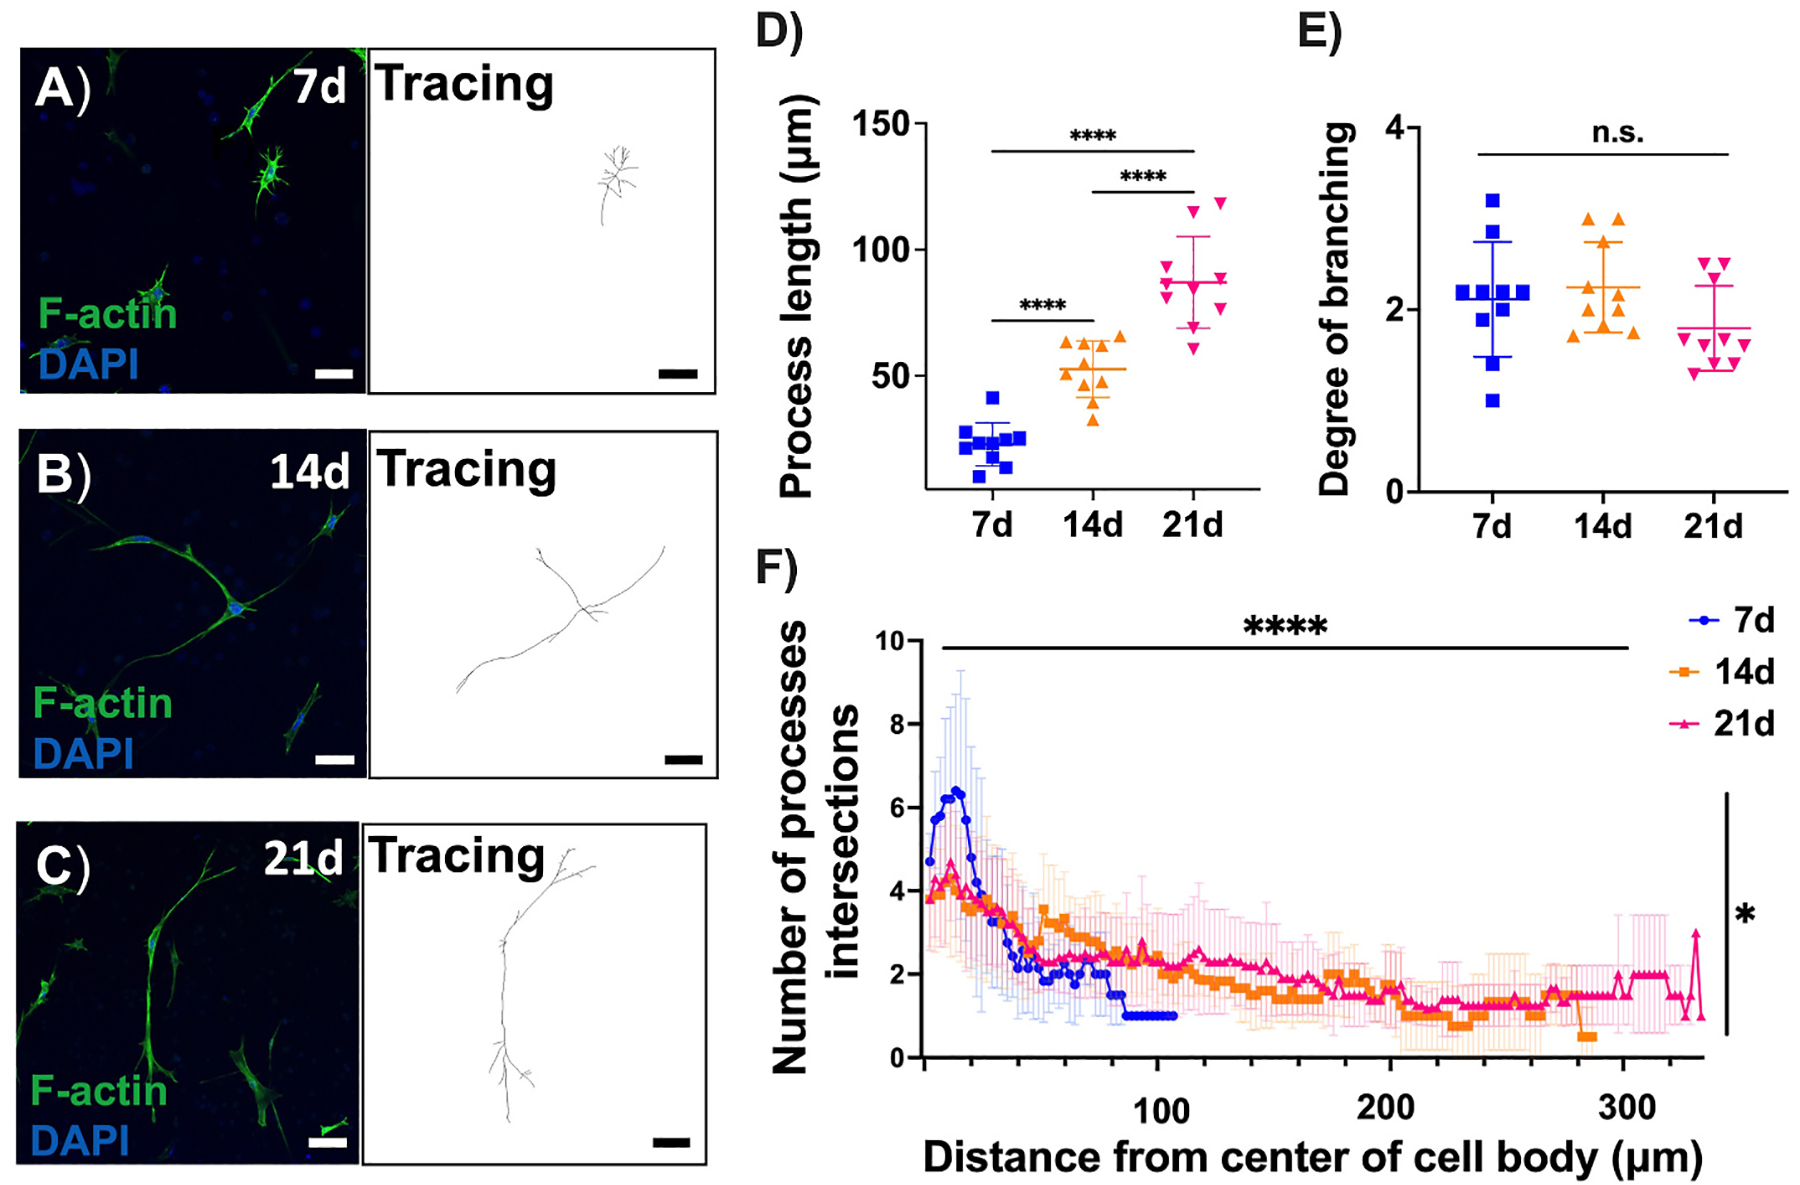
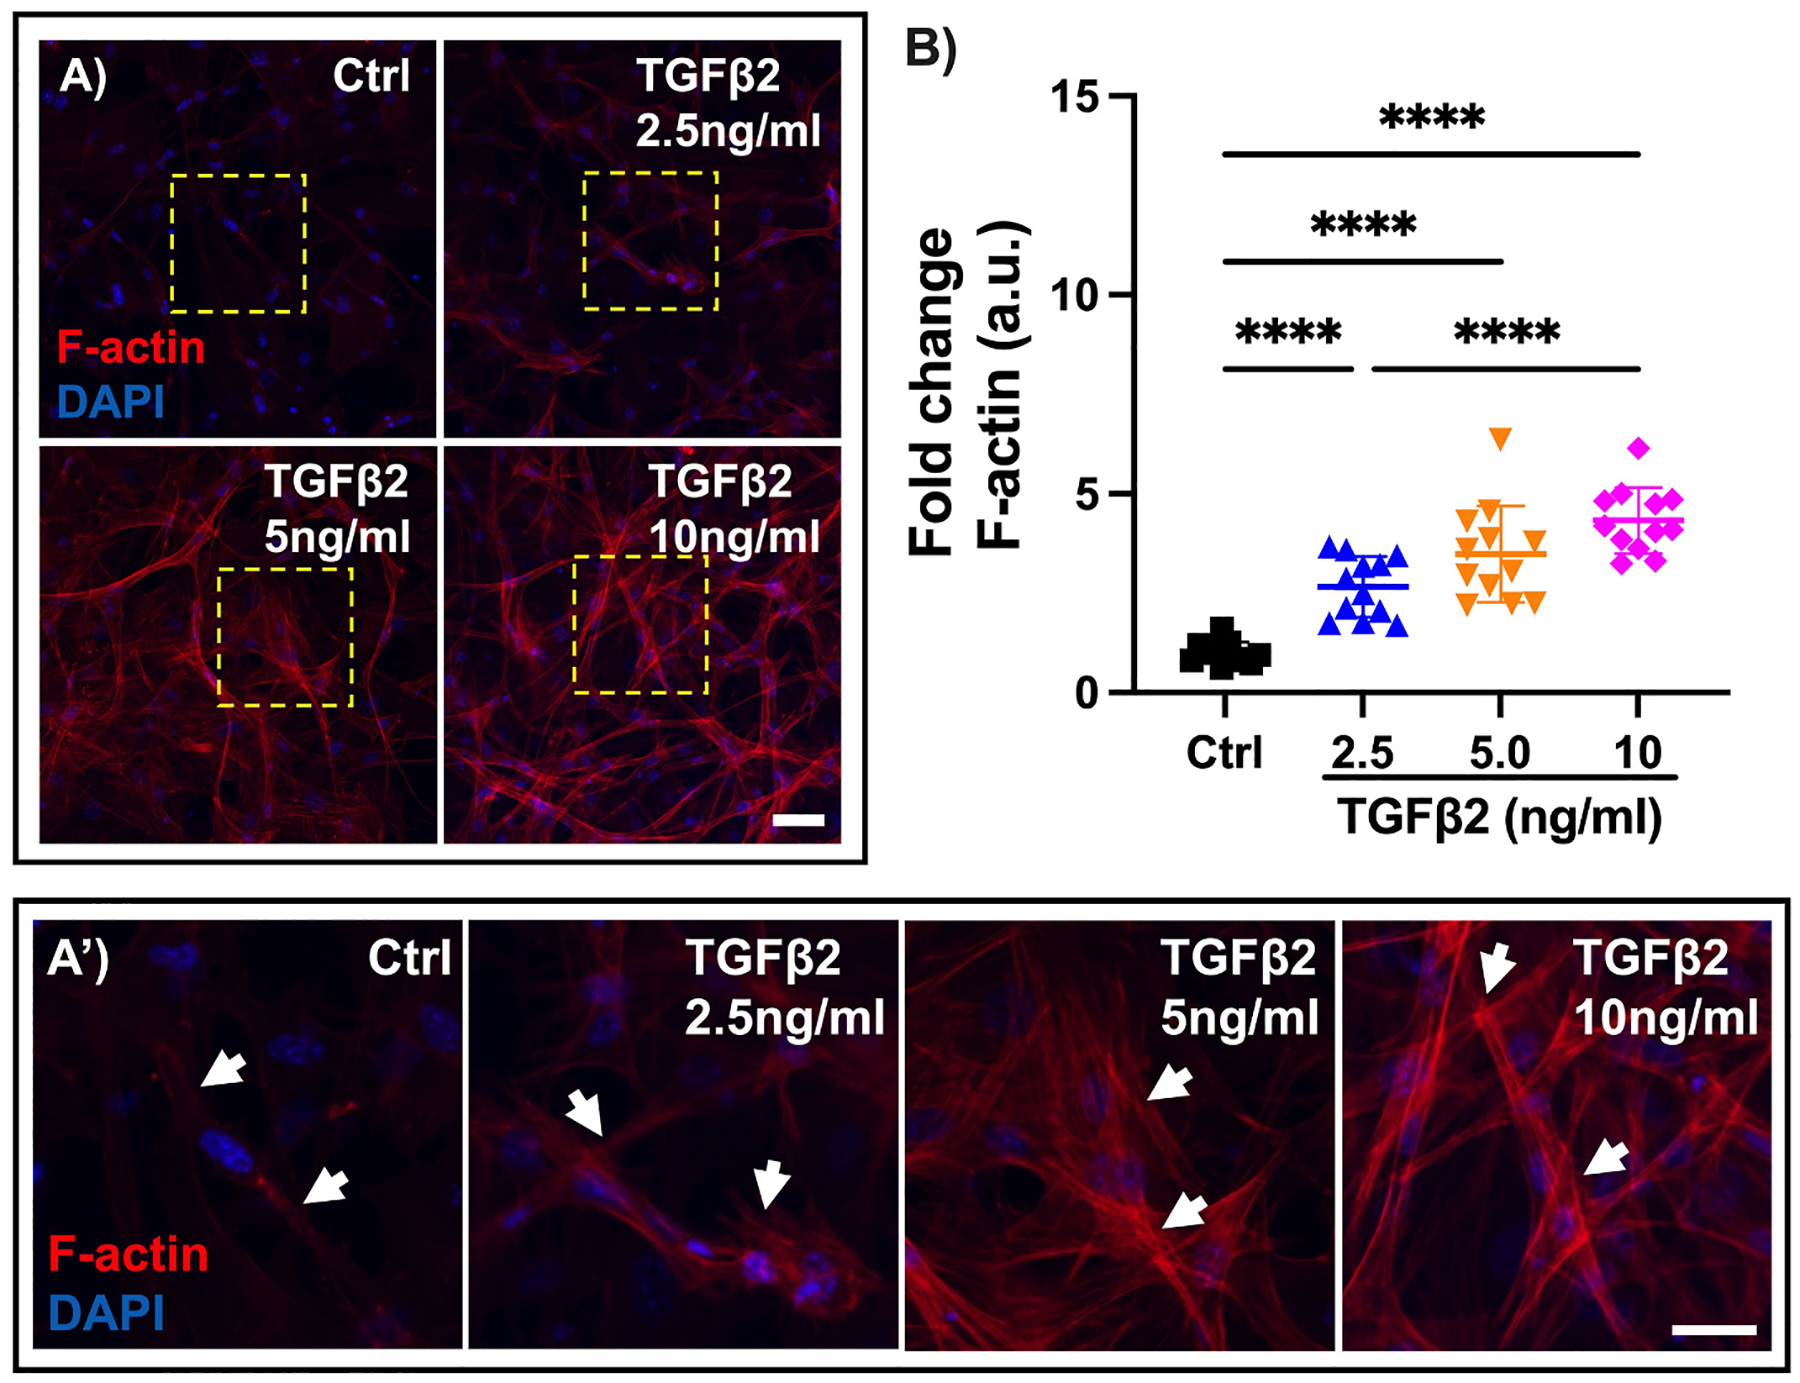
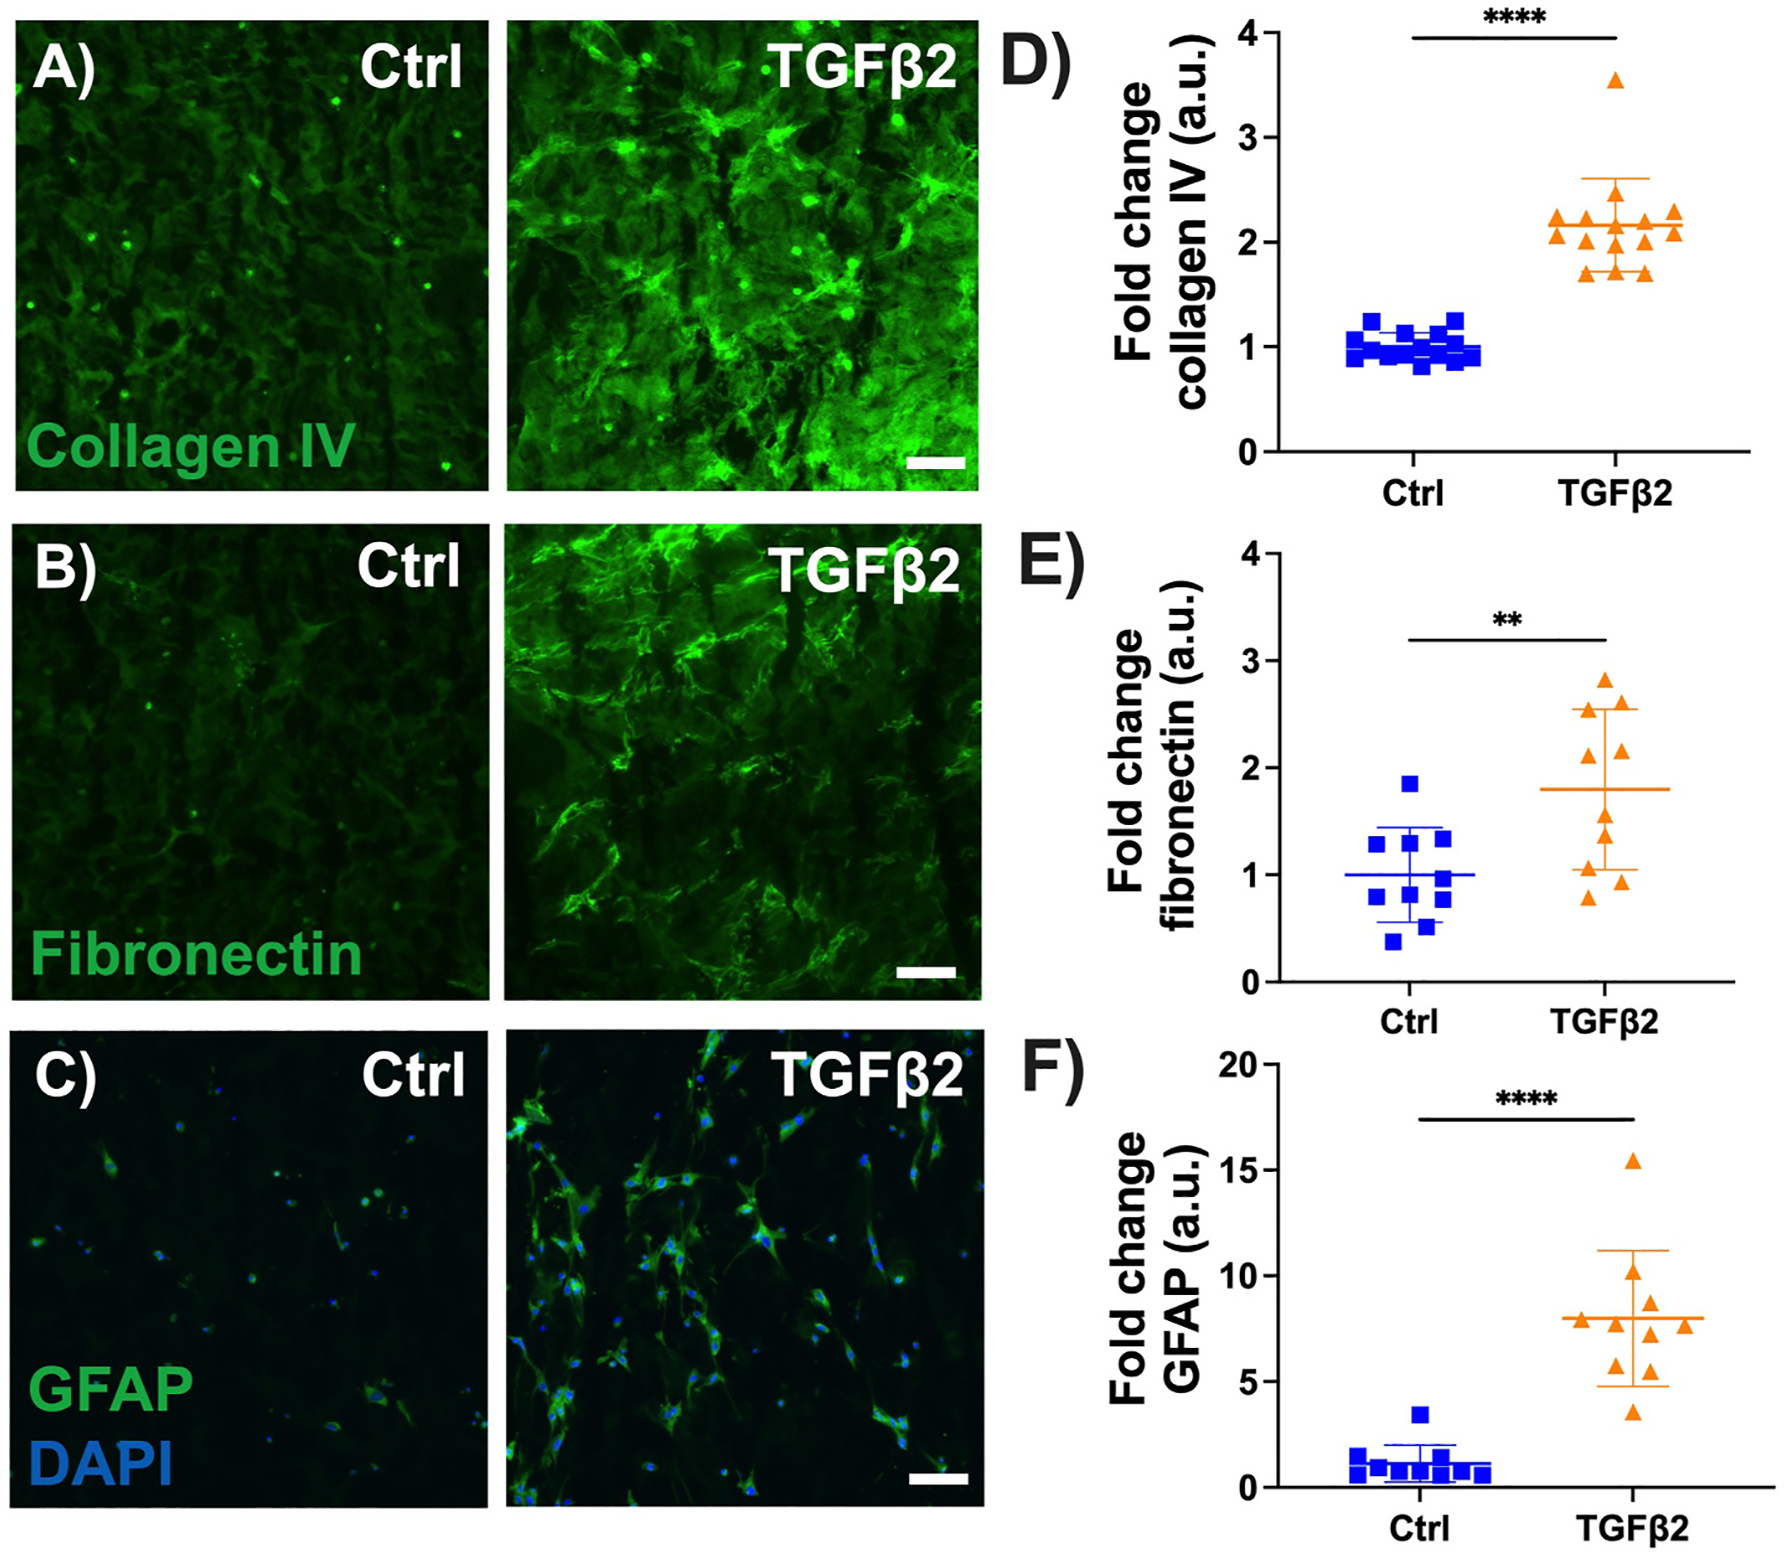
In glaucoma, astrocytes within the optic nerve head (ONH) rearrange their actin cytoskeleton, while becoming reactive and upregulating intermediate filament glial fibrillary acidic protein (GFAP). Increased transforming growth factor beta 2 (TGF β2) levels have been implicated in glaucomatous ONH dysfunction. A key limitation of using conventional 2D culture to study ONH astrocyte behavior is the inability to faithfully replicate the in vivo ONH microenvironment. Here, we engineer a 3D ONH astrocyte hydrogel to better mimic in vivo mouse ONH astrocyte (MONHA) morphology, and test induction of MONHA reactivity using TGF β2. Primary MONHAs were isolated from C57BL/6J mice and cell purity confirmed. To engineer 3D cell-laden hydrogels, MONHAs were mixed with photoactive extracellular matrix components (collagen type I, hyaluronic acid) and crosslinked for 5 minutes using a photoinitiator (0.025% riboflavin) and UV light (405-500 nm, 10.3 mW/cm2). MONHA-encapsulated hydrogels were cultured for 3 weeks, and then treated with TGF β2 (2.5, 5.0 or 10 ng/ml) for 7 days to assess for reactivity. Following encapsulation, MONHAs retained high cell viability in hydrogels and continued to proliferate over 4 weeks as determined by live/dead staining and MTS assays. Sholl analysis demonstrated that MONHAs within hydrogels developed increasing process complexity with increasing process length over time. Cell processes connected with neighboring cells, coinciding with Connexin43 expression within astrocytic processes. Treatment with TGF β2 induced reactivity in MONHA-encapsulated hydrogels as determined by altered F-actin cytoskeletal morphology, increased GFAP expression, and elevated fibronectin and collagen IV deposition. Our data sets the stage for future use of this 3D biomimetic ONH astrocyte-encapsulated hydrogel to investigate astrocyte behavior in response to injury.
Keywords: Biomechanical Strain; Collagen IV; Extracellular matrix; Fibronectin; GFAP; Glaucoma; Reactive gliosis; Transforming growth factor beta 2.
Copyright © 2022 Elsevier Ltd. All rights reserved.
Conflict of interest statement
Declaration of competing interest
The authors report no conflicts of interest.
Figures

Similar articles
-
Harnessing cell-encapsulated hydrogels to study astrocyte mechanoresponse in 4D.bioRxiv [Preprint]. 2025 Jun 25:2025.06.20.660800. doi: 10.1101/2025.06.20.660800. bioRxiv. 2025. PMID: 40667151 Free PMC article. Preprint.
-
Mechanosensitive channel inhibition attenuates TGFβ2-induced actin cytoskeletal remodeling and reactivity in mouse optic nerve head astrocytes.Exp Eye Res. 2021 Nov;212:108791. doi: 10.1016/j.exer.2021.108791. Epub 2021 Oct 14. Exp Eye Res. 2021. PMID: 34656548 Free PMC article.
-
Bone morphogenetic protein 4 inhibits TGF-beta2 stimulation of extracellular matrix proteins in optic nerve head cells: role of gremlin in ECM modulation.Glia. 2009 May;57(7):755-66. doi: 10.1002/glia.20803. Glia. 2009. PMID: 19031438
-
The pathogenic role of transforming growth factor-β2 in glaucomatous damage to the optic nerve head.Exp Eye Res. 2011 Aug;93(2):165-9. doi: 10.1016/j.exer.2010.07.014. Epub 2010 Aug 12. Exp Eye Res. 2011. PMID: 20708611 Review.
-
The role of TGF-β in the pathogenesis of primary open-angle glaucoma.Cell Tissue Res. 2012 Jan;347(1):279-90. doi: 10.1007/s00441-011-1274-7. Epub 2011 Nov 19. Cell Tissue Res. 2012. PMID: 22101332 Review.
Cited by
-
Imaging actin organisation and dynamics in 3D.J Cell Sci. 2024 Jan 15;137(2):jcs261389. doi: 10.1242/jcs.261389. Epub 2024 Jan 18. J Cell Sci. 2024. PMID: 38236161 Free PMC article.
-
Activation of multiple Eph receptors on neuronal membranes correlates with the onset of optic neuropathy.Eye Vis (Lond). 2023 Oct 2;10(1):42. doi: 10.1186/s40662-023-00359-w. Eye Vis (Lond). 2023. PMID: 37779186 Free PMC article.
-
Activation of Multiple Eph Receptors on Neuronal Membranes Correlates with The Onset of Traumatic Optic Neuropathy.bioRxiv [Preprint]. 2023 Jun 7:2023.06.05.543735. doi: 10.1101/2023.06.05.543735. bioRxiv. 2023. Update in: Eye Vis (Lond). 2023 Oct 2;10(1):42. doi: 10.1186/s40662-023-00359-w. PMID: 37333178 Free PMC article. Updated. Preprint.
-
Harnessing cell-encapsulated hydrogels to study astrocyte mechanoresponse in 4D.bioRxiv [Preprint]. 2025 Jun 25:2025.06.20.660800. doi: 10.1101/2025.06.20.660800. bioRxiv. 2025. PMID: 40667151 Free PMC article. Preprint.
-
Minimal differences observed when comparing the morphological profiling of microglia obtained by confocal laser scanning and optical sectioning microscopy.Front Neuroanat. 2025 Jan 3;18:1507140. doi: 10.3389/fnana.2024.1507140. eCollection 2024. Front Neuroanat. 2025. PMID: 39829733 Free PMC article.
References
-
- Ahearne M, Coyle A, 2016. Application of UVA-riboflavin crosslinking to enhance the mechanical properties of extracellular matrix derived hydrogels. J. Mech. Behav. Biomed. Mater 54, 259–267. - PubMed
-
- Aleman J, Sivakumar H, DePalma T, Zhou Y, Mazzocchi A, Huntwork RC, Yoo KM, Banks S, Clark C, Maycock A, Leaks K, Enck K, Opara E, Gatenholm P, Welker M, Soker S, Herberg S, Criswell T, Skardal A, 2021. Engineering a Thixotropic and Biochemically Tunable Hyaluronan and Collagen Bioink for Biofabrication of Multiple Tissue Construct Types. bioRxiv, 458584, 2021.2009.2001.
-
- Boazak EM, d’Humieres J, Schildmeyer L, Kim G-A, Pareek P, Takayama S, Ethier CR, 2019. Towards optic nerve head on a chip: a tool for understanding glaucomatous optic neuropathy. Invest. Ophthalmol. Vis. Sci 60, 6171–6171.
Publication types
MeSH terms
Substances
Grants and funding
LinkOut - more resources
Full Text Sources
Medical
Miscellaneous
