. 2022 Jun:110:151-173.
doi: 10.1016/j.matbio.2022.05.001. Epub 2022 May 4.

Elevated TGFβ signaling contributes to ocular anterior segment dysgenesis in Col4a1 mutant mice

Affiliations

Elevated TGFβ signaling contributes to ocular anterior segment dysgenesis in Col4a1 mutant mice

Mao Mao et al. Matrix Biol. 2022 Jun.

Abstract

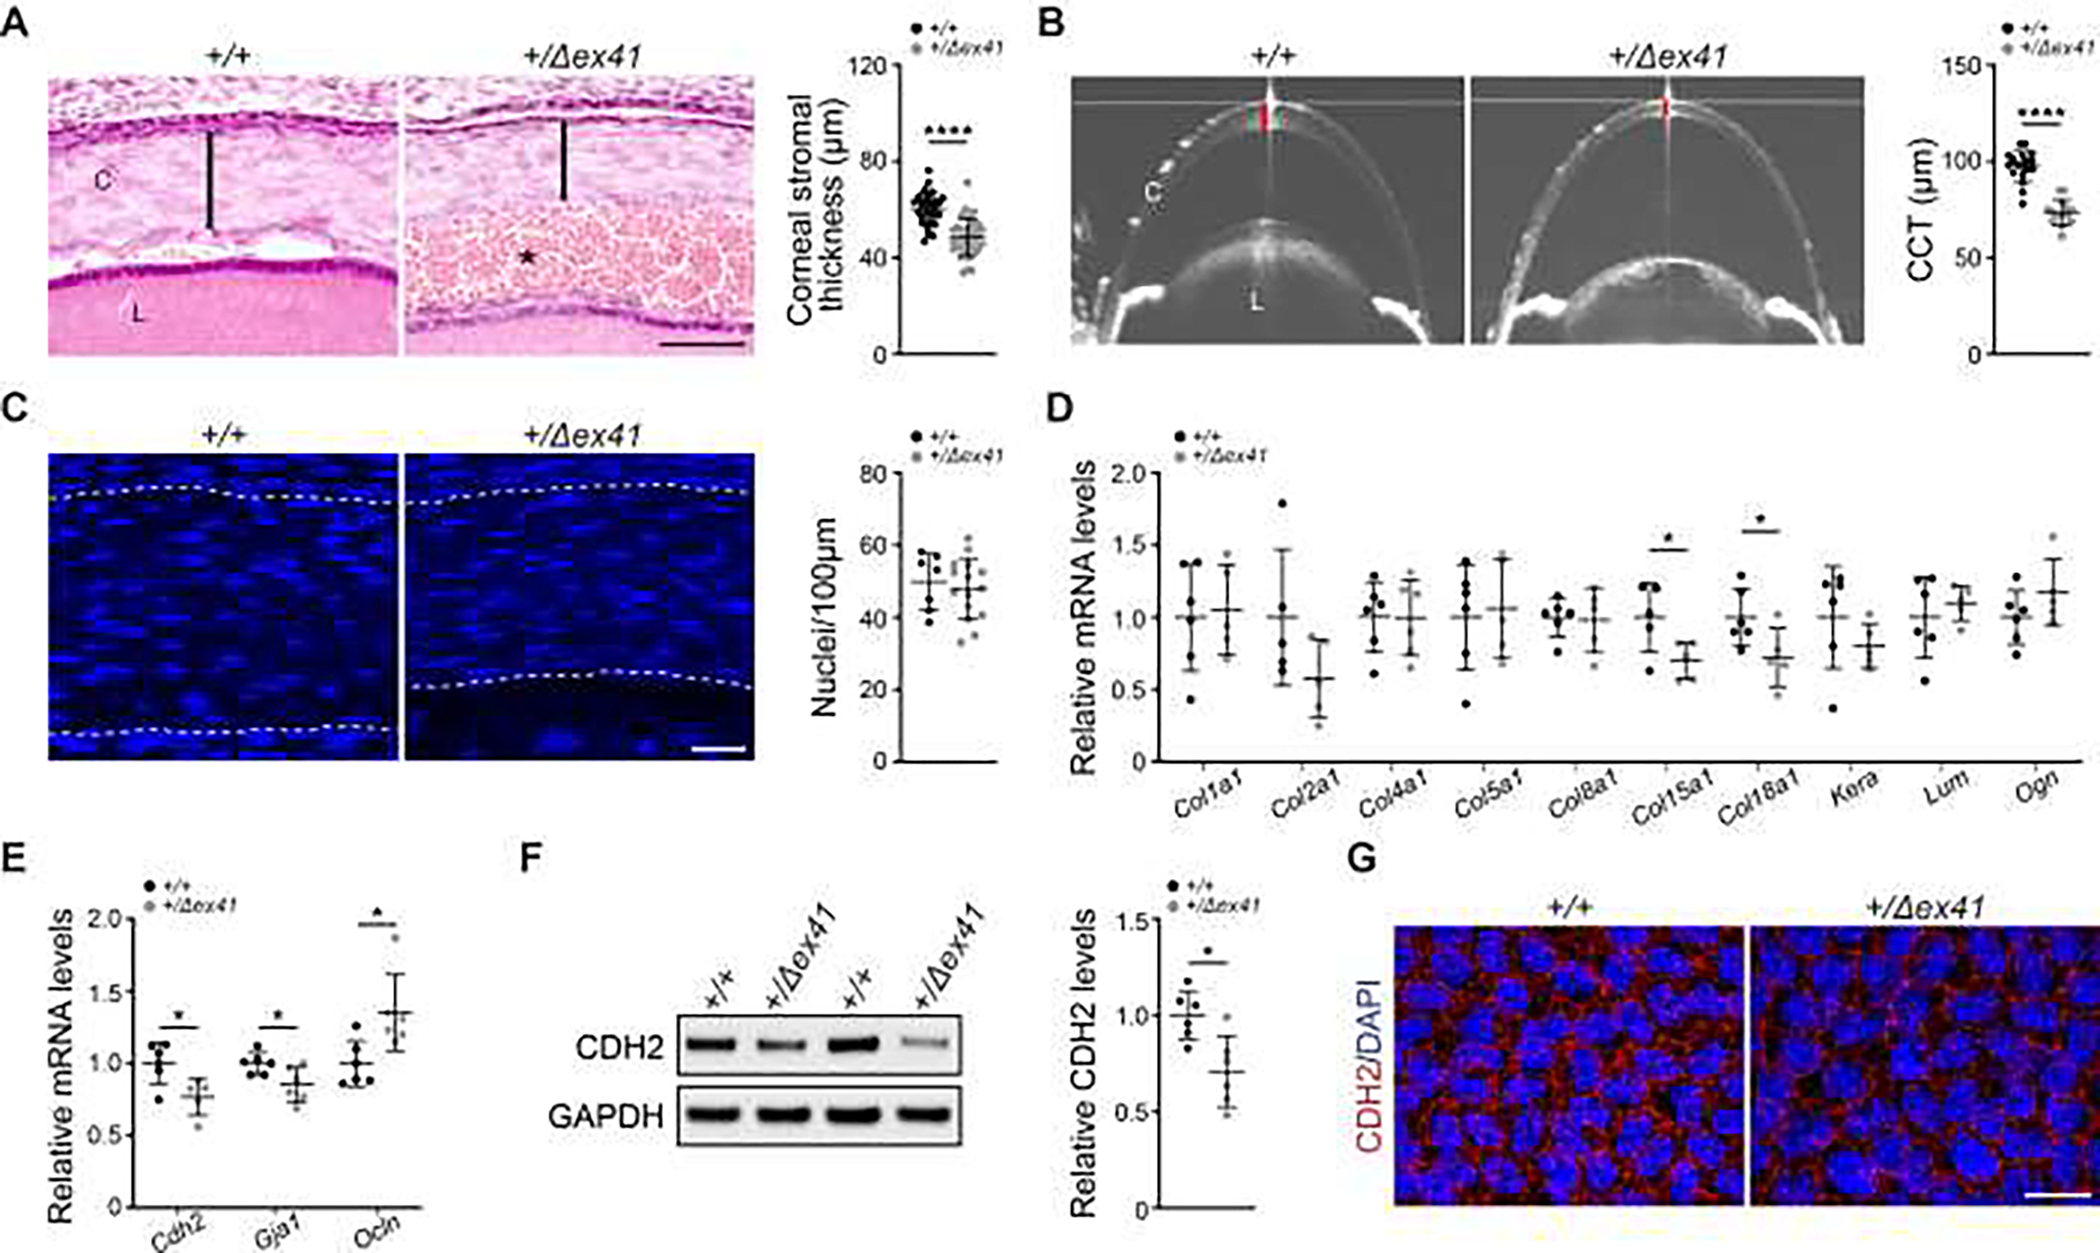
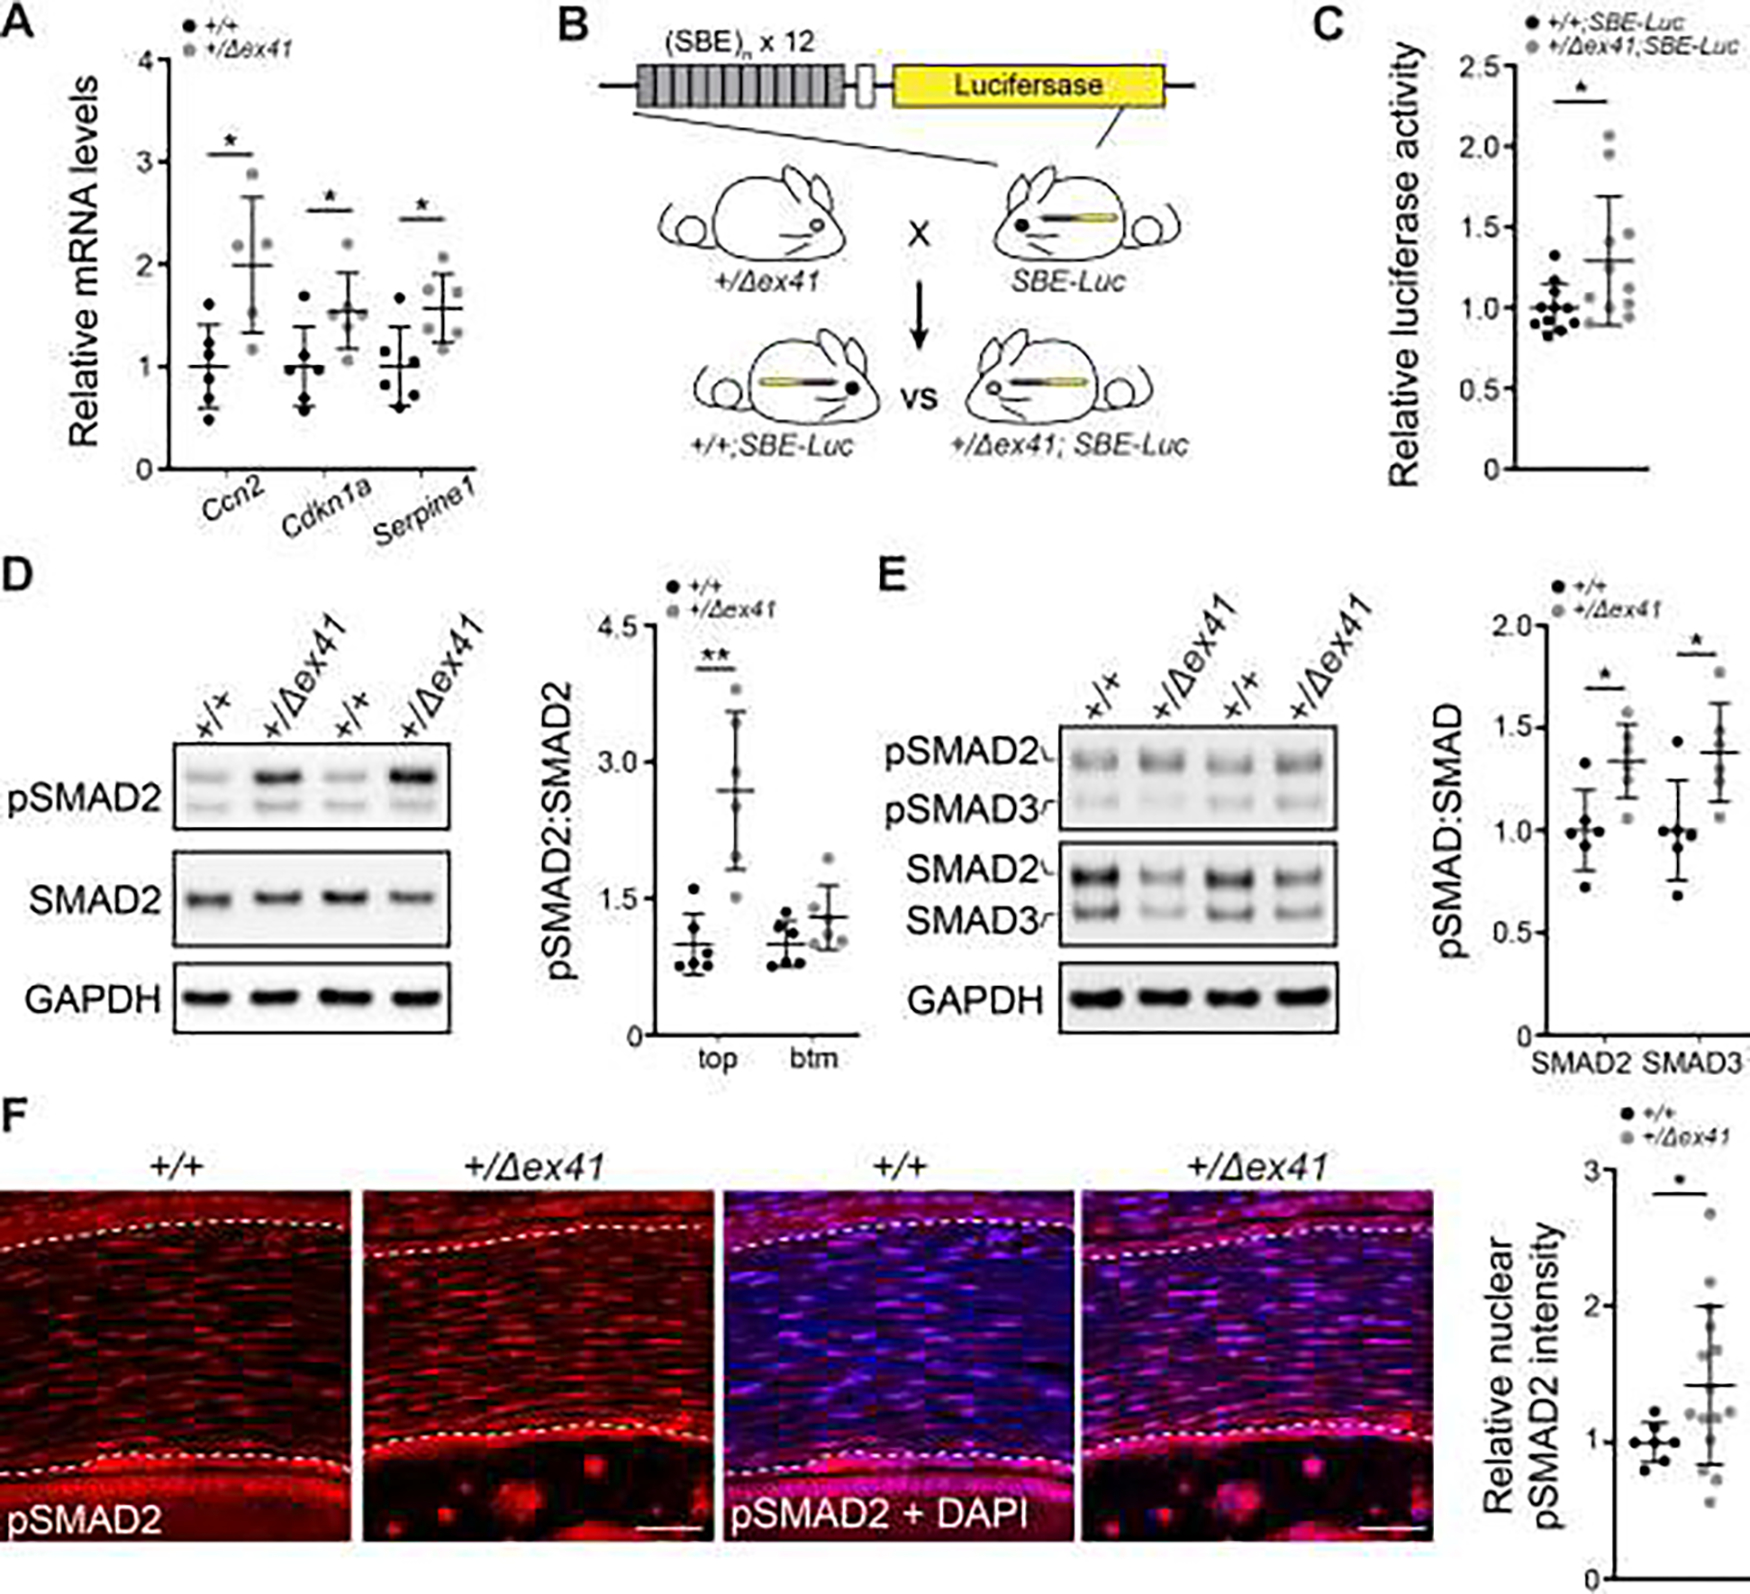
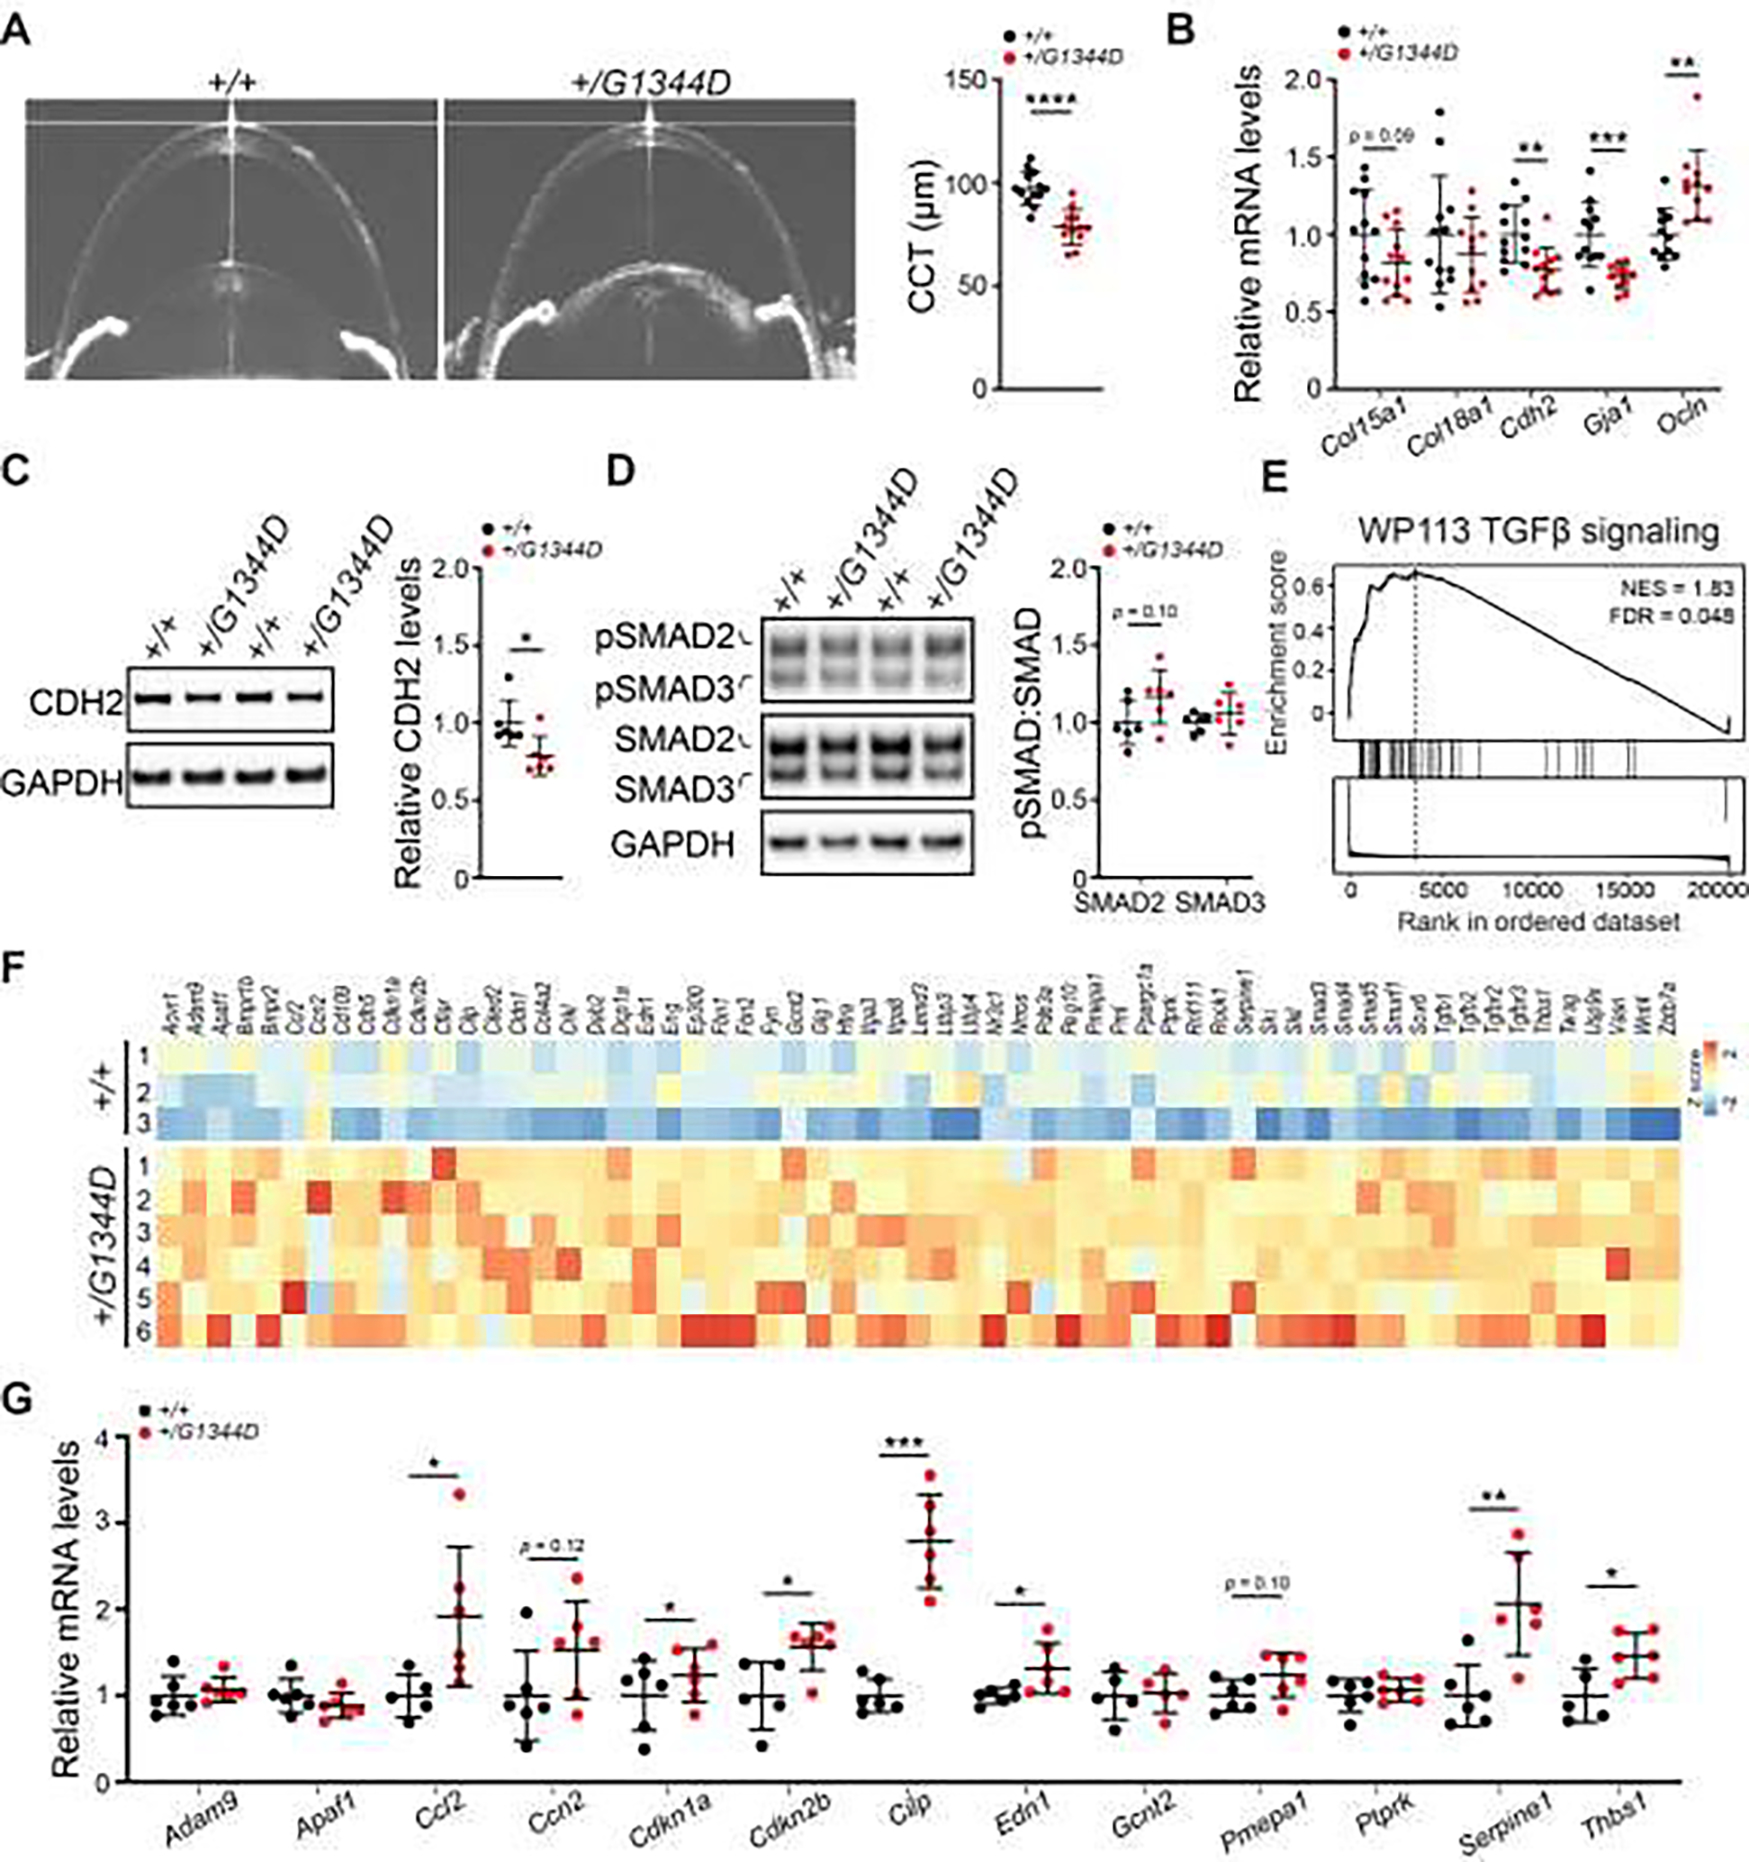
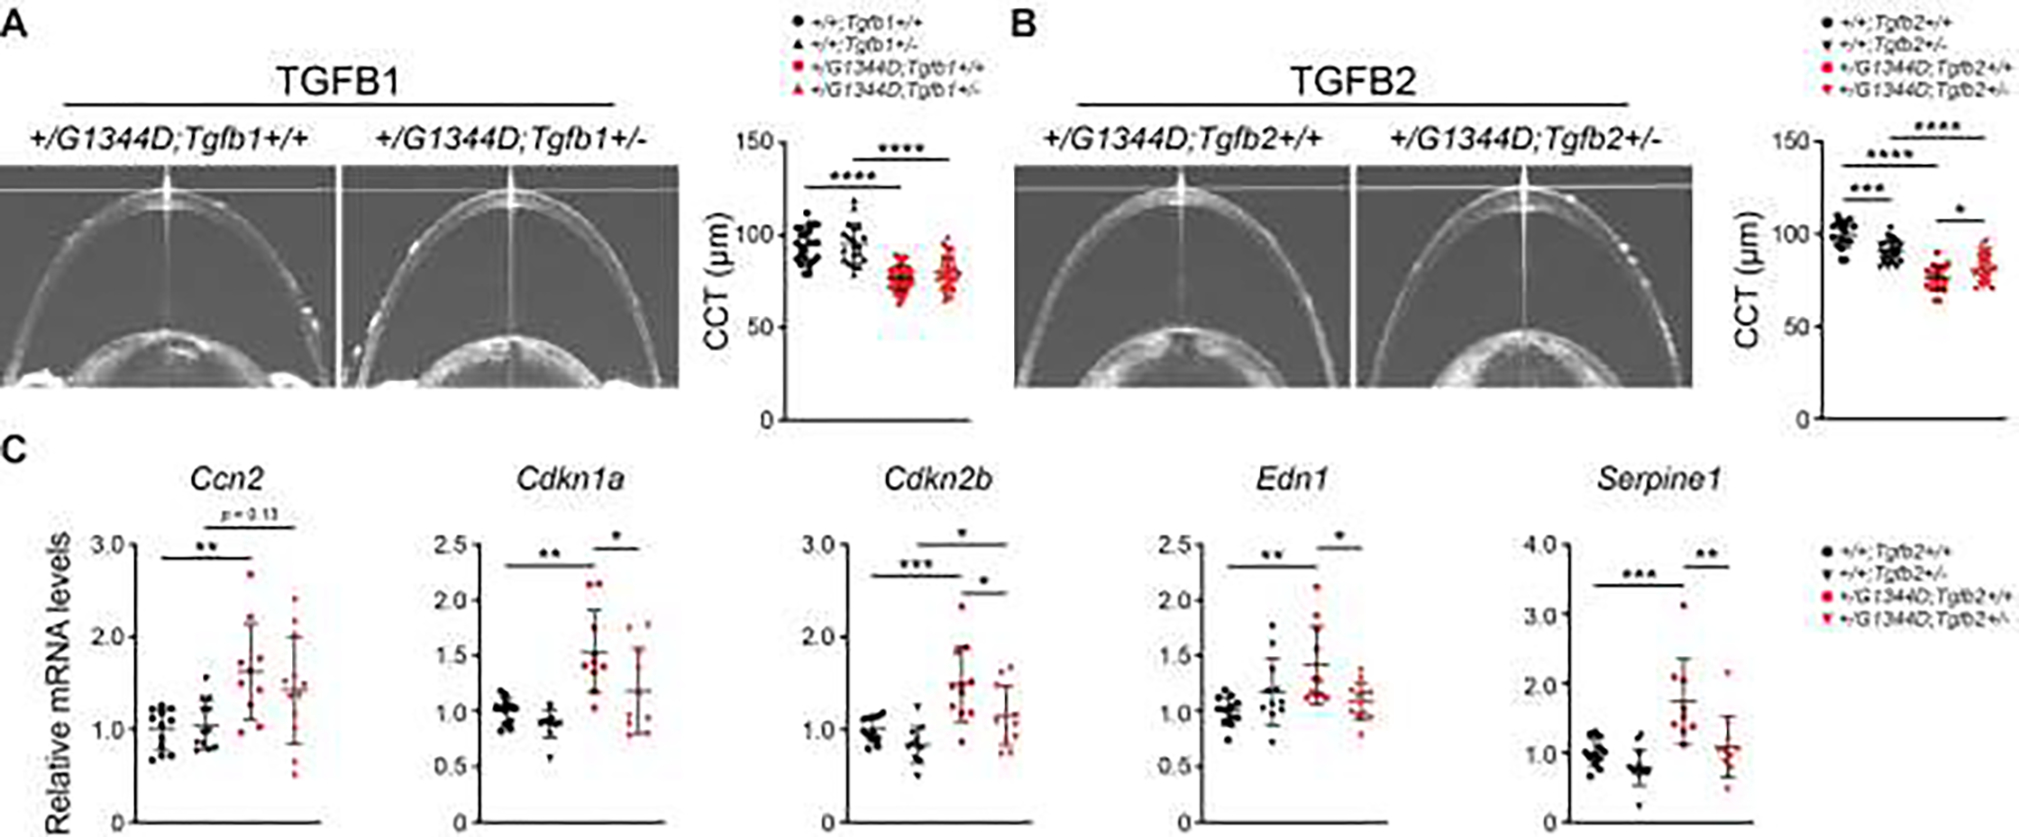
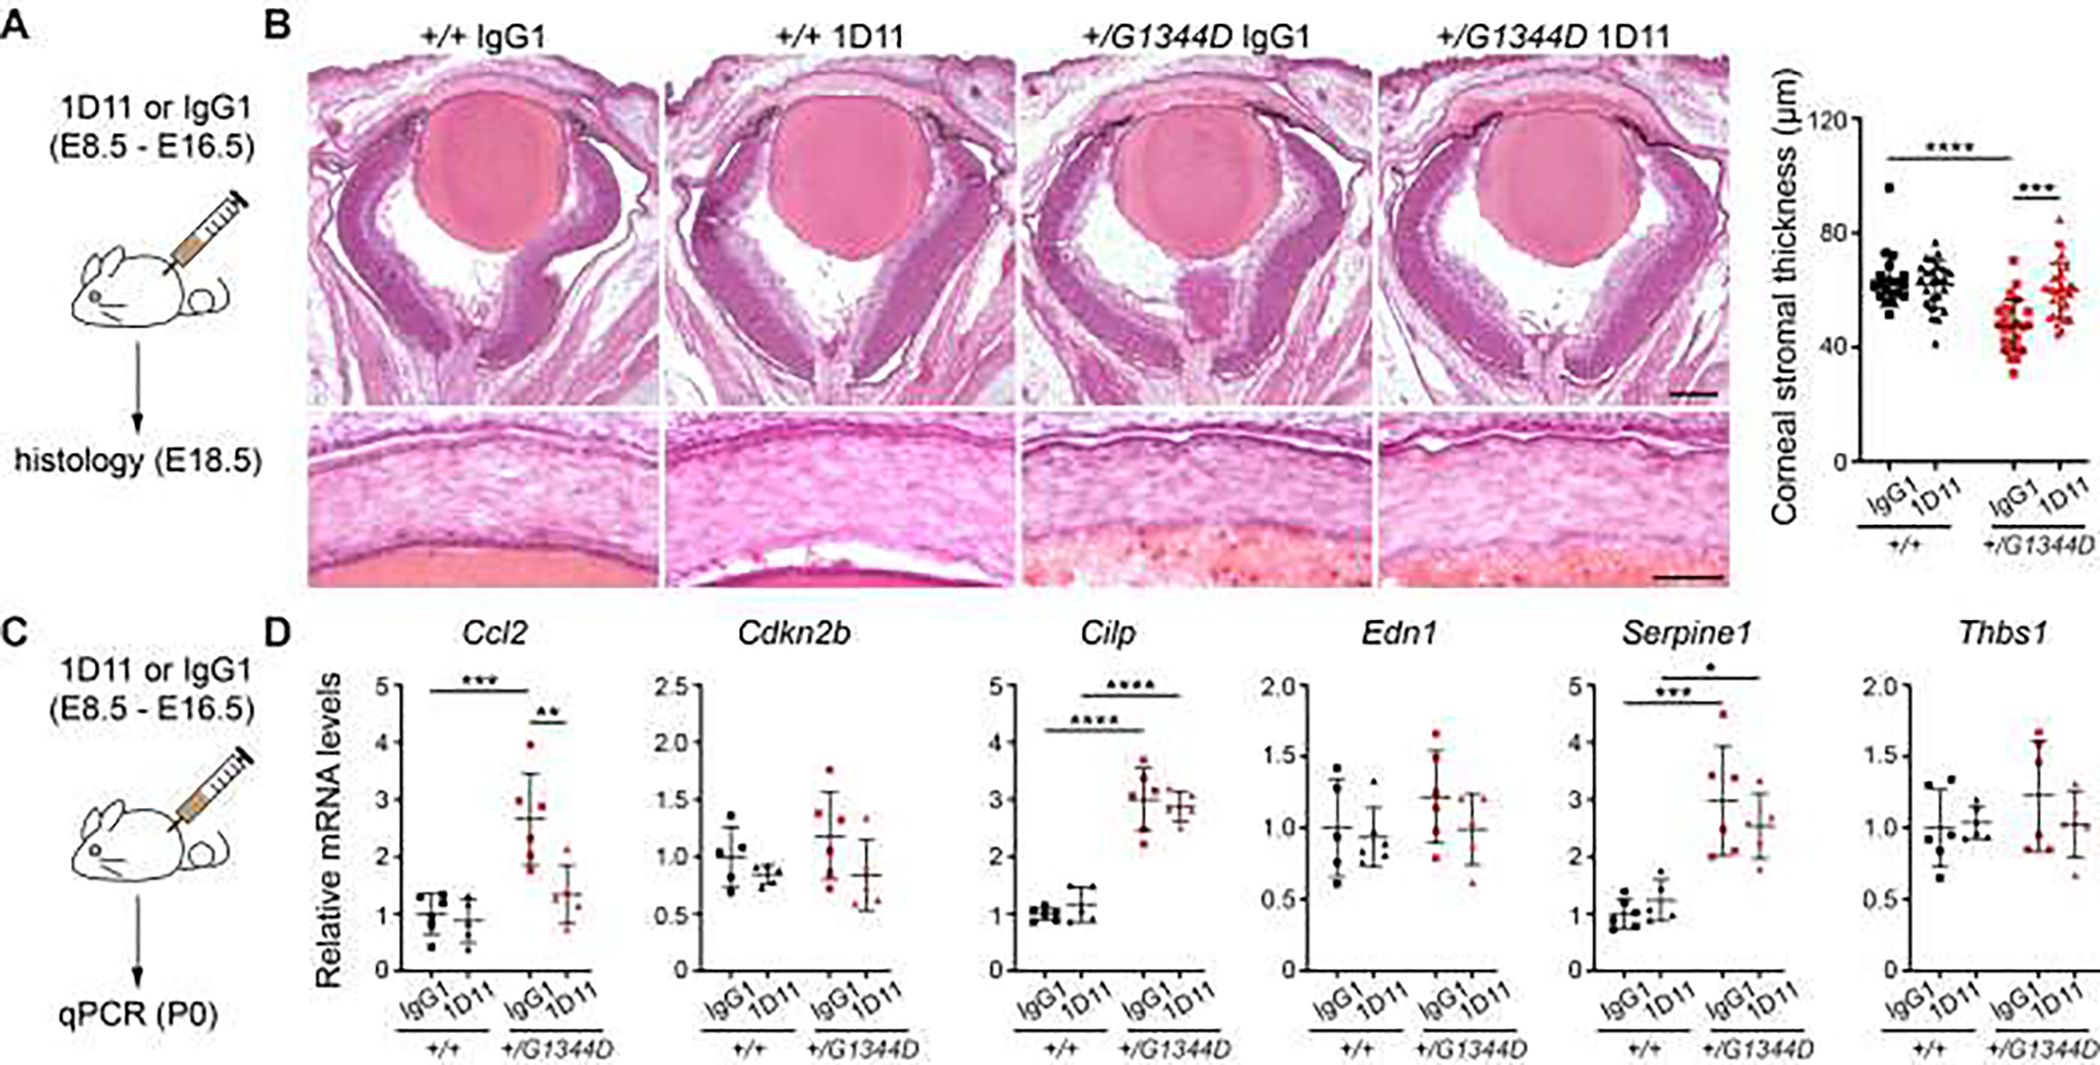
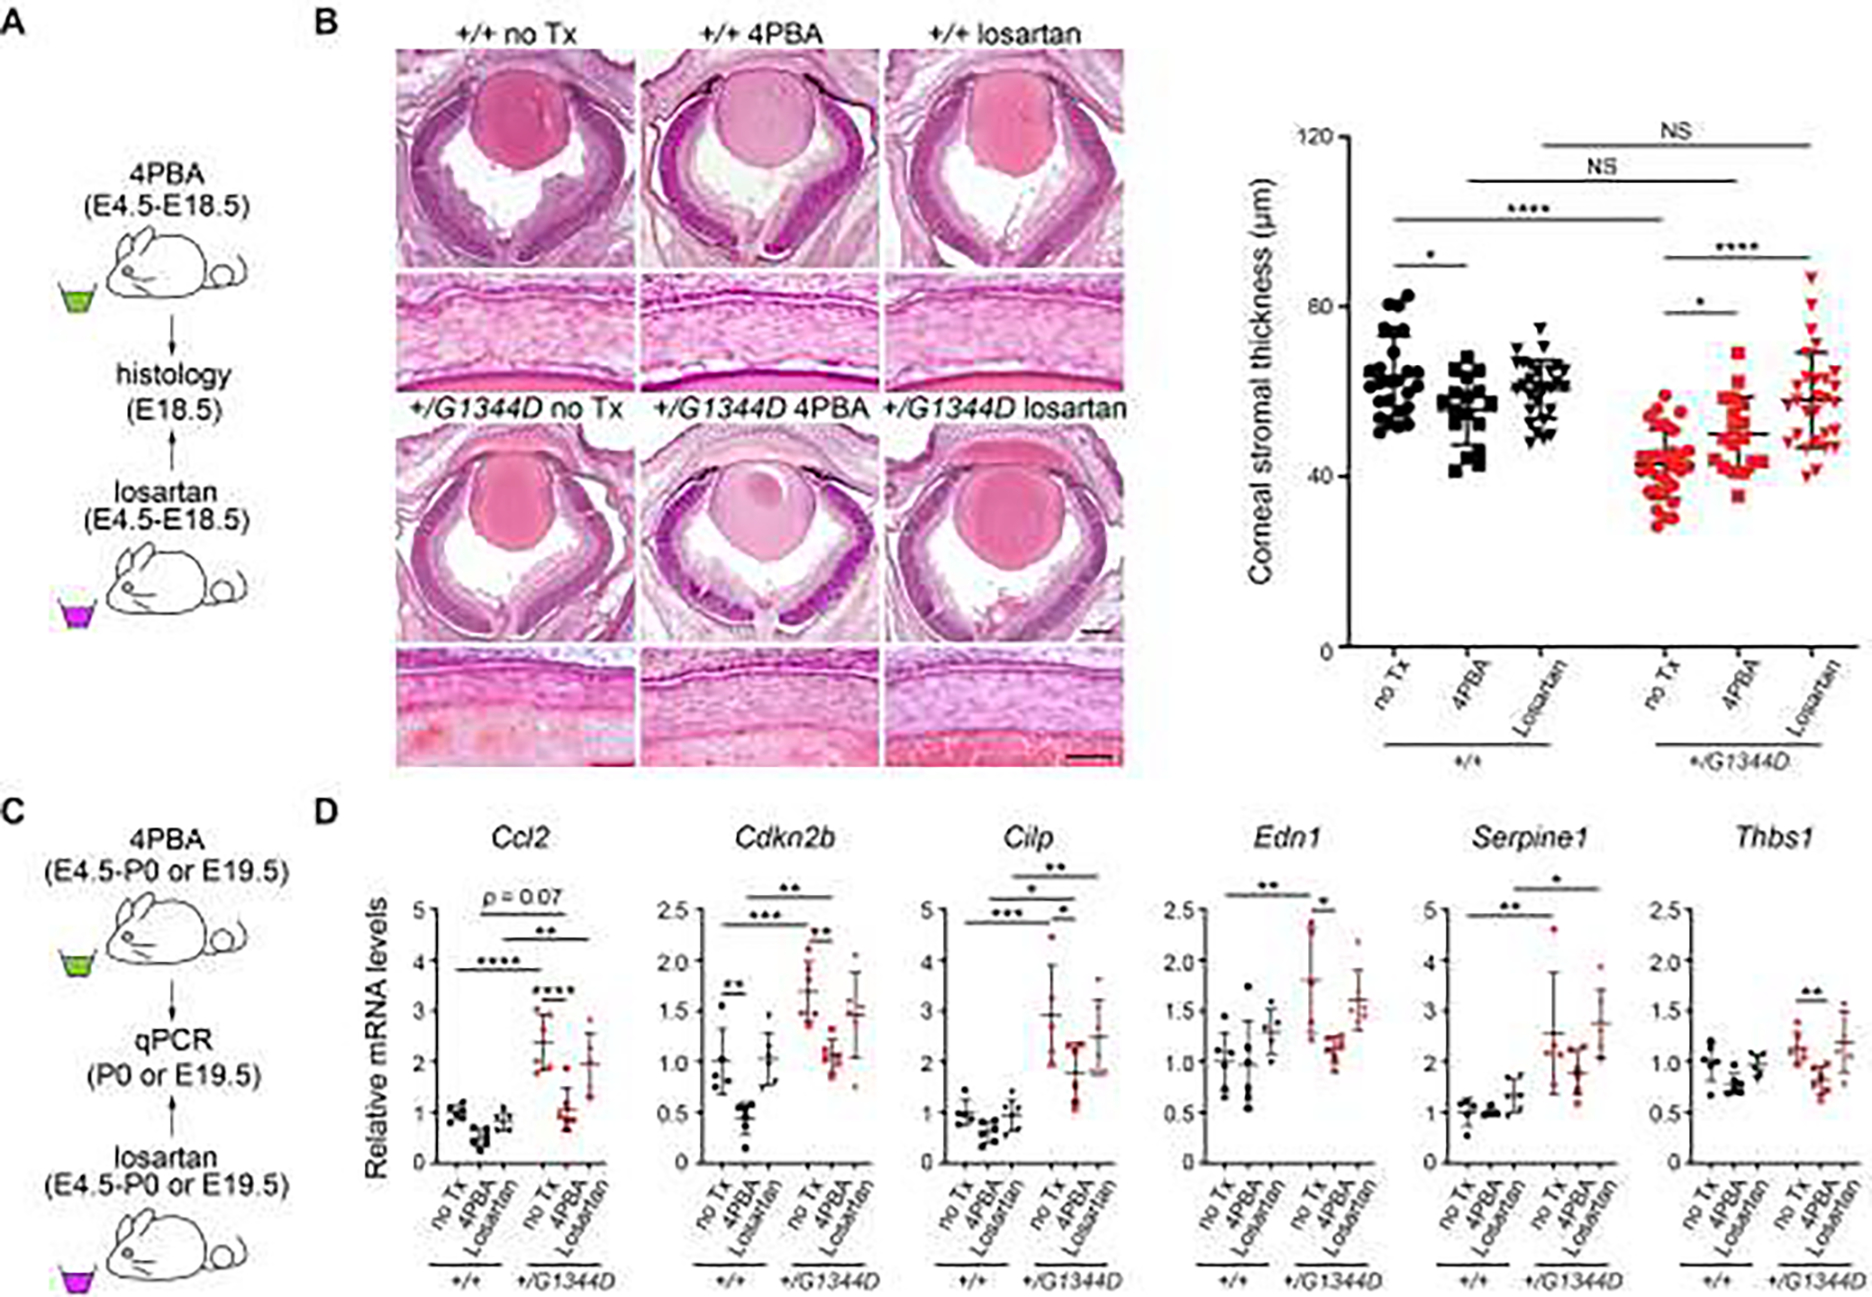
Ocular anterior segment dysgenesis (ASD) refers to a collection of developmental disorders affecting the anterior structures of the eye. Although a number of genes have been implicated in the etiology of ASD, the underlying pathogenetic mechanisms remain unclear. Mutations in genes encoding collagen type IV alpha 1 (COL4A1) and alpha 2 (COL4A2) cause Gould syndrome, a multi-system disorder that often includes ocular manifestations such as ASD and glaucoma. COL4A1 and COL4A2 are abundant basement membrane proteins that provide structural support to tissues and modulate signaling through interactions with other extracellular matrix proteins, growth factors, and cell surface receptors. In this study, we used a combination of histological, molecular, genetic and pharmacological approaches to demonstrate that altered TGFβ signaling contributes to ASD in mouse models of Gould syndrome. We show that TGFβ signaling was elevated in anterior segments from Col4a1 mutant mice and that genetically reducing TGFβ signaling partially prevented ASD. Notably, we identified distinct roles for TGFβ1 and TGFβ2 in ocular defects observed in Col4a1 mutant mice. Importantly, we show that pharmacologically promoting type IV collagen secretion or reducing TGFβ signaling ameliorated ocular pathology in Col4a1 mutant mice. Overall, our findings demonstrate that altered TGFβ signaling contributes to COL4A1-related ocular dysgenesis and implicate this pathway as a potential therapeutic target for the treatment of Gould syndrome.

Keywords: Anterior segment dysgenesis; Basement membrane; COL4A1; COL4A2; Gould syndrome; TGFβ; Type IV collagen.


Conflict of interest statement

Declaration of Competing Interest The authors declare no conflicts of interest.

Figures

Fig. 1.
Fig. 1.. Col4a1+/Δex41 mice have developmental corneal defects.
(A) Representative images (left) and quantification (right) of E18.5 H&E stained ocular sections showing reduced corneal stromal thickness (black bars) in Col4a1+/Δex41 mice. Asterisk indicates anterior hyphema. n = 31 Col4a1+/+ and 33 Col4a1+/Δex41 corneas. Scale bar = 50 μm. (B) Representative OCT images (left) and quantification (right) of anterior segments showing reduced CCT (red bars) in Col4a1+/Δex41 compared to Col4a1+/+ mice at 1.6–2.0 months. n = 18 Col4a1+/+ and 14 Col4a1+/Δex41 eyes. (C) Representative images (left) and quantification (right) of E18.5 corneas stained with DAPI (blue) showing that the number of corneal stromal nuclei was indistinguishable between Col4a1+/+ and Col4a1+/Δex41 mice, suggesting that corneal thinning in Col4a1+/Δex41 mice is not caused by a reduction in the number of keratocytes. Dashed lines indicate the stromal boundaries. n = 7 Col4a1+/+ and 15 Col4a1+/Δex41 corneas. Scale bar = 20 μm. (D and E) qPCR analyses showing the relative mRNA levels of genes encoding major corneal matrix molecules (D) and corneal endothelial markers (E) in P7 anterior segments. n = 5–6 per genotype. Data shown as fold expression relative to wildtype. (F) Representative Western blot images (left) and quantification (right) showing reduced CDH2 protein levels in P7 anterior segments from Col4a1+/Δex41 mice. n = 6 per genotype. Data shown as fold expression relative to wildtype. (G) Representative images of P7 corneal flat mounts immunolabeled for CDH2. Two out of four Col4a1+/Δex41 corneas examined, showed reduced CDH2 labeling intensity compared to their Col4a1+/+ counterparts. Scale bar = 20 μm. n = 4 per group. C, cornea; L, lens. Data are presented as mean ± SD. *p < 0.05; **p < 0.01; ****p < 0.0001, Student’s t-test.
Fig. 2.
Fig. 2.. TGFβ signaling is increased in developing anterior segment from Col4a1+/Δex41 mice.
(A) qPCR analyses showing increased expression of the TGFβ target genes Ccn2, Cdkn1a, and Serpine1 in anterior segments from P7 Col4a1+/Δex41 mice compared to Col4a1+/+ littermates. n = 6 per genotype. (B and C) Schematic representation of the breeding strategy to generate Col4a1+/+;SBE-Luc and Col4a1+/Δex41;SBE-Luc reporter mice (B) and quantification of luciferase activity using an in vitro luciferase assay (C) showing a significant increase in TGFβ signaling in P7 anterior segments from Col4a1+/Δex41;SBE-Luc mice compared to their Col4a1+/+;SBE-Luc counterparts. n = 11 per genotype. Data shown as fold expression relative to Col4a1+/+;SBE-Luc mice. (D) Representative Western blot images (left) and quantification (right) showing increased ratio of phosphorylated to total SMAD2 (pSMAD:SMAD2) protein levels in P7 anterior segments from Col4a1+/Δex41 mice compared to Col4a1+/+ littermates. n = 6 per genotype. Because the pSMAD2 antibody recognized two bands, quantification was done separately for each band. (E) Representative Western blot images (left) and quantification (right) using antibodies recognizing both SMAD2 and SMAD3 showing increased pSMAD2:SMAD2 and pSMAD3:SMAD3 in P7 anterior segments from Col4a1+/Δex41 mice compared to Col4a1+/+ littermates. n = 6 per genotype. Samples used in (D) and (E) were obtained from independent cohorts. (F) Representative images (left) of corneas immunolabeled for pSMAD2 (red) and counterstained with DAPI (blue), and quantification of corneal nuclear pSMAD2 labeling intensity (right) showing increased pSMAD2 levels in E18.5 Col4a1+/Δex41 mice compared to Col4a1+/+ littermates. Scale bar = 20 μm. n = 7 Col4a1+/+ and 15 Col4a1+/Δex41 corneas. Data are presented as mean ± SD. *p < 0.05; **p < 0.01, Student’s t-test.
Fig. 3.
Fig. 3.. Col4a1+/G1344D mice have corneal defects and increased TGFβ signaling.
(A) Representative OCT images of anterior segments (left) and quantification (right) showing reduced CCT in Col4a1+/G1344D mice at 1.6–2.0 months of age. n = 13 Col4a1+/+ and 12 Col4a1+/G1344D eyes. (B) qPCR analyses showing a trend towards reduced Col15a1 expression and altered expression of corneal endothelial markers in anterior segments from P7 Col4a1+/G1344D mice compared to Col4a1+/+ littermates. n = 11–12 per genotype. (C-D) Representative Western blot images (left) and quantification (right) showing reduced CDH2 protein levels (C) and a trend towards increased pSMAD2/3:SMAD2/3 ratio (D) in anterior segments from P7 Col4a1+/G1344D compared to Col4a1+/+ littermates. n = 6 per genotype. (E) GSEA of RNA-seq data from P0 Col4a1+/+ and Col4a1+/G1344D anterior segments showing positive enrichment of the TGFβ signaling pathway (WP113). NES, normalized enrichment score; FDR, false discovery rate. (F) Heatmap of DEGs in the anterior segment from P0 Col4a1+/+ and Col4a1+/G1344D mice contained in the enriched GO biological process “Response to transforming growth factor beta” (GO0071559). Colors representing high (red), low (blue) or average (white) expression values based on Z score normalized FPKM values for each gene. n = 3 Col4a1+/+ and 6 Col4a1+/G1344D P0 anterior segment samples. (G) qPCR validation of selected DEGs identified by RNA-seq. n = 5–6 per genotype. Data are presented as mean ± SD. *p < 0.05; **p < 0.01; ***p < 0.001; ****p < 0.0001, Student’s t-test.
Fig. 4.
Fig. 4.. Genetically reducing Tgfb2, but not Tgfb1, partially rescued corneal thickness in Col4a1+/G1344D mice.
(A) Representative OCT images (left) and quantification (right) showing that CCT was indistinguishable between Col4a1+/G1344D;Tgfb1+/+ and Col4a1+/G1344D;Tgfb1+/ mice. n = 24 Col4a1+/+;Tgfb1+/+, 20 Col4a1+/+;Tgfb1+/, 35 Col4a1+/G1344D;Tgfb1+/+, and 35 Col4a1+/G1344D;Tgfb1+/ eyes. (B) In contrast, OCT analyses revealed that genetically reducing Tgfb2 partially prevented CCT reduction in Col4a1+/G1344D mice. n=17 Col4a1+/+;Tgfb2+/+, 27 Col4a1+/+;Tgfb2+/, 20 Col4a1+/G1344D;Tgfb2+/+, and 25 Col4a1+/G1344D;Tgfb2+/ eyes. (C) qPCR analyses showing increased expression of TGFβ target genes in anterior segments from P7 Col4a1+/G1344D mice that was partially prevented by genetically reducing Tgfb2 expression. n = 9–12 samples per genotype. Data are presented as mean ± SD. *p < 0.05; **p < 0.01; ****p < 0.0001, one-way ANOVA and Sidak’s multiple comparison test.
Fig. 5.
Fig. 5.. 1D11 TGFβ neutralizing antibody increased corneal stromal thickness in Col4a1+/G1344D mice.
(A) Schematic illustration of the 1D11 administration paradigm for histological analysis. (B) Representative images of H&E stained sections (left) showing whole eyes (top panels) and corneas (lower panels) from E18.5 mice and quantification graph (right) showing increased corneal stromal thickness in Col4a1+/G1344D mice treated with 1D11 compared to those that received the control IgG1 antibody. Scale bars = 200 μm (top) and 50 μm (bottom). n = 20 and 24 corneas from IgG1- and 1D11-treated Col4a1+/+ mice, and 24 and 30 corneas from IgG1- and 1D11-treated Col4a1+/G1344D mice, respectively. (C) Schematic illustration of the 1D11 administration paradigm for qPCR analyses. (D) qPCR analyses revealed that 1D11 treatment partially prevented the increased expression of TGFβ target genes in anterior segments from P0 Col4a1+/G1344D mice compared to their IgG1-treated counterparts. n = 5–6 samples per genotype. Data are presented as mean ± SD. *p < 0.05; **p < 0.01; ***p < 0.001; and ****p < 0.0001, two-way ANOVA and Tukey’s multiple comparison test.
Fig. 6.
Fig. 6.. Pharmacological interventions using 4PBA or losartan partially prevented the reduction in corneal stromal thickness in Col4a1+/G1344D mice.
(A) Schematic illustration of the 4PBA and losartan treatment paradigms for histological analysis. (B) Representative images of H&E stained sections (left) showing whole eyes (top panels) and corneas (lower panels) from E18.5 mice and quantification graph (right) showing that 4PBA and losartan treatments both increased CCT in Col4a1+/G1344D mice. Of note, while losartan had no effect on CCT in Col4a1+/+ mice, 4PBA caused a small reduction in CCT in Col4a1+/+ mice. Scale bars = 200 μm (top) and 50 μm (bottom). n = 26, 17, and 28 corneas from untreated, 4PBA- and losartan-treated Col4a1+/+ mice, respectively, and 30, 18, and 28 corneas from untreated, 4PBA- and losartan-treated Col4a1+/G1344D mice, respectively. (C) Schematic illustration of the 4PBA or losartan treatment paradigms for qPCR analyses. (D) qPCR analyses revealed that 4PBA, but not losartan, partially prevented the elevated expression of TGFβ target genes in anterior segments from E19.5 Col4a1+/G1344D mice. Data are presented as mean ± SD. *p < 0.05; **p < 0.01; ***p < 0.001; ****p < 0.0001; two-way ANOVA and Tukey’s multiple comparison test.

Similar articles

Cited by

References

    1. Gould DB, John SW, Anterior segment dysgenesis and the developmental glaucomas are complex traits, Human molecular genetics 11(10) (2002) 1185–93. - PubMed
    1. Sowden JC, Molecular and developmental mechanisms of anterior segment dysgenesis, Eye 21(10) (2007) 1310–8. - PubMed
    1. Reis LM, Semina EV, Genetics of anterior segment dysgenesis disorders, Current opinion in ophthalmology 22(5) (2011) 314–24. - PMC - PubMed
    1. Ito YA, Walter MA, Genomics and anterior segment dysgenesis: a review, Clinical & experimental ophthalmology 42(1) (2014) 13–24. - PubMed
    1. D’Haene B, Meire F, Claerhout I, Kroes HY, Plomp A, Arens YH, de Ravel T, Casteels I, De Jaegere S, Hooghe S, Wuyts W, van den Ende J, Roulez F, Veenstra-Knol HE, Oldenburg RA, Giltay J, Verheij JB, de Faber JT, Menten B, De Paepe A, Kestelyn P, Leroy BP, De Baere E, Expanding the spectrum of FOXC1 and PITX2 mutations and copy number changes in patients with anterior segment malformations, Investigative ophthalmology & visual science 52(1) (2011) 324–33. - PubMed

Publication types

Substances

Supplementary concepts