. 2022 Jun;23(3-4):129-140.
doi: 10.1038/s41435-022-00172-w. Epub 2022 May 7.

Macrophage-mediated anti-tumor immunity against high-risk neuroblastoma

Affiliations

Macrophage-mediated anti-tumor immunity against high-risk neuroblastoma

Xao X Tang et al. Genes Immun. 2022 Jun.

Abstract

Neuroblastoma is the most common extracranial childhood solid tumor. The majority of high-risk neuroblastoma is resistant/refractory to the current high intensity therapy. Neuroblastoma lacks classical HLA Class I expression and exhibits low mutation burden, allowing neuroblastoma cells to evade CD8+ T cell-mediated immunity. Neuroblastoma cells do not express PD-L1, and tumor-associated macrophages are the predominant PD-L1+ cells in the tumor. In this study, we performed gene expression profiling and survival analyses on large neuroblastoma datasets to address the prognostic effect of PD-L1 gene expression and the possible involvement of the SLAMF7 pathway in the anti-neuroblastoma immunity. High-level expression of PD-L1 was found significantly associated with better outcome of high-risk neuroblastoma patients; two populations of PD-1+ PD-L1+ macrophages could be present in high-risk tumors with PD-1/PD-L1 ratios, ≈1 and >1. Patients with the PD-1/PD-L1 ratio >1 tumor showed inferior survival. High-level co-expression of SLAMF7 and SH2D1B was significantly associated with better survival of the high-risk neuroblastoma patients. Together, this study supports the hypothesis that macrophages are important effector cells in the anti-high-risk neuroblastoma immunity, that PD-1 blockade therapy can be beneficial to the high-risk neuroblastoma subset with the PD-1/PD-L1 expression ratio >1, and that SLAMF7 is a new therapeutic target of high-risk neuroblastoma.


Conflict of interest statement

The authors declare that the research was conducted in the absence of any commercial or financial relationships that could be construed as a potential conflict of interest.

Figures

Fig. 1
Fig. 1. High-level expression of classical HLA Class II genes in high-risk neuroblastoma and its clinical implications.
A HLA-related gene expression was examined for the high-risk subset of Cohort 1 by the R2. High-level expression of classical HLA-Class II genes (HLA-DRA, HLA-DRB1, HLA-DPA1, HLA-DPB1) was detected in high-risk neuroblastoma tissues. A similar trend was observed in Cohort 2 (see Fig. S1). B (a) HLA-DRA expression was significantly correlated with HLA-DRB1 expression in high-risk neuroblastomas of Cohort 1. (b) Combination of high HLA-DRA and HLA-DRB1 expressions was significantly associated with prolonged survival of the high-risk patients of Cohort 1. C (a) HLA-DPA1 expression was significantly correlated with HLA-DPB1 expression in high-risk neuroblastomas of Cohort 1. (b) Combination of high HLA-DPA1 and HLA-DPB1 expressions was significantly associated with prolonged survival of the high-risk patients of Cohort 1. The expression unit of genes in Cohort 1 is Reads Per Million (RPM). Average expression of each gene was shown as Log2 of RPM. Error bars indicate standard deviations.
Fig. 2
Fig. 2. Macrophages are predominant classical HLA Class II positive cells in the TME of high-risk neuroblastoma.
Macrophage signature genes (CD14, CD68, and CD163) were expressed at significantly higher levels compared to dendritic cell signature genes (CD1C, CLEC9A, and LAMP3) and B cell signature genes (CD19, CD20, and CD79A). All three genes in each cell type exhibited similar expression levels. The expression of HLA-DRA in high-risk neuroblastoma tissues was shown as a representative of the overall antigen-presenting cell population. Similar data were also obtained for Cohort 2 (see Fig. S2). To maximize accuracy of the analysis, we used three signature genes for a given cell type to evaluate relative abundance of each cell type. The expression unit of genes in Cohort 1 is Reads Per Million (RPM). Each number in the figure panels indicates the average expression level of the gene indicated. The horizontal bars at 2 Log2 RPM were included as a reference for the expression level. Statistical analysis was done using a two-tailed Student’s t test.
Fig. 3
Fig. 3. Prognostic significance of PD-L1 expression in neuroblastoma.
Two large neuroblastoma cohorts (Cohort 1: SEQC; Cohort 2: Kocak) were examined for the expression of PD-L1 and its relationship to the patient survival. Distribution of disease stages of Cohort 1 and Cohort 2 demonstrates a similarity of the two cohorts in terms of the patients make up (a and e). For both Cohort 1 and Cohort 2, tumor stage was classified according to the International Neuroblastoma Staging System. Cohort 1 included the following tumors: stage 1 (n = 121, MYCN-amplified, n = 3), stage 2 (n = 78, MYCN-amplified, n = 5), stage 3 (n = 63, MYCN-amplified, n = 15), stage 4 (n = 183, MYCN-amplified, n = 65), and stage 4S (n = 53, MYCN-amplified, n = 4). Cohort 2 was composed of the following tumors: stage 1 (n = 153, MYCN-amplified, n = 5), stage 2 (n = 113, MYCN-amplified, n = 4), stage 3 (n = 91, MYCN-amplified, n = 15), stage 4 (n = 214, MYCN-amplified, n = 65), stage 4S (n = 78, MYCN-amplified, n = 4). The cutoff value for Cohort 1 was set at 2.044 Reads Per Million (RPM) for the total cohort and the high-risk subset, and 2.021 RPM for the low-risk subset (the closest value to 2.044 RPM among the low-risk subset). This allowed us to compare the effect of similar levels of PD-L1 positive cells on survival of neuroblastoma patients of different subsets. Note that a formal gene expression unit does not apply to Cohort 2 as the normalization of gene expression levels was done using the custom algorithm. The cutoff value for Cohort 2 was set at 301.2 for the total cohort and the low-risk subset, and 300.4 for the high-risk subset. The analysis was done using the R2 platform (http://r2.amc.nl).
Fig. 4
Fig. 4. Co-expression of PD-1 and PD-L1 on M2-like macrophages and its prognostic implication for high-risk neuroblastoma.
A, D 3D correlation analysis of PD-1, PD-L1 and CD163 expressions in high-risk neuroblastomas. A significant 3-way correlation among the expression of PD-1, PD-L1 and CD163 was observed in high-risk neuroblastomas of Cohorts 1 and 2. Notably, there was a population of PD-L1 + tumors that overexpressed PD-1 relative to PD-L1 (indicated by the circle). B, E Relationship between PD-1 and PD-L1 expressions in high-risk neuroblastomas. PD-1 expression was correlated significantly with PD-L1 expression. However, there was a population of tumors in which PD-1 expression levels exceeded PD-L1 expression (indicated by the circle). Based on the expression levels of PD-1 and PD-L1, the tumors can be divided into three groups: Group 1 exhibited high levels of both PD-1 and PD-L1 expression, but levels of PD-1 expression were higher than those of PD-L1 (PD-1/PD-L1 > 1); Group 2 showed equally high levels of both PD-1 and PD-L1 expressions (PD-1/PD-L1 ≈ 1); Group 3 showed low expression of both PD-1 and PD-L1. C Prognostic implication of PD-1 and PD-L1 expressions in high-risk neuroblastomas of Cohort 1. Survival of patients in the Groups 1, 2, and 3 defined in Fig. 4B was compared. Group 2 with both PD-1 and PD-L1 high expression exhibited significantly better survival than Group 3 with both PD-1 and PD-L1 low expression. Group 1 showed a similar trend to Group 3. The expression unit of genes in Cohort 1 is Reads Per Million (RPM). Multivariable survival analysis (as shown in Fig. 4C for Cohort 1) could not be done on Cohort 2 because of the lack of necessary information in the R2. The custom algorithm was used to normalize the expression level of genes in Cohort 2, and therefore no formal unit applied to the expression level.
Fig. 5
Fig. 5. Prognostic implication of high-level expression of CD68 and CD163 in high-risk neuroblastoma.
A The majority of tumor associated macrophages in unfavorable histology neuroblastoma coexpresses CD68 and CD163. Serial sections from an unfavorable histology neuroblastoma with MYCN amplification were stained with either (a) anti-CD68 or (b) anti-CD163 antibodies. Red circles indicate macrophages that co-express CD68 and CD163. The scale bar: 50μm. A similar observation was also made in a favorable histology neuroblastoma (see Fig. S4B). B (a) CD68 expression was highly correlated with CD163 expression in high-risk neuroblastomas of Cohort 1. (b) The high-risk neuroblastoma patients with high-level expressions of both CD68 and CD163 showed prolonged survival. A similar analysis could not be done for Cohort 2 due to the lack of necessary information embedded in the Kocak-649 dataset in the R2. The expression unit of genes in Cohort 1 is Reads Per Million (RPM).
Fig. 6
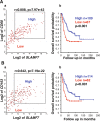
Fig. 6. SLAMF7 expression in macrophages is associated with prolonged survival of high-risk neuroblastoma patients.
A (a) CD68 and SLAMF7 expressions were highly correlated with each other. (b) Combination of high CD68 and high SLAMF7 expressions was significantly associated with better survival of the high-risk neuroblastoma patients. B (a) CD163 and SLAMF7 expressions were highly correlated with each other. (b) Combination of high CD163 and high SLAMF7 expressions was significantly associated with better survival of the high-risk neuroblastoma patients. Cohort 1 was used in the analysis. The expression unit of genes in Cohort 1 is Reads Per Million (RPM).
Fig. 7
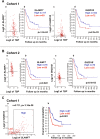
Fig. 7. Potential involvement of the SLAMF7/EAT-2 pathway activation in macrophages in the anti-high-risk neuroblastoma immune response.
A Cohort 1: (a) The expression of SLAMF7, encoding a macrophage activating receptor was detected in high-risk neuroblastomas of Cohort 1. (b) High SLAMF7 expression was associated with better survival of high-risk neuroblastoma patients. Similar observations were made for SH2D1B, encoding the obligatory activating signal transduction molecule EAT-2 (c, d). The housekeeping gene TBP was used as a reference. The expression unit of genes in Cohort 1 is Reads Per Million (RPM). B Cohort 2: the SLAMF7/EAT-2 pathway in macrophages in high-risk neuroblastomas of Cohort 2. The expression of SLAMF7 and SH2D1B was detected in high-risk neuroblastoma tissues of Cohort 2 (a, c). High expressions of both SLAMF7 and SH2D1B were associated with better survival of high-risk neuroblastoma patients of Cohort 2 (b, d). The custom algorithm was used to normalize the expression level of genes in Cohort 2, and therefore no formal unit applied to the expression level. C (a) SLAMF7 and SH2D1B expressions were highly correlated with each other. (b) Patients having high-risk neuroblastoma with high expression of both SLAMF7 and SH2D1B exhibited better survival. Cohort 1 was used in the analysis. The expression unit of genes in Cohort 1 is Reads Per Million (RPM).
Fig. 8
Fig. 8. The expression of SLAMF7 relative to those of B4GALNT1 and ST8SIA1 in high-risk neuroblastomas.
Expression levels of SLAMF7 in high-risk neuroblastomas of Cohort 1 and Cohort 2 were compared to those of neuroblastoma signature genes (B4GALNT1 and ST8SIA1, encoding GD2 synthase and GD3 synthase, respectively). These enzymes are responsible for the expression of GD2 disialogangliosides on the neuroblastoma cell surface, providing an immunotherapy target. GD3 synthase is considered the rate-limiting enzyme of GD2 synthesis pathway and often subjected to epigenetic down-regulation. The neuroblastoma marker gene PHOX2B was used as a reference. The horizontal bars represent the cutoff values used for survival analysis of SLAMF7 expression shown in Fig. 7A-a for Cohort 1 and Fig. 7B-a for Cohort 2. Based on the pattern of the SLAMF7 expression, ~67% and 72% of high-risk neuroblastomas in Cohort 1 and Cohort 2, respectively, likely expressed SLAMF7. These patients showed better survival. The expression unit of genes in Cohort 1 is Reads Per Million (RPM). The custom algorithm was used to normalize the expression level of genes in Cohort 2, and therefore no formal unit applied to the expression level.

Similar articles

Cited by

References

    1. Irwin MS, Naranjo A, Zhang FF, Cohn SL, London WB, Gastier-Foster JM, et al. Revised neuroblastoma risk classification system: a report from the Children’s Oncology Group. J Clin Oncol. 2021;39:3229–41. - PMC - PubMed
    1. Whelan JP, Chatten J, Lampson LA. HLA class I and b2-microglobulin expression in frozen and formaldehyde-fixed paraffin sections of neuroblastoma tumors. Cancer Res. 1985;45:5976–83. - PubMed
    1. Wölfl M, Jungbluth AA, Garrido F, Cabrera T, Meyen-SouthardS, Spitz R, et al. Expression of MHC class I, MHC class II, and cancer germlineantigens in neuroblastoma. Cancer Immunology, Immunotherapy. 2005;54:400–6 - PMC - PubMed
    1. Lawrence MS, Stojanov P, Polak P, Kryukov GV, Cibulskis K, Sivachenko A, et al. Mutational heterogeneity in cancer and the search for newcancer-associated genes. Nature. 2013;499:214. - PMC - PubMed
    1. Tang XX, Shimada H, Ikegaki N. Clinical relevance of CD4 cytotoxic T cells in high-risk neuroblastoma. Front Immunol. 2021;12:650427. doi: 10.3389/fimmu.2021.650427. - DOI - PMC - PubMed

Publication types

MeSH terms

Substances