. 2022 Jul;474(7):681-697.
doi: 10.1007/s00424-022-02693-9. Epub 2022 May 8.

Two adjacent phosphorylation sites in the C-terminus of the channel's α-subunit have opposing effects on epithelial sodium channel (ENaC) activity

Affiliations

Two adjacent phosphorylation sites in the C-terminus of the channel's α-subunit have opposing effects on epithelial sodium channel (ENaC) activity

Alexei Diakov et al. Pflugers Arch. 2022 Jul.

Erratum in

Abstract

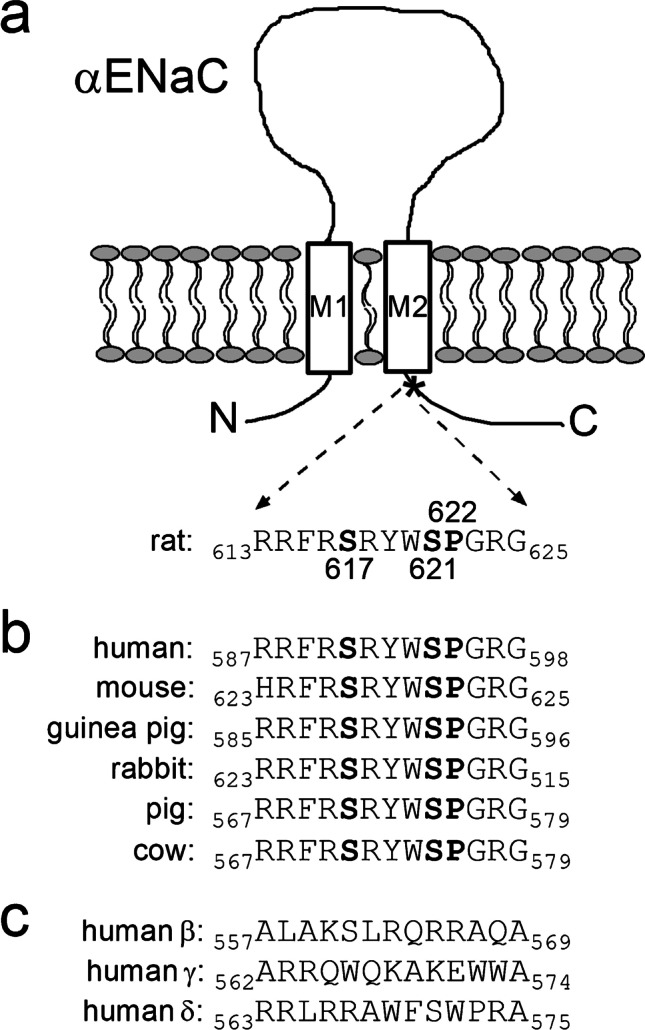
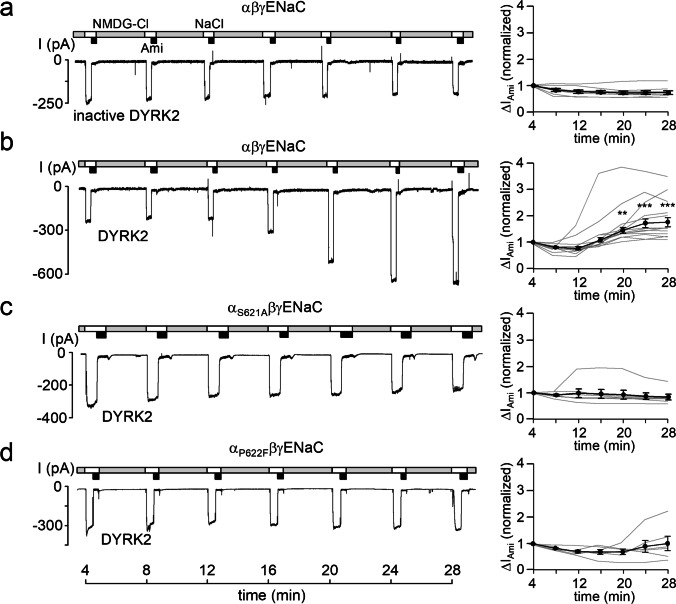
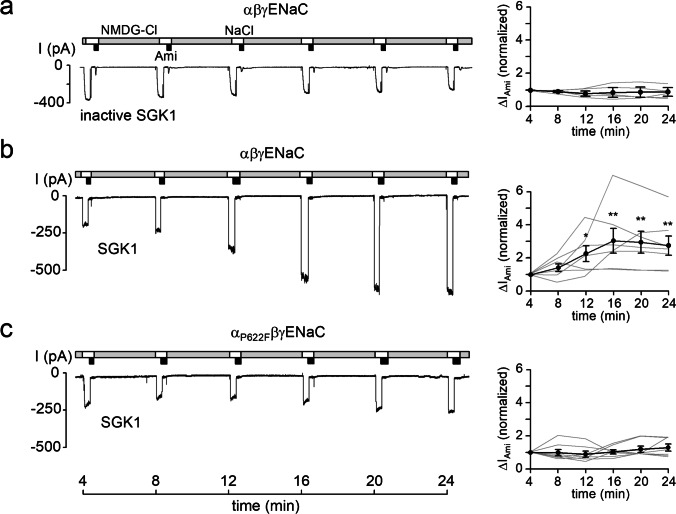
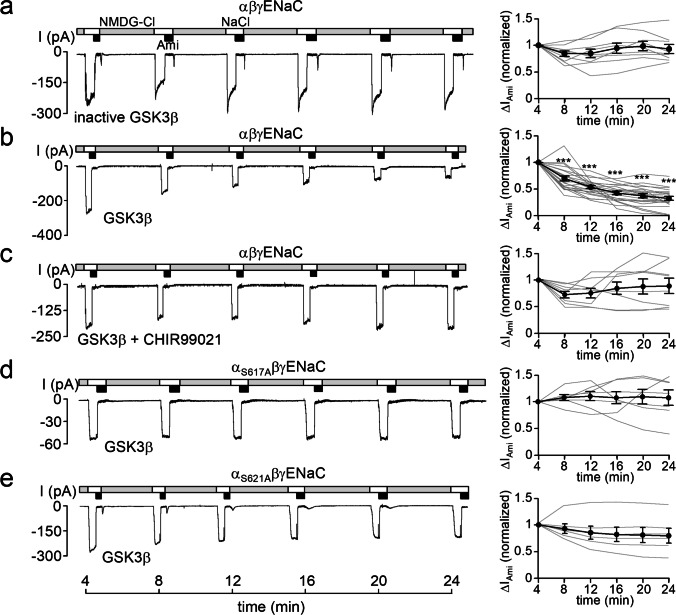
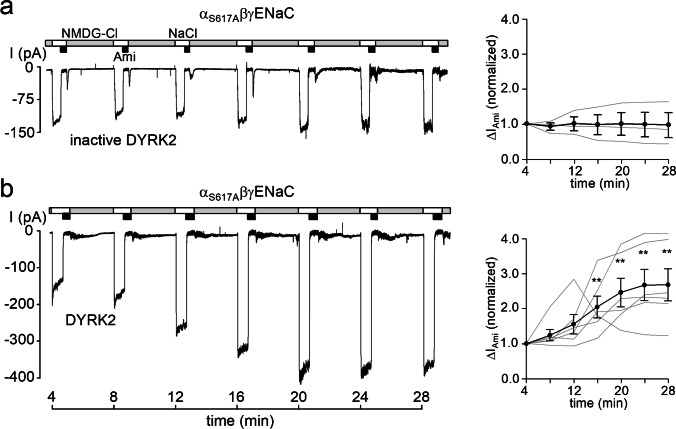
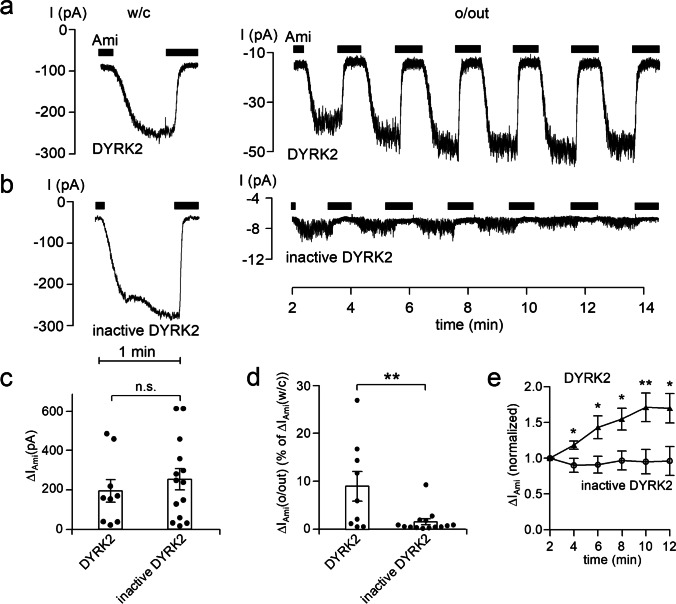
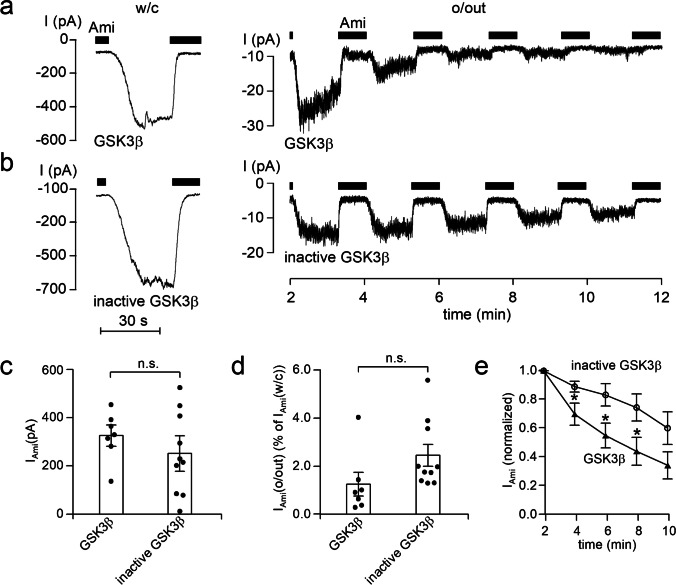
How phosphorylation of the epithelial sodium channel (ENaC) contributes to its regulation is incompletely understood. Previously, we demonstrated that in outside-out patches ENaC activation by serum- and glucocorticoid-inducible kinase isoform 1 (SGK1) was abolished by mutating a serine residue in a putative SGK1 consensus motif RXRXX(S/T) in the channel's α-subunit (S621 in rat). Interestingly, this serine residue is followed by a highly conserved proline residue rather than by a hydrophobic amino acid thought to be required for a functional SGK1 consensus motif according to in vitro data. This suggests that this serine residue is a potential phosphorylation site for the dual-specificity tyrosine phosphorylated and regulated kinase 2 (DYRK2), a prototypical proline-directed kinase. Its phosphorylation may prime a highly conserved preceding serine residue (S617 in rat) to be phosphorylated by glycogen synthase kinase 3 β (GSK3β). Therefore, we investigated the effect of DYRK2 on ENaC activity in outside-out patches of Xenopus laevis oocytes heterologously expressing rat ENaC. DYRK2 included in the pipette solution significantly increased ENaC activity. In contrast, GSK3β had an inhibitory effect. Replacing S621 in αENaC with alanine (S621A) abolished the effects of both kinases. A S617A mutation reduced the inhibitory effect of GKS3β but did not prevent ENaC activation by DYRK2. Our findings suggest that phosphorylation of S621 activates ENaC and primes S617 for subsequent phosphorylation by GSK3β resulting in channel inhibition. In proof-of-concept experiments, we demonstrated that DYRK2 can also stimulate ENaC currents in microdissected mouse distal nephron, whereas GSK3β inhibits the currents.

Keywords: Dual-specificity tyrosine phosphorylated and regulated kinase 2 (DYRK2); Epithelial sodium channel (ENaC); Glycogen synthase kinase 3 beta (GSK3β); Microdissected mouse distal nephron; Patch clamp; Serum- and glucocorticoid-induced kinase isoform 1 (SGK1); Xenopus laevis oocytes.


Conflict of interest statement

The authors declare no competing interests.

Figures

Fig. 1
Fig. 1
Two serine residues and one proline residue are highly conserved in a C-terminal region of αENaC close to the second transmembrane domain. a Schematic representation of αENaC illustrating the extracellular loop, two transmembrane domains (M1 and M2), and intracellular N- and C-termini. The amino acid sequence of rat αENaC (residues 613–625) corresponds to the C-terminal region indicated by a star (*) and contains the serine residues 617 (S617) and 621 (S621) and the proline residue 622 (P622) highlighted in bold. b Amino acid sequence alignment of this highly conserved C-terminal region from several mammalian αENaC subunits. The residues homologous to S617, S621, and P622 in rat αENaC are highlighted in bold. c Amino acid sequence alignment of homologous C-terminal regions from human β-, γ-, and δENaC subunits
Fig. 2
Fig. 2
Recombinant DYRK2 stimulates ENaC currents in outside-out patches from Xenopus laevis oocytes. a, b, c, and d, Left panels, representative current traces recorded in outside-out patches of αβγENaC, αS621AβγENaC, and αP622FβγENaC expressing oocytes at a holding potential (Vhold) of − 70 mV. As indicated by the bars, bath solution was changed from a low Na+ (NMDG-Cl; [Na+] = 1 mM) to a normal Na+ containing solution (NaCl; [Na+] = 96 mM) without or with amiloride (Ami, 2 μM). Heat-inactivated DYRK2 (inactive DYRK2) or active recombinant DYRK2 (80 U/ml) were included in the pipette solutions as indicated under the traces. Right panels, summary of normalized ∆IAmi values obtained from similar experiments as shown in the representative traces (left panels). Each grey line corresponds to an individual outside-out patch clamp recording and connects ∆IAmi values obtained at different time points. The black lines in each graph connect average ∆IAmi values (mean ± SEM; αβγENaC/inactive DYRK2, n = 8; αβγENaC/DYRK2, n = 13; αS621AβγENaC/DYRK2, n = 7; αP622FβγENaC/DYRK2, n = 6). ∆IAmi values determined at individual time points were compared with the corresponding initial ∆IAmi value at 4 min using paired Student’s ratio t-test. ** p < 0.01; *** p < 0.001
Fig. 3
Fig. 3
Recombinant SGK1 fails to stimulate αP622FβγENaC. Left panels, representative current traces recorded in outside-out patches of αβγENaC (a, b) or αP622FβγENaC (C) expressing oocytes as described in Fig. 2. Heat-inactivated SGK1 (inactive SGK1) or constitutively active recombinant SGK1 (80 U/ml) were included in the pipette solutions as indicated under the traces. Right panels, summary of normalized ∆IAmi values obtained from similar experiments as shown in the representative traces (left panels) using the same symbols as in Fig. 2. αβγENaC/inactive SGK1, n = 5; αβγENaC/SGK1, n = 7; αP622FβγENaC/SGK1, n = 7. ∆IAmi values determined at individual time points were compared with the corresponding initial ∆IAmi value at 4 min using paired Student’s ratio t-test. * p < 0.05; ** p < 0.01
Fig. 4
Fig. 4
Recombinant GSK3β inhibits ENaC currents. Left panels, representative current traces recorded in outside-out patches of αβγENaC (a, b, c), αS617AβγENaC (d), or αS621AβγENaC (e) expressing oocytes as described in Fig. 2. Heat-inactivated GSK3β (inactive GSK3β) or active recombinant GSK3β (16 U/ml) were included in the pipette solutions as indicated under the traces. In c, the GSK3β inhibitor CHIR99021 (2 µM) was included in the pipette solutions together with GSK3β. Right panels, summary of normalized ∆IAmi values obtained from similar experiments as shown in the representative traces (left panels) using the same symbols as in Fig. 2. αβγENaC/inactive GSK3β, n = 9; αβγENaC/GSK3β, n = 20; αβγENaC/GSK3β + CHIR99021, n = 8; αS617AβγENaC/GSK3β, n = 7; αS621AβγENaC/GSK3β, n = 6. ∆IAmi values determined at individual time points were compared with the corresponding initial ∆IAmi value at 4 min using paired Student’s ratio t-test. *** p < 0.001
Fig. 5
Fig. 5
Recombinant DYRK2 activates αS617AβγENaC. a and b, left panels, representative current traces recorded in outside-out patches of αS617AβγENaC expressing oocytes as described in Fig. 2. Heat-inactivated DYRK2 (inactive DYRK2) or active recombinant DYRK2 (80 U/ml) were included in the pipette solutions as indicated under the traces. Right panels, summary of normalized ∆IAmi values obtained from similar experiments as shown in the representative traces (left panels) using the same symbols as in Fig. 2. αS617AβγENaC/inactive DYRK2, n = 3; αS617AβγENaC/DYRK2, n = 6. ∆IAmi values determined at individual time points were compared with the corresponding initial ∆IAmi value at 4 min using paired Student’s ratio t-test. ** p < 0.01
Fig. 6
Fig. 6
DYRK2 stimulates ENaC currents in outside-out patches excised from the apical membrane of principal cells in split open microdissected mouse renal tubules. a and b Representative current traces from whole-cell (left panels) and subsequent outside-out (right panels) patch-clamp recordings at a continuous Vhold of − 60 mV. Black bars indicate the presence of amiloride (Ami, 2 μM) in the bath solution. Active recombinant DYRK2 (40 U/ml; a) or heat-inactivated DYRK2 (inactive DYRK2; b) were included in the pipette solutions as indicated under the traces. c–e Summary of data from similar experiments as shown in the representative traces (a and b, left panels) with DYRK2 (n = 9) or inactive DYRK2 (n = 14) in the pipette solution. In c and d, black dots correspond to measurements from individual patches, and open columns with error bars represent mean values ± SEM. ∆IAmi values shown in c were determined in the whole-cell configuration. Data shown in d represent ∆IAmi values from outside-out patches (∆IAmi(o/out)) expressed as percentage of the corresponding whole-cell ∆IAmi values (% of ∆IAmi (w/c)). DYRK2, n = 9; inactive DYRK2, n = 14. In c and d, statistical significance was assessed by unpaired Student’s t-test and unpaired Student’s ratio t-test, respectively. e Averaged normalized ΔIAmi recorded in outside-out patches as illustrated in a (right panel) at different times after patch excision with DYRK2 (solid triangles, n = 9) or inactive DYRK2 (open circles, n = 14) in the pipette solution. In e, ∆IAmi values determined at individual time points were compared with the corresponding initial ∆IAmi value at 2 min using paired Student’s ratio t-test. * p < 0.05; ** p < 0.01; n.s. not significant
Fig. 7
Fig. 7
GSK3β inhibits ENaC currents in outside-out patches excised from the apical membrane of principal cells in split open microdissected mouse renal tubules. a and b Representative current traces from whole-cell (left panels) and subsequent outside-out (right panels) patch-clamp recordings from experiments similar to those shown in Fig. 6. Active recombinant GSK3β (8 U/ml; a) or heat-inactivated GSK3β (inactive GSK3β; b) were included in the pipette solutions as indicated under the traces. c–e Summary of data from similar experiments as shown in the representative traces (a and b, left panels) with GSK3β (n = 7) or inactive GSK3β (n = 10) in the pipette solution. In c and d, black dots correspond to measurements from individual patches, and open columns with error bars represent mean values ± SEM. ∆IAmi values shown in c were determined in the whole-cell configuration. Data shown in d represent ∆IAmi values from outside-out patches (∆IAmi(o/out)) expressed as percentage of the corresponding whole-cell ∆IAmi values (% of ∆IAmi (w/c)). GSK3β, n = 7; inactive GSK3β, n = 10. In c and d, statistical significance was assessed by unpaired Student’s t-test and unpaired Student’s ratio t-test, respectively. e Averaged normalized ΔIAmi recorded in outside-out patches as illustrated in a (right panel) at different times after patch excision with GSK3β (solid triangles, n = 7) or inactive GSK3β (open circles, n = 10) in the pipette solution. In e, ∆IAmi values determined at individual time points were compared with the corresponding initial ∆IAmi value at 2 min using paired Student’s ratio t-test. * p < 0.05; n.s. not significant

Similar articles

Cited by

References

    1. Alessi DR, Caudwell FB, Andjelkovic M, Hemmings BA, Cohen P. Molecular basis for the substrate specificity of protein kinase B; comparison with MAPKAP kinase-1 and p70 S6 kinase. FEBS Lett. 1996;399:333–338. doi: 10.1016/s0014-5793(96)01370-1. - DOI - PubMed
    1. Alvarez de la Rosa D, Zhang P, Naray-Fejes-Toth A, Fejes-Toth G, Canessa CM. The serum and glucocorticoid kinase sgk increases the abundance of epithelial sodium channels in the plasma membrane of Xenopus oocytes. J Biol Chem. 1999;274:37834–37839. doi: 10.1074/jbc.274.53.37834. - DOI - PubMed
    1. Baines D. Kinases as targets for ENaC regulation. Curr Mol Pharmacol. 2013;6:50–64. doi: 10.2174/18744672112059990028. - DOI - PubMed
    1. Baxendale-Cox LM, Duncan RL. Insulin increases sodium Na+ channel density in A6 epithelia: implications for expression of hypertension. Biol Res Nurs. 1999;1:20–29. doi: 10.1177/109980049900100104. - DOI - PubMed
    1. Becker W, Weber Y, Wetzel K, Eirmbter K, Tejedor FJ, Joost HG. Sequence characteristics, subcellular localization, and substrate specificity of DYRK-related kinases, a novel family of dual specificity protein kinases. J Biol Chem. 1998;273:25893–25902. doi: 10.1074/jbc.273.40.25893. - DOI - PubMed

Publication types

LinkOut - more resources