Meta-Analysis
. 2022 Oct;164(10):2751-2765.
doi: 10.1007/s00701-022-05225-7. Epub 2022 May 8.

Prevalence of incidental intracranial findings on magnetic resonance imaging: a systematic review and meta-analysis

Affiliations
Meta-Analysis

Prevalence of incidental intracranial findings on magnetic resonance imaging: a systematic review and meta-analysis

Divya Elizabeth Sunny et al. Acta Neurochir (Wien). 2022 Oct.

Abstract

Background: As the volume and fidelity of magnetic resonance imaging (MRI) of the brain increase, observation of incidental findings may also increase. We performed a systematic review and meta-analysis to determine the prevalence of various incidental findings.

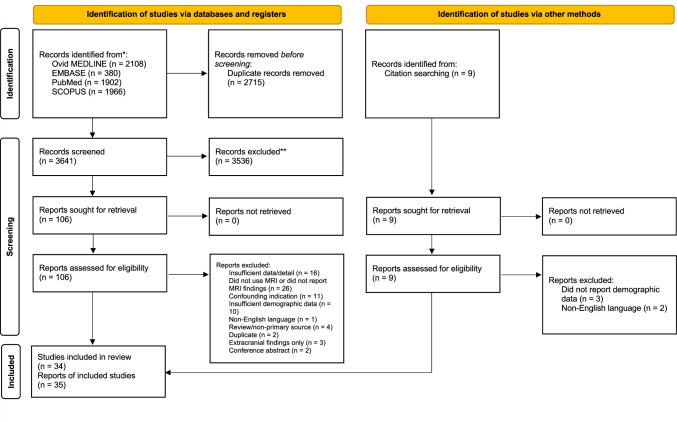
Methods: PubMed/MEDLINE, EMBASE and SCOPUS were searched from inception to May 24, 2021. We identified 6536 citations and included 35 reports of 34 studies, comprising 40,777 participants. A meta-analysis of proportions was performed, and age-stratified estimates for each finding were derived from age-adjusted non-linear models.

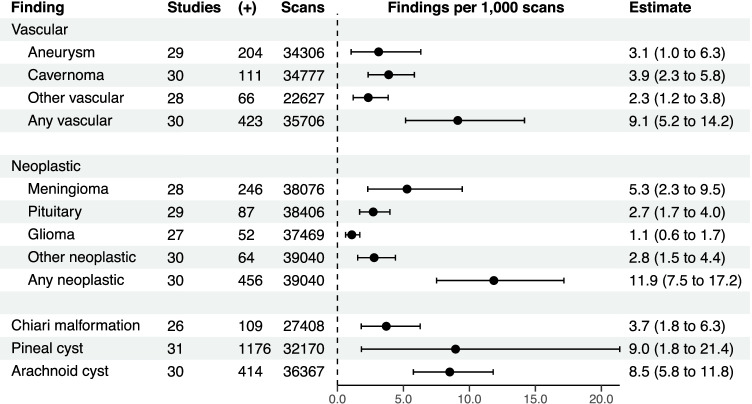
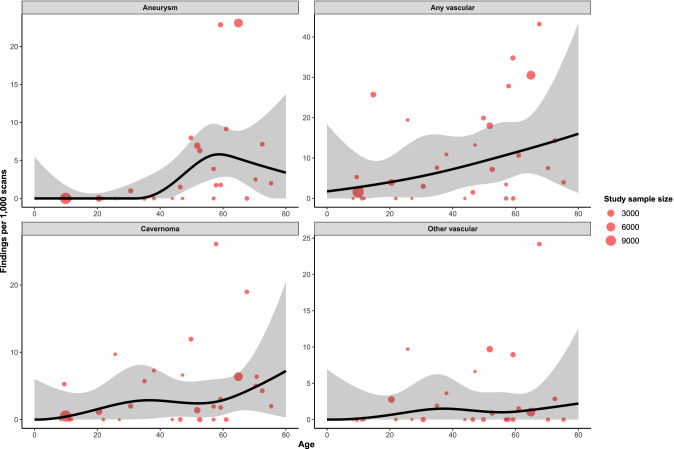
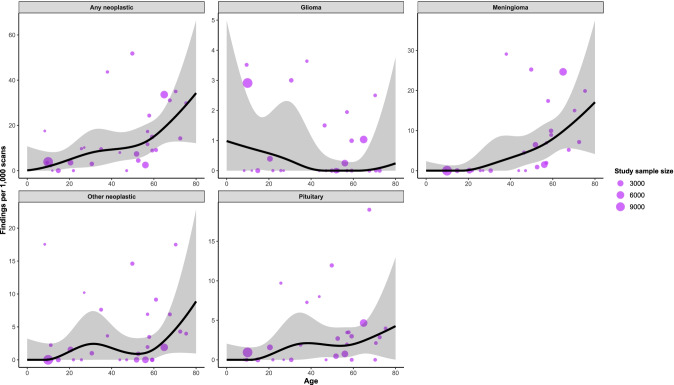
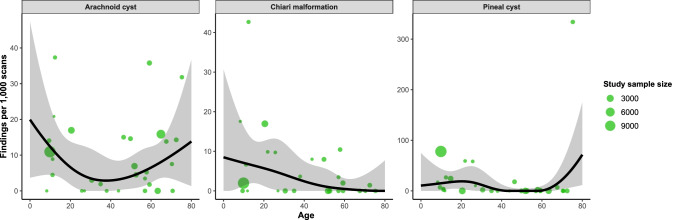
Results: Vascular abnormalities were observed in 423/35,706 participants (9.1/1000 scans, 95%CI 5.2-14.2), ranging from 2/1000 scans (95%CI 0-7) in 1-year-olds to 16/1000 scans (95%CI 1-43) in 80-year-olds. Of these, 204/34,306 were aneurysms (3.1/1000 scans, 95%CI 1-6.3), which ranged from 0/1000 scans (95%CI 0-5) at 1 year of age to 6/1000 scans (95%CI 3-9) at 60 years. Neoplastic abnormalities were observed in 456/39,040 participants (11.9/1000 scans, 95%CI 7.5-17.2), ranging from 0.2/1000 scans (95%CI 0-10) in 1-year-olds to 34/1000 scans (95%CI 12-66) in 80-year-olds. Meningiomas were the most common, in 246/38,076 participants (5.3/1000 scans, 95%CI 2.3-9.5), ranging from 0/1000 scans (95%CI 0-2) in 1-year-olds to 17/1000 scans (95%CI 4-37) in 80-year-olds. Chiari malformations were observed in 109/27,408 participants (3.7/1000 scans, 95%CI 1.8-6.3), pineal cysts in 1176/32,170 (9/1000 scans, 95%CI 1.8-21.4) and arachnoid cysts in 414/36,367 (8.5/1000 scans, 95%CI 5.8-11.8).

Conclusion: Incidental findings are common on brain MRI and may result in substantial resource expenditure and patient anxiety but are often of little clinical significance.

Keywords: Aneurysm; Incidental finding; Incidentaloma; MRI; Magnetic resonance imaging.


Conflict of interest statement

The authors declare no competing interests.

Figures

Fig. 1
Fig. 1
PRISMA flowchart detailing article screening and selection
Fig. 2
Fig. 2
Risk of bias in each domain in the included studies
Fig. 3
Fig. 3
Crude estimates of the number of findings per 1000 scans in each category. ( +), number of positive scans
Fig. 4
Fig. 4
Relationship between proportion of each vascular finding and age, derived from restricted cubic spline meta-regression models. Red dots show the findings of individual studies, with the size of the point relative to study sample size. Black lines are fitted estimates, while the shaded area is the 95% confidence interval of the fitted estimate
Fig. 5
Fig. 5
Relationship between proportion of each neoplastic finding and age, derived from restricted cubic spline meta-regression models. Purple dots show the findings of individual studies, with the size of the point relative to study sample size. Black lines are fitted estimates, while the shaded area is the 95% confidence interval of the fitted estimate
Fig. 6
Fig. 6
Relationship between proportion of each other finding and age, derived from restricted cubic spline meta-regression models. Green dots show the findings of individual studies, with the size of the point relative to study sample size. Black lines are fitted estimates, while the shaded area is the 95% confidence interval of the fitted estimate
Fig. 7
Fig. 7
Relationship between proportion of findings and publication year, derived from multivariable meta-regression models additionally adjusted for age. Proportions on the y-axis relate to median age in the given analysis. Points show the findings of individual studies, with the size of the point relative to study sample size. Black lines are the fitted estimates, while the shaded area is the 95% confidence area of the fitted estimate

References

    1. Agarwal R, Bergey M, Sonnad S, Butowsky H, Bhargavan M, Bleshman MH. Inpatient CT and MRI utilization: trends in the academic hospital setting. J Am Coll Radiol. 2010;7(12):949–955. doi: 10.1016/j.jacr.2010.08.015. - DOI - PubMed
    1. Alphs HH, Schwartz BS, Stewart WF, Yousem DM. Findings on brain MRI from research studies of occupational exposure to known neurotoxicants. AJR Am J Roentgenol. 2006;187(4):1043–1047. doi: 10.2214/AJR.05.0421. - DOI - PubMed
    1. Alturkustani A, Bock Y, Bajunaid K, Lingawi S, Baeesa S. Significant incidental brain magnetic resonance imaging findings in migraine headache patients: retrospective cross-sectional study. Clin Neurol Neurosurg. 2020 doi: 10.1016/j.clineuro.2020.106019. - DOI - PubMed
    1. Backes D, Rinkel GJE, Greving JP, et al. ELAPSS score for prediction of risk of growth of unruptured intracranial aneurysms. Neurology. 2017;88(17):1600–1606. doi: 10.1212/WNL.0000000000003865. - DOI - PubMed
    1. Baumgart D, Egelhof T. Preventive whole-body screening encompassing modern imaging using magnetic resonance tomography. Herz. 2007;32(5):387–394. doi: 10.1007/s00059-007-3020-1. - DOI - PubMed