. 2022 May 7;14(1):24.
doi: 10.1038/s41368-022-00175-3.

Loss of KDM4B impairs osteogenic differentiation of OMSCs and promotes oral bone aging

Affiliations

Loss of KDM4B impairs osteogenic differentiation of OMSCs and promotes oral bone aging

Peng Deng et al. Int J Oral Sci. .

Abstract

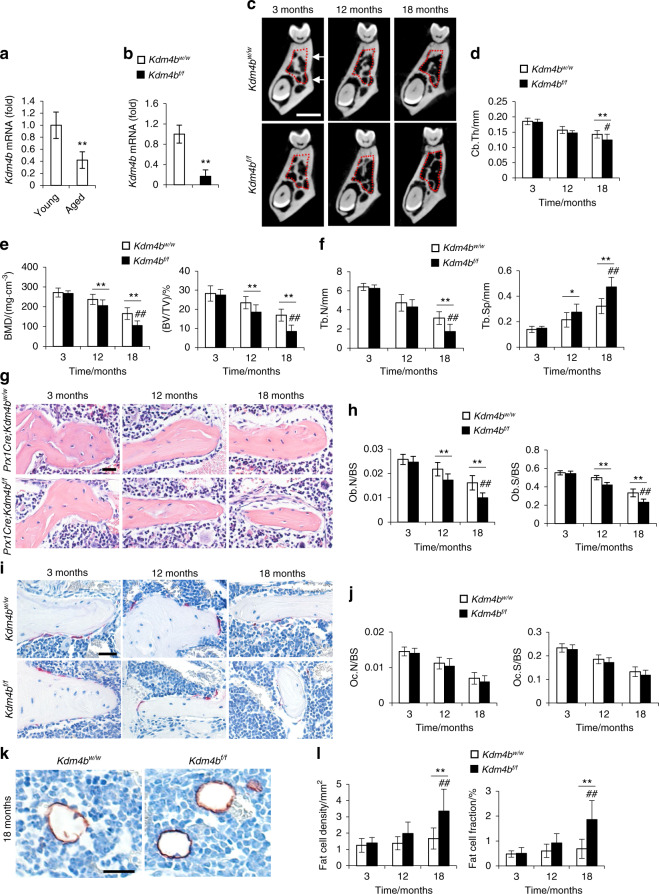
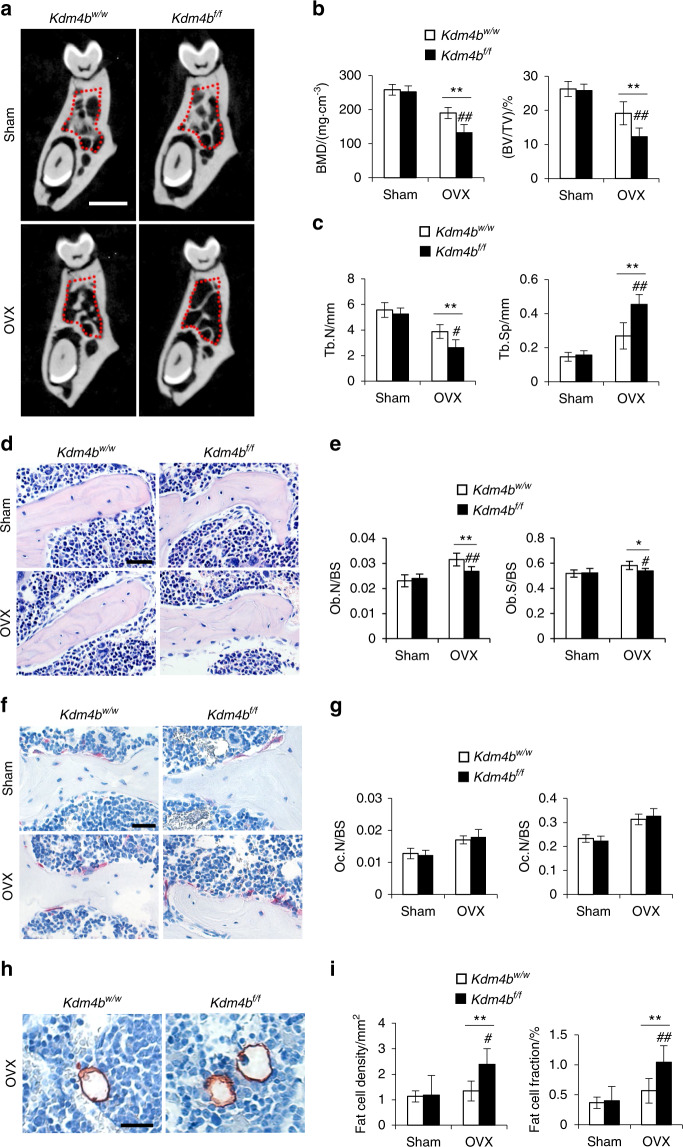
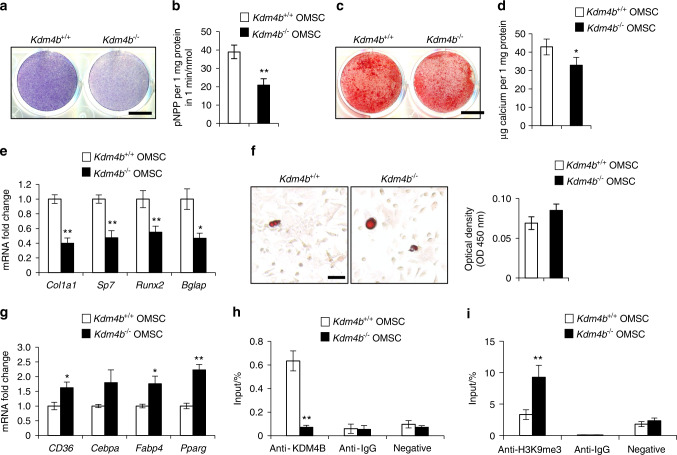
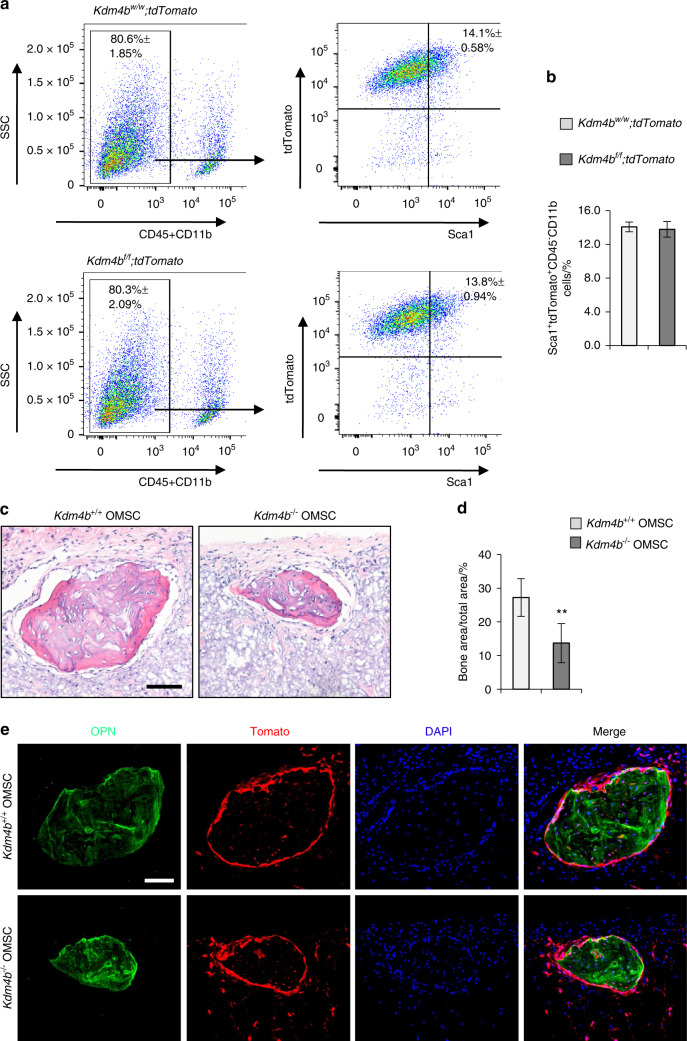
Aging of craniofacial skeleton significantly impairs the repair and regeneration of trauma-induced bony defects, and complicates dental treatment outcomes. Age-related alveolar bone loss could be attributed to decreased progenitor pool through senescence, imbalance in bone metabolism and bone-fat ratio. Mesenchymal stem cells isolated from oral bones (OMSCs) have distinct lineage propensities and characteristics compared to MSCs from long bones, and are more suited for craniofacial regeneration. However, the effect of epigenetic modifications regulating OMSC differentiation and senescence in aging has not yet been investigated. In this study, we found that the histone demethylase KDM4B plays an essential role in regulating the osteogenesis of OMSCs and oral bone aging. Loss of KDM4B in OMSCs leads to inhibition of osteogenesis. Moreover, KDM4B loss promoted adipogenesis and OMSC senescence which further impairs bone-fat balance in the mandible. Together, our data suggest that KDM4B may underpin the molecular mechanisms of OMSC fate determination and alveolar bone homeostasis in skeletal aging, and present as a promising therapeutic target for addressing craniofacial skeletal defects associated with age-related deteriorations.


Conflict of interest statement

The authors declare no competing interests.

Figures

Fig. 1
Fig. 1
Deletion of Kdm4b in OMSCs enhances age-related bone loss and adipose accumulation in mandible. a qRT-PCR showing mRNA levels of Kdm4b in OMSCs isolated from young and aged mice. **P < 0.01. n = 5. b mRNA expression level of Kdm4b in OMSCs isolated from Prx1Cre;Kdm4bw/w (Kdm4bw/w) and Prx1Cre;Kdm4bf/f (Kdm4bf/f) mice. **P < 0.01. n = 6. c Three-dimensional (3-D) images of mandibles constructed by µCT from Kdm4bw/w and Kdm4bf/f mice at 3-, 12- and 18-month old, respectively. Scale bar, 1 mm. n ≥ 14 per group. Red dashed lines indicate the region of trabecular bone analysis performed, and the arrows indicate the limits for cortical thickness analysis. d Quantitative measurements of Cb.Th in mandibles from Kdm4bw/w and Kdm4bf/f mice. **P < 0.01; #P < 0 .05. n ≥ 14 per group. e BMD and BV/TV measurements by µCT of mandibular bone from Kdm4bw/w and Kdm4bf/f mice. **P < 0.01; ##P < 0.01. n ≥ 14 per group. f Tb.N and Tb.Sp quantification by µCT of mandibles from Kdm4bw/w and Kdm4bf/f mice. *P < 0.05; **P < 0.01; ##P < 0.01. n ≥ 14 per group. g Histological hematoxylin and eosin (H&E) staining of trabecular bones in mandibles from Kdm4bw/w and Kdm4bf/f mice. Scale bar, 30 µm. n ≥ 12 per group. h Histological data analysis of osteoblasts number and osteoblasts surface/bone surface (Ob.N/BS and Ob.S/BS, respectively) in mandibles from Kdm4bw/w and Kdm4bf/f mice. **P < 0.01; ##P < 0.01. n ≥ 12 per group. i TRAP staining of osteoclasts in mandibles from Kdm4bw/w and Kdm4bf/f mice. Scale bar, 40 µm. n ≥ 12 per group. j Quantitative data of Oc.N/BS and Oc.S/BS, respectively, from Kdm4bw/w and Kdm4bf/f mice. n ≥ 12 per group. k Histochemical detection of Perilipin-1 expression in mandibles from Kdm4bw/w and Kdm4bf/f mice. Scale bar, 30 µm. n ≥ 12 per group. l Density of adipocytes and the fat fraction of adipose tissue in mandibles from Kdm4bw/w and Kdm4bf/f mice. **P < 0.01; ##P < 0.01. n ≥ 12 per group
Fig. 2
Fig. 2
Deletion of Kdm4b in mesenchymal cells using Prx1Cre exacerbates OVX-induced bone loss and adipose accumulation in mouse mandibles. a 3-D images of mandibles constructed by µCT from Kdm4bw/w and Kdm4bf/f mice after sham and OVX. Red dashed lines indicate the area of trabecular bone analysis performed. Scale bar, 1 mm. n = 8. b BMD and BV/TV measurements of mandibular bone from Kdm4bw/w and Kdm4bf/f mice after sham and OVX. **P < 0.01; ##P < 0.01. n = 8. c Tb.N and Tb.Sp quantification of trabeculae of mandibles from Kdm4bw/w and Kdm4bf/f mice after sham and OVX. **P < 0.01; #P < 0.05; ##P < 0.01. n = 8. d H&E staining of trabecular bones in mandibles from sham and OVXed Kdm4bw/w and Kdm4bf/f mice. Scale bar, 40 µm. n = 8. e Quantitative analysis of Ob.N/BS and Ob.S/BS in mandibles from sham and OVXed Kdm4bw/w and Kdm4bf/f mice. *P < 0.05, **P < 0.01; #P < 0.05; ##P < 0.01. n = 8. f TRAP staining of osteoclasts in mandibles from sham and OVXed Kdm4bw/w and Kdm4bf/f mice. Scale bar, 40 µm. n = 8. g Quantitative histological analysis of Oc.N/BS and Oc.S/BS in mandibles from sham and OVXed Kdm4bw/w and Kdm4bf/f mice. **P < 0.01; #P < 0.05; ##P < 0.01. n = 8. h Histochemical detection of Perilipin-1 expression in mandibles from sham and OVXed Kdm4bw/w and Kdm4bf/f mice. Scale bar, 30 µm. n = 8. i Density of adipocytes and the fat fraction of adipose tissue in mandibles from sham and OVXed Kdm4bw/w and Kdm4bf/f mice. **P < 0.01; #P < 0.05; ##P < 0.01. n = 8
Fig. 3
Fig. 3
Loss of KDM4B inhibits osteogenic differentiation of OMSCs in vitro. a ALP staining of Kdm4b+/+ and Kdm4b−/− OMSCs undergone osteogenic induction. Scale bar, 8 mm. n = 4. b Quantitative ALP activity assay of Kdm4b+/+ and Kdm4b−/− OMSCs upon osteogenic induction. **P<0.01; n = 4. c ARS staining of Kdm4b+/+ and Kdm4b−/− OMSCs undergone osteogenic induction. Scale bar, 8 mm. n = 4. d Quantification of calcium deposit in ECM of ARS staining of c. *P < 0.05; n = 3. e mRNA expression of osteogenic marker genes Col1a1, Sp7, Runx2, and Bglap in Kdm4b and Kdm4b−/− OMSCs upon osteogenic induction. *P < 0.05; **P < 0.01. n = 3. f Oil Red O staining images and quantification of Kdm4b+/+ and Kdm4b−/− OMSCs following adipogenic induction. Scale bar, 150 μm. n = 3. g qRT-PCR analysis of the expression of CD36, Cebpa, Fabp4, and Pparg in Kdm4b+/+ and Kdm4b−/− OMSCs upon adipogenic induction. *P < 0.05; **P < 0.01. n = 3. h, i ChIP assays showing the levels of KDM4B (h) and H3K9me3 (i) on the Runx2 promoter in Kdm4b+/+ and Kdm4b−/− OMSCs. **P  < 0.01; n = 3
Fig. 4
Fig. 4
Loss of KDM4B inhibits ectopic bone formation of OMSCs in vivo. a FACS analysis for Sca1+tdTomato+CD45CD11b OMSCs from Kdm4bw/w;tdTomato and Kdm4bf/f;tdTomato mice at passage 2. n = 3. b The percentage of Sca1+tdTomato+CD45CD11b OMSCs from (a). c Histological images of the transplant-induced from Kdm4b+/+ and Kdm4b−/− OMSCs, respectively. Scale bar, 100 µm. n = 9. d Quantification of Bone areas over the total areas of transplants. **P < 0.01, n = 9. e Immunofluorescent images of transplant expressing OPN and tdTomato. Scale bar, 100 µm. n = 9
Fig. 5
Fig. 5
Loss of KDM4B promotes senescence of OMSCs. a Microscopic images of EdU incorporation in OMSCs from Kdm4bw/w;tdTomato and Kdm4bf/f;tdTomato mice at early and late passages, respectively. Scale bar, 40 μm. n = 3. b Quantification of EdU incorporation assay of (a). **P < 0.01; #P < 0.05. c SA-β-gal staining of Kdm4b+/+ and Kdm4b−/− OMSCs from 3-month-old Kdm4bw/w and Kdm4bf/f mice at early and late passages. Scale bar, 150 μm. n = 3. d Quantification of SA-β-gal staining of (c). **P < 0.01; ##P < 0.01. e SA-β-gal staining of Kdm4b+/+ and Kdm4b−/− OMSCs from 18-month-old Kdm4bw/w and Kdm4bf/f mice at passage 1. Scale bar, 150 μm. n = 3. f Quantification of SA-β-gal staining of (e). *P < 0.05. g qRT-PCR analyses of the expression of senescence genes markers P16, P21 and P53 in Kdm4b+/+ and Kdm4b−/− OMSCs. **P < 0.01. n = 4. h Western blot assay showing the expression of P16 and P21 in Kdm4b+/+ and Kdm4b−/− OMSCs. n = 3

Similar articles

Cited by

References

    1. Boskey AL. Bone composition: relationship to bone fragility and antiosteoporotic drug effects. Bonekey Rep. 2013;2:447. doi: 10.1038/bonekey.2013.181. - DOI - PMC - PubMed
    1. Boskey AL, Coleman R. Aging and bone. J. Dent. Res. 2010;89:1333–1348. doi: 10.1177/0022034510377791. - DOI - PMC - PubMed
    1. Deng P, et al. Loss of KDM4B exacerbates bone-fat imbalance and mesenchymal stromal cell exhaustion in skeletal aging. Cell Stem Cell. 2021;28:1057–1073.e7. doi: 10.1016/j.stem.2021.01.010. - DOI - PMC - PubMed
    1. Ahmed LA, et al. Progressively increasing fracture risk with advancing age after initial incident fragility fracture: The Tromsø Study. J. Bone Min. Res. 2013;28:2214–2221. doi: 10.1002/jbmr.1952. - DOI - PubMed
    1. Weaver CM, et al. The National Osteoporosis Foundation’s position statement on peak bone mass development and lifestyle factors: a systematic review and implementation recommendations. Osteoporos. Int. 2016;27:1281–1386. doi: 10.1007/s00198-015-3440-3. - DOI - PMC - PubMed

Publication types

Substances