. 2022 May 7;20(1):60.
doi: 10.1186/s12964-022-00858-8.

Mitochondrial apolipoprotein A-I binding protein alleviates atherosclerosis by regulating mitophagy and macrophage polarization

Affiliations

Mitochondrial apolipoprotein A-I binding protein alleviates atherosclerosis by regulating mitophagy and macrophage polarization

Meng Duan et al. Cell Commun Signal. .

Abstract

Apolipoprotein A-I binding protein (AIBP), a secreted protein, has been shown to play a pivotal role in the development of atherosclerosis. The function of intracellular AIBP, however, is not yet well characterized. Here, we found that AIBP is abundantly expressed within human and mouse atherosclerotic lesions and exhibits a distinct localization in the inner membrane of mitochondria in macrophages. Bone marrow-specific AIBP deficiency promotes the progression of atherosclerosis and increases macrophage infiltration and inflammation in low-density lipoprotein receptor-deficient (LDLR-/-) mice. Specifically, the lack of mitochondrial AIBP leads to mitochondrial metabolic disorders, thereby reducing the formation of mitophagy by promoting the cleavage of PTEN-induced putative kinase 1 (PINK1). With the reduction in mitochondrial autophagy, macrophages polarize to the M1 proinflammatory phenotype, which further promotes the development of atherosclerosis. Based on these results, mitochondrial AIBP in macrophages performs an antiatherosclerotic role by regulating of PINK1-dependent mitophagy and M1/M2 polarization. Video Abstract.

Keywords: AIBP; Atherosclerosis; Macrophage polarization; Mitophagy.


Conflict of interest statement

The authors declare that they have no competing interests.

Figures

Fig. 1
Fig. 1
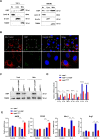
Bone marrow-specific deficiency of AIBP aggravates atherosclerosis in LDLR−/− mice. A Representative images showing Mac3 and AIBP staining in human samples obtained from coronary artery plaques (n = 3). Scale bar = 1000 μm. B Western blot analysis of the AIBP protein level in mouse atherosclerotic plaques. β-Actin bands indicate the loading control (n = 5). C Western blot analysis of AIBP levels in BMDMs from AIBPWT/LDLR−/− and AIBP∆BMK/LDLR−/− mice. β-Actin bands indicate the loading control (n = 5). D qPCR analysis of the AIBP mRNA levels in BMDMs from AIBPWT/LDLR−/− and AIBP∆BMK/LDLR−/− mice. E Body weights of AIBPWT/LDLR−/− and AIBP∆BMK/LDLR−/− mice fed a HFD for 8 weeks (n = 5). F Comparison of the composition of serum lipids between AIBPWT/LDLR−/− and AIBP∆BMK/LDLR−/− mice fed a HFD for 8 weeks. TC (total serum cholesterol), TG (triglyceride), LDL (low-density lipoprotein) and HDL (high-density lipoprotein) contents were assayed (n = 5). G Oil Red O staining of aortic trees from AIBPWT/LDLR−/− and AIBP∆BMK/LDLR−/− mice. H Cross-sections of aortic roots from mice stained with hematoxylin and eosin (H&E) and Oil Red O (n = 10). Scale bar = 100 μm. Data are presented as the means ± SD. *p < 0.05, **p < 0.01, and ***p < 0.001. Unpaired two-tailed Student’s t test
Fig. 2
Fig. 2
AIBPΔBMK promotes macrophage infiltration and proinflammatory polarization in LDLR−/− mice. A Representative images of Mac3 staining in aortic roots isolated from AIBPΔBMK/LDLR−/− and AIBPWT/LDLR−/− mice fed a high-fat diet (n = 3). Scale bar = 100 μm. B ELISA and qPCR were used to detect the protein and mRNA levels of inflammatory cytokines in the aorta (n = 5). C Flow cytometry analysis of macrophage infiltration and numbers of M1/M2-type macrophages in the blood of AIBPΔBMK/LDLR−/− and AIBPWT/LDLR−/− mice after 8 weeks of HFD consumption. n = 4–5 mice per group. D qPCR analysis of the mRNA levels of macrophage phenotype markers in aortas from AIBPΔBMK/LDLR−/− and AIBPWT/LDLR−/− mice (n = 5). E qPCR analysis of the mRNA levels of M1 and M2 markers in MPMs from AIBPΔBMK/LDLR−/− and AIBPWT/LDLR−/− mice after 8 weeks of HFD consumption that were stimulated with LPS + IFN-γ or IL-4 (n = 5). Data are presented as the means ± SD. *P < 0.05, **P < 0.01, and ***P < 0.001; one-way ANOVA followed by the Newman–Keuls test
Fig. 3
Fig. 3
Intracellular AIBP is located in the mitochondria of macrophages and inhibits inflammation. A Western blot was used to determine AIBP levels in the nuclei and mitochondria of THP-1-derived macrophages and BMDMs (n = 3). B Live cell imaging of BMDMs using a confocal microscope. Mitochondria were stained with MitoTracker Green. Scale bar = 2 μm. C Western blot analysis of AIBP levels in isolated mitochondria and BMDMs (n = 3). D qPCR analysis of the mRNA levels of inflammatory cytokines in BMDMs. E qPCR analysis of the mRNA levels of M1 and M2 marker genes in infected BMDMs treated with LPS + IFN-γ or IL-4 (n = 5). Data are presented as the means ± SD. *P < 0.05, **P < 0.01, and ***P < 0.001. One-way ANOVA followed by the Newman–Keuls test
Fig. 4
Fig. 4
Mitochondrial AIBP maintains mitochondrial OXPHOS. AB Alkaline extraction was performed using Na2CO3 to treat the mitochondrial fraction isolated from THP-1 cells. Both the soluble protein fraction (S) and integral membrane protein fraction (P) of AIBP were used for Western blot analysis. (M) Untreated control mitochondrial sample (n = 5). C Phenol red-containing cell culture media from AIBP−/−, AIBP−/− + LV-AIBP and AIBP(ΔMLS) BMDMs (n = 5). D BMDMs were seeded in Seahorse plates and incubated for 24 h. During the extracellular flux analysis, cells were sequentially treated with oligomycin (OM), carbonyl cyanide-4-(trifluoromethoxy) phenylhydrazone (FCCP), and rotenone (ROT) plus antimycin A (AA) to assess OXPHOS parameters related to the OCR levels or with glucose, oligomycin (OM), and 2-deoxyglucose (2-DG) to determine glycolysis parameters related to the ECAR levels. E Fluorescence images of BMDMs stained with 10 μM DCF-DA. Intracellular reactive oxygen species (ROS) generation was identified by measuring the DCF-DA intensity under a fluorescence microscope. Scale bar: 200 μm. F Flow cytometry analysis to detect ROS production. (G) ATP levels in AIBP−/−, AIBP−/− + LV-AIBP and AIBP(ΔMLS) BMDMs. H Cells were stained with JC-1. In nondamaged cells, JC-1 forms red-emitting aggregates in the mitochondrial matrix. A loss of red fluorescence and an increase in cytoplasmic green-emitting monomers signal the disruption of the mitochondrial transmembrane potential (ΔΨm). Scale bar: 50 μm. I ΔMφ was measured using flow cytometry after staining BMDMs with tetramethylrhodamine methylester (TMRM). Data are presented as the means ± SD. *P < 0.05, **P < 0.01, and ***P < 0.001. One-way ANOVA followed by the Newman–Keuls test
Fig. 5
Fig. 5
Mitochondrial AIBP maintains the macrophage phenotype by altering mitophagy through mitochondrial OXPHOS. A The ratio of mitochondrial DNA (mtDNA) to nuclear DNA (nucDNA) in AIBP−/−, AIBPWT or AIBP (ΔMLS) BMDMs was evaluated using qPCR (n = 5). B Western blot analysis of LC3b, p62 and TOM20 expression in BMDMs. C Live cell imaging of BMDMs using a confocal microscope. Mitochondria were stained with MitoTracker Green. Scale bar = 2 μm. D Western blot analysis of the expression of LC3b, p62 and TOM20 in BMDMs after treatment with mitochondrial division inhibitor 1 (mdivi-1). E qPCR analysis of the mRNA levels of M1 marker genes in BMDMs stimulated with LPS + IFN-γ after the Mdivi1 pretreatment and M2 marker genes in BMDMs stimulated with IL-4 after the Mdivi1 pretreatment (n = 5). Data are presented as the means ± SD. *P < 0.05, **P < 0.01, and ***P < 0.001. One-way ANOVA followed by the Newman–Keuls test
Fig. 6
Fig. 6
AIBP deficiency inhibits mitophagy via PINK1 cleavage. A Western blot analysis of the levels of Parkin and PINK1 in the total lysate of BMDMs (n = 5). B qPCR analysis of the Parkin and PINK1 mRNA levels in BMDMs (n = 5). C Western blot analysis of PINK1 and Parkin levels in the total lysate of BMDMs (n = 5). DE The interaction of AIBP with TIM23 in 293 T cells was assessed by performing coimmunoprecipitation and Western blot assays. F qPCR was performed to detect the mRNA levels of M1 markers and M2 markers in MPMs extracted from AIBP−/−, AIBPWT or AIBP(ΔMLS) mice in the LV-control (control) group and LV-PINK1 (PINK1) group that were separately stimulated with LPS + IFN-γ and IL-4 (n = 5). Data are presented as the means ± SD. *P < 0.05, **P < 0.01, and ***P < 0.001. One-way ANOVA followed by the Newman–Keuls test

Similar articles

Cited by

References

    1. Atherosclerosis. Nat Rev Dis Primers 2019, 5: 57. - PubMed
    1. Williams JW, Huang LH, Randolph GJ. Cytokine circuits in cardiovascular disease. Immunity. 2019;50:941–954. doi: 10.1016/j.immuni.2019.03.007. - DOI - PMC - PubMed
    1. Yin K, Deng X, Mo ZC, et al. Tristetraprolin-dependent post-transcriptional regulation of inflammatory cytokine mRNA expression by apolipoprotein A-I: role of ATP-binding membrane cassette transporter A1 and signal transducer and activator of transcription 3. J Biol Chem. 2011;286:13834–13845. doi: 10.1074/jbc.M110.202275. - DOI - PMC - PubMed
    1. Ouimet M, Ediriweera HN, Gundra UM, et al. MicroRNA-33-dependent regulation of macrophage metabolism directs immune cell polarization in atherosclerosis. J Clin Invest. 2015;125:4334–4348. doi: 10.1172/JCI81676. - DOI - PMC - PubMed
    1. Chinetti-Gbaguidi G, Colin S, Staels B. Macrophage subsets in atherosclerosis. Nat Rev Cardiol. 2015;12:10–17. doi: 10.1038/nrcardio.2014.173. - DOI - PubMed

Publication types