The role of serum amyloid A1 in the adipogenic differentiation of human adipose-derived stem cells basing on single-cell RNA sequencing analysis
- PMID: 35525990
- PMCID: PMC9080218
- DOI: 10.1186/s13287-022-02873-5
The role of serum amyloid A1 in the adipogenic differentiation of human adipose-derived stem cells basing on single-cell RNA sequencing analysis
Abstract
Background: Adipose-derived stem cells (ASCs) are obtained from a variety of sources in vivo where they present in large quantities. These cells are suitable for use in autologous transplantation and the construction of tissue-engineered adipose tissue. Studies have shown that ASCs differentiation is in a high degree of heterogeneity, yet the molecular basis including key regulators of differentiation remains to clarify.
Methods: We performed single-cell RNA sequencing and bioinformatics analysis on both undifferentiated (ASC-GM group) and adipogenically differentiated human ASCs (ASC-AD group, ASCs were cultured in adipogenic inducing medium for 1 week). And then, we verified the results of serum amyloid A1 (SAA1) with western blotting, immunofluorescence staining, oil red O staining. After these experiments, we down-regulated the expression of serum amyloid A1 (SAA1) gene to verify the adipogenic differentiation ability of ASCs.
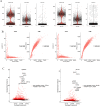
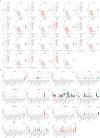
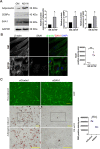
Results: In single-cell RNA sequence analyzing, we obtained 4415 cells in the ASC-GM group and 4634 cells in the ASC-AD group. The integrated sample cells could be divided into 11 subgroups (0-10 cluster). The cells in cluster 0, 2, 5 were came from ASC-GM group and the cells in cluster 1, 3, 7 came from ASC-AD group. The cells of cluster 4 and 6 came from both ASC-GM and ASC-AD groups. Fatty acid binding protein 4, fatty acid binding protein 5, complement factor D, fatty acid desaturase 1, and insulin like growth factor binding protein 5 were high expressed in category 1 and 7. Regulation of inflammatory response is the rank 1 biological processes. And cellular responses to external stimuli, negative regulation of defense response and acute inflammatory response are included in top 20 biological processes. Based on the MCODE results, we found that SAA1, C-C Motif Chemokine Ligand 5 (CCL5), and Annexin A1 (ANXA1) significantly highly expressed during adipogenic differentiation. Western blot and immunofluorescent staining results showed that SAA1 increased during adipogenesis. And the area of ORO positive staining in siSAA1 cells was significantly lower than in the siControl (negative control) cells.
Conclusions: Our results also indicated that our adipogenic induction was successful, and there was great heterogeneity in the adipogenic differentiation of ASCs. SAA1 with the regulation of inflammatory response were involved in adipogenesis of ASCs based on single-cell RNA sequencing analysis. The data obtained will help to elucidate the intrinsic mechanism of heterogeneity in the differentiation process of stem cells, thus, guiding the regulation of self-renewal and differentiation of adult stem cells.
Keywords: Adipogenesis; Adipose-derived stem cells (ASCs); Regulation of inflammatory response; Serum amyloid A1 (SAA1); Single-cell transcriptomic sequencing (scRNA-seq).
© 2022. The Author(s).
Conflict of interest statement
The authors declare no conflict of interest.
Figures


Similar articles
-
Human Adipose-Derived Mesenchymal Stromal/Stem Cell Spheroids Possess High Adipogenic Capacity and Acquire an Adipose Tissue-like Extracellular Matrix Pattern.Tissue Eng Part A. 2020 Aug;26(15-16):915-926. doi: 10.1089/ten.TEA.2019.0206. Epub 2020 Apr 9. Tissue Eng Part A. 2020. PMID: 32070231
-
Convergent alteration of the mesenchymal stem cell heterogeneity in adipose tissue during aging.FASEB J. 2023 Aug;37(8):e23114. doi: 10.1096/fj.202300807R. FASEB J. 2023. PMID: 37498236
-
Dynamics of adipogenic promoter DNA methylation during clonal culture of human adipose stem cells to senescence.BMC Cell Biol. 2007 May 29;8:18. doi: 10.1186/1471-2121-8-18. BMC Cell Biol. 2007. PMID: 17535427 Free PMC article.
-
Differences of embedding adipose-derived stromal cells in natural and synthetic scaffolds for dermal and subcutaneous delivery.Stem Cell Res Ther. 2021 Jan 19;12(1):68. doi: 10.1186/s13287-020-02132-5. Stem Cell Res Ther. 2021. PMID: 33468240 Free PMC article. Review.
-
A Wrong Fate Decision in Adipose Stem Cells upon Obesity.Cells. 2023 Feb 19;12(4):662. doi: 10.3390/cells12040662. Cells. 2023. PMID: 36831329 Free PMC article. Review.
Cited by
-
Development and Assessment of a Prediction Model for Alzheimer's Disease Diagnosis Based on Thermoregulation-Related Genes.Comb Chem High Throughput Screen. 2025;28(6):944-962. doi: 10.2174/0113862073291279240409035856. Comb Chem High Throughput Screen. 2025. PMID: 38747223
References
-
- Zuk P. Adipose-derived stem cells in tissue regeneration: a review. ISRN Stem Cells. 2013;2013:1–35. doi: 10.1155/2013/713959. - DOI
Publication types
MeSH terms
Substances
LinkOut - more resources
Full Text Sources
Research Materials
Miscellaneous

