. 2022 May 7;17(1):33.
doi: 10.1186/s13024-022-00535-x.

BIN1 is a key regulator of proinflammatory and neurodegeneration-related activation in microglia

Affiliations

BIN1 is a key regulator of proinflammatory and neurodegeneration-related activation in microglia

Ari Sudwarts et al. Mol Neurodegener. .

Abstract

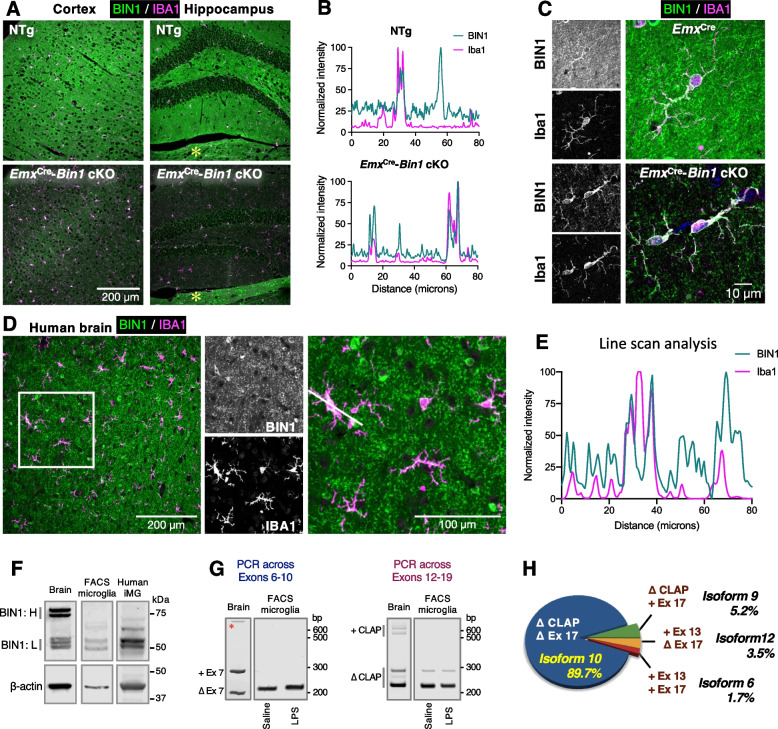
Background: The BIN1 locus contains the second-most significant genetic risk factor for late-onset Alzheimer's disease. BIN1 undergoes alternate splicing to generate tissue- and cell-type-specific BIN1 isoforms, which regulate membrane dynamics in a range of crucial cellular processes. Whilst the expression of BIN1 in the brain has been characterized in neurons and oligodendrocytes in detail, information regarding microglial BIN1 expression is mainly limited to large-scale transcriptomic and proteomic data. Notably, BIN1 protein expression and its functional roles in microglia, a cell type most relevant to Alzheimer's disease, have not been examined in depth.

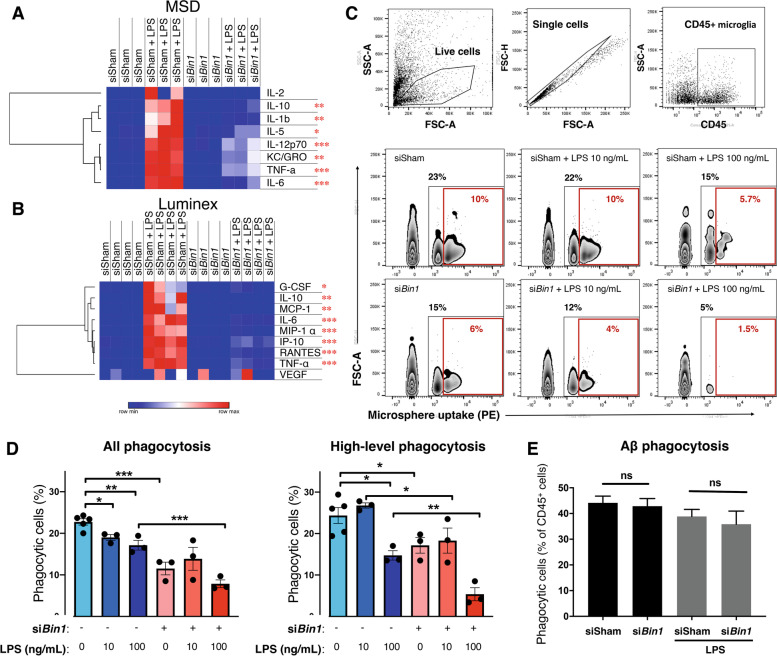
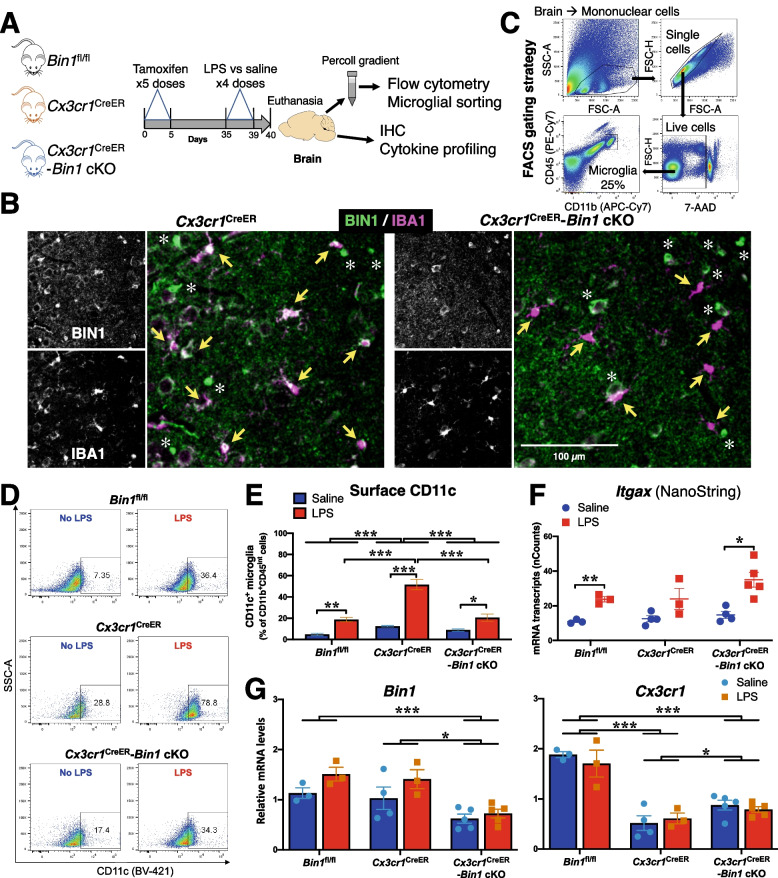
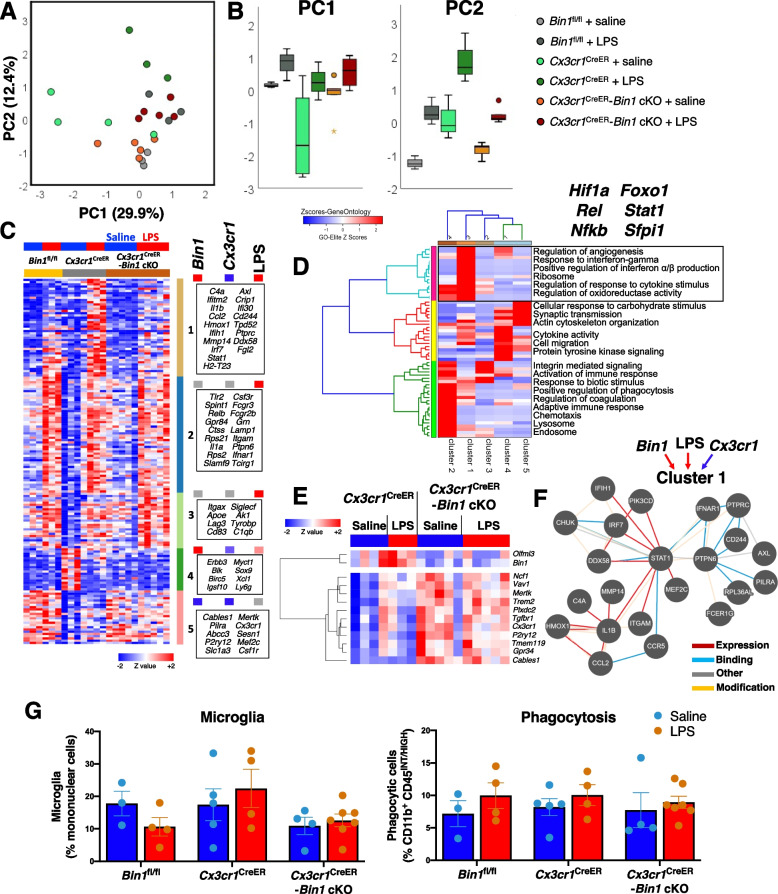
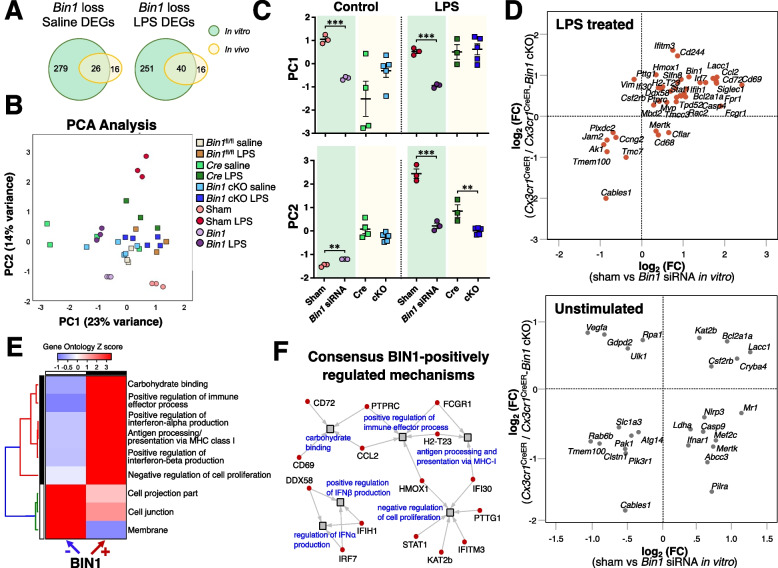
Methods: Microglial BIN1 expression was analyzed by immunostaining mouse and human brain, as well as by immunoblot and RT-PCR assays of isolated microglia or human iPSC-derived microglial cells. Bin1 expression was ablated by siRNA knockdown in primary microglial cultures in vitro and Cre-lox mediated conditional deletion in adult mouse brain microglia in vivo. Regulation of neuroinflammatory microglial signatures by BIN1 in vitro and in vivo was characterized using NanoString gene panels and flow cytometry methods. The transcriptome data was explored by in silico pathway analysis and validated by complementary molecular approaches.

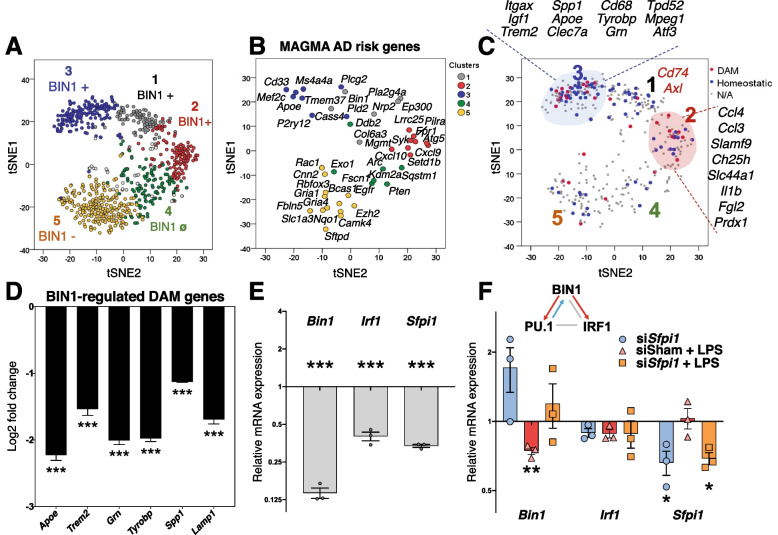
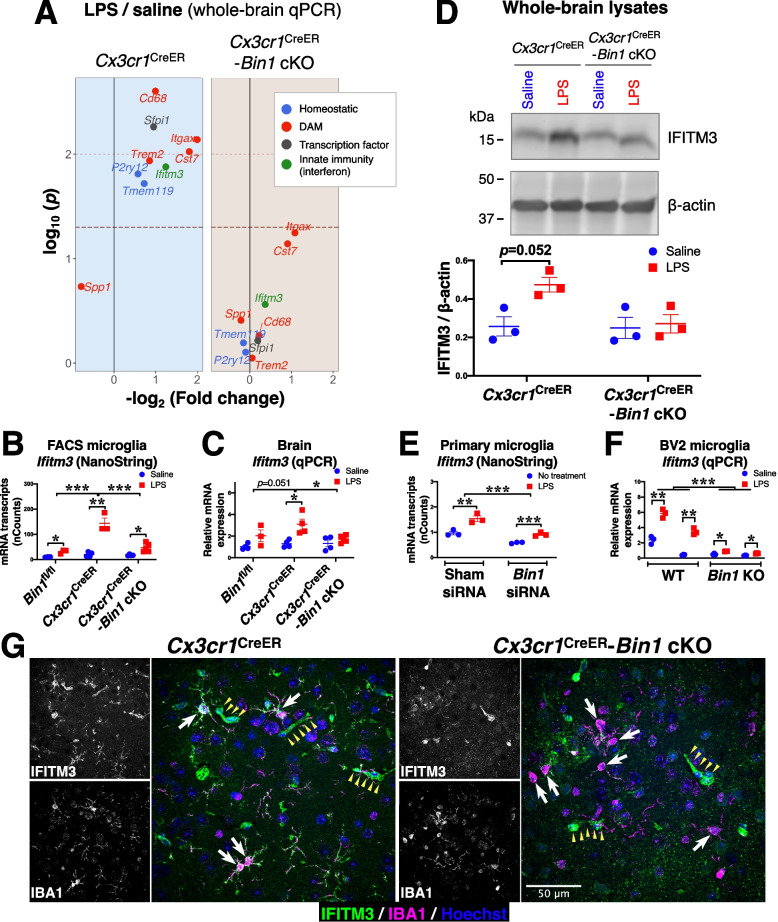
Results: Here, we characterized microglial BIN1 expression in vitro and in vivo and ascertained microglia expressed BIN1 isoforms. By silencing Bin1 expression in primary microglial cultures, we demonstrate that BIN1 regulates the activation of proinflammatory and disease-associated responses in microglia as measured by gene expression and cytokine production. Our transcriptomic profiling revealed key homeostatic and lipopolysaccharide (LPS)-induced inflammatory response pathways, as well as transcription factors PU.1 and IRF1 that are regulated by BIN1. Microglia-specific Bin1 conditional knockout in vivo revealed novel roles of BIN1 in regulating the expression of disease-associated genes while counteracting CX3CR1 signaling. The consensus from in vitro and in vivo findings showed that loss of Bin1 impaired the ability of microglia to mount type 1 interferon responses to proinflammatory challenge, particularly the upregulation of a critical type 1 immune response gene, Ifitm3.

Conclusions: Our convergent findings provide novel insights into microglial BIN1 function and demonstrate an essential role of microglial BIN1 in regulating brain inflammatory response and microglial phenotypic changes. Moreover, for the first time, our study shows a regulatory relationship between Bin1 and Ifitm3, two Alzheimer's disease-related genes in microglia. The requirement for BIN1 to regulate Ifitm3 upregulation during inflammation has important implications for inflammatory responses during the pathogenesis and progression of many neurodegenerative diseases.

Keywords: Alzheimer’s disease; BIN1; CX3CR1; GWAS risk factor; IFITM3; IRF1; IRF7; Innate immunity; LPS; Microglia; Neuroinflammation; PU.1.


Conflict of interest statement

The authors declare that they have no competing interests.

Figures

Fig. 1
Fig. 1
Characterization of BIN1 in the mouse brain and human iPSC-derived microglia. A Five μm-thick paraffin sections were stained with antibodies against BIN1 (green) and IBA1 (magenta). Images of the cortex and hippocampus from a WT animal show BIN1 expression in IBA1-positive microglia (top panel). By genetically ablating Bin1 expression from excitatory neurons and oligodendrocytes, microglial BIN1 expression is confirmed in Bin1 cKO mice (bottom panel). An asterisk indicates the expected unperturbed BIN1 expression in the thalamus beneath the dentate gyrus in the cKO brain [5]. B Line-scan analysis shows the concordance of BIN1 and IBA1 signal intensities in a subset of cells (in WT) and indicates the expression of BIN1 in IBA1+ microglia. The removal of BIN1 expression in excitatory neurons and oligodendrocytes demonstrates that the high-intensity profile of the microglial marker (IBA1) overlaps with that of BIN1, affirming microglial BIN1 expression. C Higher magnification images evidence BIN1 localization in the perinuclear regions of the microglial soma in Bin1 cKO and EmxCre littermates. Microglial BIN1 localization is readily apparent in the Bin1 cKO mouse brain, where BIN1 immunoreactivity could be seen permeating into cells’ ramifications (bottom panels). D Human post-mortem brain sections were stained with antibodies against BIN1 (green) and IBA1 (magenta). Overlapping morphological homogeneity of immunofluorescence unambiguously demonstrates BIN1 expression in human microglia. E Line-scan analysis exemplifies the overlapping expression of the two channels in D. Peaks in both channels represent microglial BIN1 expression. BIN1 only peaks reflect signals from oligodendrocyte cell bodies. The single isolated IBA1 peak suggests a lack of BIN1 expression in the nucleus of microglia. F Immunoblot analysis of BIN1 expression in whole-brain homogenates shows higher levels of BIN1 isoforms containing the CLAP domain (BIN1: H) and lower levels of BIN1:L isoforms. In contrast, FACS-isolated mouse microglia and human iPSC-derived iMG predominantly express BIN1 isoforms lacking the CLAP domain (BIN1: L). G RT-PCR analyses of FACS-isolated microglia demonstrate that exon 7 (left) and the CLAP domain (right) are excluded in the majority of microglial Bin1 transcripts. We detected no relative change in Bin1 isoforms following LPS administration (see Figs. S2A and S5H). An asterisk indicates a non-specific PCR product. H Microglial Bin1 isoforms generated by alternative splicing. Cloning and individual analysis of the PCR products allowed the Bin1 isoform frequency to be calculated. Approximately 90% of mouse microglial Bin1 transcripts code for isoform 10, with isoforms 9, 12, and 6 together, accounting for approximately 10% of Bin1 transcripts. Exon 7 (within the BAR domain), exon 11 (PI domain; see Fig. S3A), and exons 14-16 (within the CLAP domain) were not present in any microglial isoforms screened
Fig. 2
Fig. 2
Bin1 KD in primary microglia dysregulates proinflammatory and PU.1-dependent genes. A Bin1 siRNA transfection resulted in > 80% reduction in Bin1 transcripts, as confirmed by qRT-PCR. B PCA identified two PCs, which accounted for 71% of the variance in the dataset. PC1 captured the effect of Bin1 loss (42%), while PC3 captured the LPS effect (29%). The LPS effect shown by PC2 was blunted in the absence of Bin1. C Both PCs were increased by LPS stimulation. Bin1 KD caused a significant increase in PC1 in resting and LPS-stimulated microglia; Bin1 KD only decreased PC2 during LPS stimulation (* p < 0.05, **p < 0.01, ***p < 0.001, Dunn’s). D K-means clustering identified six gene clusters, of which five showed distinct patterns of expression based on in vitro manipulations. Cluster 1 was positively regulated by BIN1 in homeostasis, and LPS-stimulated up-regulation was BIN1-dependent. Cluster 2 was positively regulated by BIN1 during LPS stimulation, but its homeostatic regulation was not affected by BIN1. Cluster 3 was positively regulated by BIN1 (during homeostasis and LPS stimulation) but downregulated during LPS stimulation. Cluster 5 was negatively regulated by BIN1 and unaffected by LPS stimulation. Cluster 4 was not regulated by BIN1 but was upregulated during LPS stimulation (not shown in the figure). E Gene ontology enrichment analyses (GO, KEGG, Wikipathways included) identified key inflammatory and immune (clusters 1 & 2), homeostatic microglial (cluster 3), and non-microglial-specific (cluster 5) pathways affected by in vitro manipulation of primary microglial cultures. Predicted upstream transcriptional regulators for each cluster are shown, among which Sfpi1 (PU.1) was shared across clusters 1, 2, and 3
Fig. 3
Fig. 3
Genes affected by Bin1 KD in vitro are implicated in AD and regulation of microglial phenotypes. A Visualisation of in vitro microglial transcriptomic data using t-SNE shows gene clusters positively (clusters 1-3) or negatively regulated by BIN1 (cluster 5). See the heatmap in Fig. 2D for the cluster color reference. One cluster was unaffected by BIN1 expression (cluster 4). B MAGMA of AD-associated risk genes overlapped with our dataset, demonstrating crucial AD-related genes within each cluster that are regulated downstream of microglial BIN1. C Critical disease-associated (DAM shown in red) and homeostatic microglial genes (shown in blue) were dysregulated by Bin1 KD in primary microglia. DAM and homeostatic assignments were based on published literature [25]. D qRT-PCR validation confirmed that BIN1 positively regulates several key DAM genes, including Apoe, Trem2, and Tyrobp (i.e., down-regulated by Bin1 KD) (*p < 0.05, **p < 0.01, ***p < 0.001, two-tailed t-test comparing sham siRNA to Bin1 siRNA conditions, normalized to Gapdh, n = 3/condition). E Bin1 KD causes down-regulation of two master transcriptional regulators of microglial phenotypes – Irf1 and Sfpi1 (encoding PU.1). (F) The plot depicts the q-PCR analysis of the relative change in Bin1, Irf1, and Sfpi1 transcript abundance compared to the sham siRNA condition. siRNA KD of Sfpi1 demonstrates co-dependent regulation between BIN1 and PU.1
Fig. 4
Fig. 4
Functional analyses demonstrate BIN1 facilitates inflammation-induced cytokine production, as well as phagocytosis, in primary microglial cultures. A-B Bin1 siRNA treatment did not affect cytokine secretion in unchallenged microglial cultures. LPS exposure increased secretion, which was attenuated by the KD of Bin1. C-D Flow cytometric analysis of the fluorescent microsphere phagocytosis found that Bin1 reduction impeded the phagocytic capacity of primary microglia, both unchallenged and following LPS stimulation. E Phagocytosis of fibrillar Aβ42 was unaffected by Bin1 silencing. *, p < 0.05; **, p < 0.01; ***, p < 0.001; by post-hoc t-test with Bonferroni correction for multiple comparisons. Phagocytosis data plotted as mean ± SEM
Fig. 5
Fig. 5
In vivo deletion of Bin1 affects surface CD11c expression. A Experimental strategy for in vivo experiments involved three groups of mice: Bin1fl/fl (WT equivalent), Cx3cr1CreER (primary reference group), and Cx3cr1CreER-Bin1 cKO (experimental group). Mice were injected with tamoxifen for 5 consecutive days, then rested for four weeks to allow replenishment of Bin1 expression in peripheral monocytes. Mice then received saline or LPS for four consecutive days, and brains were harvested for flow cytometry / FACS, IHC, and cytokine assays, 24 h after the final injection. B Immunofluorescence staining in the piriform cortex demonstrates BIN1 expression in microglia (yellow arrows), oligodendrocytes (asterisks), and synapses (unlabelled) in mice with normal BIN1 expression (Cx3cr1CreER). Bin1 was deleted from the microglia of experimental mice (Cx3cr1CreER-Bin1 cKO), whilst oligodendrocytes and synaptic BIN1 were unaffected. C Mouse brain cells were labelled with APC-Cy7 α-CD11b, PE-Cy7 α-CD45, and BV421 α-CD11c. Single, mononuclear, live cells were gated, and microglia were sorted as CD11b+CD45INT population. D A representative flow cytometric image of each experimental group is depicted. E Flow cytometric analysis demonstrates that LPS administration in vivo caused an increase in the proportion of cells with high surface CD11c expression in all genotypes. The LPS effect was augmented by Cx3cr1 haploinsufficiency (Cx3cr1CreER); this additional increase was blunted by microglial Bin1 deletion (Cx3cr1CreER-Bin1 cKO). Two-way ANOVA found main effects for genotype (F2,17 = 32.98, p < 0.001) and LPS (F1,17 = 100.9, p < 0.001). There was a significant genotype*LPS interaction (F2,17 = 16.87, p < 0.001). F NanoString mRNA counts show that LPS increased Itgax transcript numbers (F1,16 = 27.014, p < 0.001). No differences between genotypes (F2,16 = 3.065, p = 0.075) and no genotype*LPS interactions (F2,16 = 1.052, p = 0.372) were found. Bin1 deletion did not attenuate Itgax transcript numbers. G NanoString analysis of mRNA from sorted microglia demonstrates that our cKO system resulted in approximately 50% decrease in microglial Bin1 expression (F2,17 = 13.14, p < 0.001), which was not affected by LPS (F2,17 = 0.712, p = 0.505), despite the main effect for LPS increasing Bin1 transcripts (F1,17 = 5.853, p = 0.027). Analysis of Cx3cr1 transcript numbers found a main effect for genotype (F2,17 = 43.802, p < 0.001), with post-hoc differences between Bin1fl/fl with Cx3cr1CreER (p < 0.001), Bin1fl/fl with Cx3cr1CreER-Bin1 cKO (p < 0.001), and Cx3cr1CreER with Cx3cr1CreER-Bin1 cKO (p = 0.043) demonstrating that the reduction in Cx3cr1 expression in the Cre line was partially attenuated by Bin1 deletion. No main effect for LPS treatment (F1,17 = 0.303, p = 0.589) and no genotype*LPS interaction (F2,17 = 0.515, p = 0.606) were found. All by two-way ANOVA. *, p < 0.05; **, p < 0.01; ***, p < 0.001; by post-hoc t-test with Bonferroni correction for multiple comparisons. All data plotted as mean ± SEM
Fig. 6
Fig. 6
In vivo microglia-specific loss of Bin1 dampens the proinflammatory microglial response. A PCA of gene expression data from FACS-purified mouse brain microglia from in vivo Bin1 cKO studies identified two PCs which accounted for 42% of the variance in the data. B PC1 (effect of LPS regardless of genotype) explained 29.9% of the variance, whilst PC2 (LPS effect impacted by genotype) explained 12.4% of the variance and exemplified the pattern of Bin1 cKO mitigating dysregulation by Cx3cr1 haploinsufficiency. C K-means clustering identified five clusters of genes affected in our dataset. Cluster 1 genes were upregulated during LPS stimulation, dependant on BIN1. Cluster 2 was upregulated by LPS stimulation and positively regulated by BIN1 (downregulated by Bin1 cKO). Cluster 3 was upregulated by LPS independent of BIN1. Cluster 4 was downregulated by LPS and positively regulated by BIN1 in unstimulated conditions. Cluster 5 genes were negatively regulated by BIN1, counter to CX3CR1. D Gene ontology enrichment analysis identified interferon-response pathways regulated by cluster 1 genes. E Thirteen microglial genes were suppressed by BIN1 (upregulated by Bin1 cKO) independent of LPS inflammation, including homeostatic genes P2ry12, Tmem119, and Tgfbr1. F Pathway analysis suggests STAT1 signaling may regulate expression of cluster 1 genes (nature of the interaction between genes is shown based on color scheme shown in the key.) G Analysis of microglia numbers found no main effects for genotype (F2,21 = 2.614, p = 0.097), LPS treatment (F1,21 = 0.002, p = 0.966), or no genotype*LPS interaction (F2,21 = 1.192, p = 0.323) (by two-way ANOVA). Phagocytic capacity was not affected by LPS (F1,21 = 1.939, p = 0.178) or genotype (F2,21 = 0.121, p = 0.887) in Bin1 cKO studies, and no genotype*LPS interactions was found (F2,21 = 0.101, p = 0.904) (by two-way ANOVA). Data plotted as mean ± SEM. For associated physiological data and immunohistochemistry data, see Fig. S5B-F
Fig. 7
Fig. 7
Concordance analysis between in vitro and in vivo NanoString datasets reveals a common pattern of microglial gene regulation by BIN1. A The Venn diagrams illustrate the overlapping DEGs in the in vitro and in vivo datasets under basal and LPS-stimulated conditions. B PCA demonstrates two principal components account for 37% of the variance in the combined dataset. C The PCA results show the similarities and differences between the in vitro and in vivo systems. D Whereas low concordance between in vitro and in vivo datasets was visualised from unstimulated microglia, LPS-stimulated cells showed higher concordance in gene expression between our model systems. E-F Gene ontology analysis of genes concordantly regulated in the in vitro and in vivo datasets found interferon- and membrane-related pathways to be regulated by BIN1
Fig. 8
Fig. 8
LPS-induced up-regulation of IFITM3 in microglia is dependent on BIN1. A qRT-PCR analysis of whole-brain cDNA found inflammation-induced upregulation of key homeostatic and DAM genes are dependent on BIN1. Upregulation of a crucial myeloid transcription factor (Sfpi1), as well as an interferon-induced innate immune gene (Ifitm3), were also BIN1-dependent. Raw dataset is provided in Fig. S8. B NanoString analysis of transcripts in FACS-isolated microglia demonstrates an up-regulation of Ifitm3 following in vivo LPS injections. This effect is augmented in Cx3cr1CreER microglia and is dependent on BIN1. Main effects were found for genotype (F2,16 = 26.538, p < 0.001) and LPS treatment (F1,16 = 66.105, p < 0.001), and a significant genotype*LPS interaction was found (F2,16 = 20.609, p < 0.001) (by two-way ANOVA). Post-hoc pairwise comparisons found Cx3cr1CreER to be different from both Bin1fl/fl (p < 0.001) and Cx3cr1CreER-Bin1 cKO (p < 0.001) (with Fisher’s LSD applied). C qRT-PCR analysis of whole-brain transcripts validated the pattern of microglial expression. A main effect for LPS treatment was found (F1,18 = 17.497, p < 0.001), but the effect for genotype (F2,18 = 3.189, p = 0.065) and the genotype*LPS interaction (F2,18 = 2.734, p = 0.092) failed to reach significance (by two-way ANOVA). Despite this, post-hoc pairwise comparisons found Cx3cr1CreER to be different from Cx3cr1CreER-Bin1 cKO (p = 0.036). However, the comparison with Bin1fl/fl genotype failed to reach significance (p = 0.051) (with Fisher’s LSD applied). D Immunoblot analysis of whole-brain lysates confirmed the transcriptional regulation results in similar IFITM3 protein level changes. Whilst a main effect for LPS treatment was found (F1,8 = 6.156, p = 0.038), genotype (F1,8 = 4.788, p = 0.06) and the genotype*LPS interaction (F1,8 = 4.126, p = 0.077) failed to reach significance in our data (by two-way ANOVA). E NanoString analysis of transcripts in primary cultured microglia shows Ifitm3 expression is blunted in Bin1 KD cells. Main effects for siRNA treatment (F1,8 = 53.326, p < 0.001) and LPS (F1,8 = 43.226, p < 0.001) were found. There was no siRNA*LPS interaction (F1,8 = 3.137, p = 0.115). F CRISPR-edited BIN1 BV2 KO microglia validate that Ifitm3 upregulation in response to LPS stimulation is impaired in Bin1 KO cells, with main effects for Bin1 (F1,20 = 44.503, p < 0.001) and LPS (F1,20 = 23.945, p < 0.001), and a significant Bin1*LPS interaction (F1,20 = 16.023, p < 0.001). G Immunofluorescence detection of IFITM3 in mouse brain demonstrates that IFITM3 expression throughout the LPS-treated Cx3cr1CreER microglia but not in Cx3cr1CreER-Bin1 cKO. Note that microglia are indicated by white arrows, and IFITM3 labelling of blood vessels is indicated by small yellow arrowheads. *, p < 0.05; **, p < 0.01; ***, p < 0.001; by post-hoc t-test with Bonferroni correction for multiple comparisons. All data plotted as mean ± SEM

References

    1. Seshadri S, Fitzpatrick AL, Ikram MA, DeStefano AL, Gudnason V, Boada M, Bis JC, Smith AV, Carassquillo MM, Lambert JC, et al. Genome-wide analysis of genetic loci associated with Alzheimer disease. Jama. 2010;303:1832–1840. - PMC - PubMed
    1. Naj AC, Jun G, Beecham GW, Wang LS, Vardarajan BN, Buros J, Gallins PJ, Buxbaum JD, Jarvik GP, Crane PK, et al. Common variants at MS4A4/MS4A6E, CD2AP, CD33 and EPHA1 are associated with late-onset Alzheimer's disease. Nat Genet. 2011;43:436–441. - PMC - PubMed
    1. Lee JH, Cheng R, Barral S, Reitz C, Medrano M, Lantigua R, Jimenez-Velazquez IZ, Rogaeva E, St George-Hyslop PH, Mayeux R. Identification of novel loci for Alzheimer disease and replication of CLU, PICALM, and BIN1 in Caribbean Hispanic individuals. Arch Neurol. 2011;68:320–328. - PMC - PubMed
    1. Prokic I, Cowling BS, Laporte J. Amphiphysin 2 (BIN1) in physiology and diseases. J Mol Med. 2014;92:453–463. - PubMed
    1. De Rossi P, Nomura T, Andrew RJ, Masse NY, Sampathkumar V, Musial TF, Sudwarts A, Recupero AJ, Le Metayer T, Hansen MT, et al. Neuronal BIN1 regulates presynaptic neurotransmitter release and memory consolidation. Cell Rep. 2020;30(3520-3535):e3527. - PMC - PubMed

Publication types