. 2022 May 7;13(1):186.
doi: 10.1186/s13287-022-02857-5.

Intrarenal arterial administration of human umbilical cord-derived mesenchymal stem cells effectively preserved the residual renal function of diabetic kidney disease in rat

Affiliations

Intrarenal arterial administration of human umbilical cord-derived mesenchymal stem cells effectively preserved the residual renal function of diabetic kidney disease in rat

Ya Yue et al. Stem Cell Res Ther. .

Abstract

Background: This experimental study was designed as a preclinical study for testing the hypothesis that intrarenal arterial (IRA) transfusion of human umbilical cord-derived mesenchymal stem cells (HUCDMSCs) therapy preserved the residual renal function of diabetic kidney disease (DKD) in rat [induction by 5/6 nephrectomy of left kidney and right nephrectomy, followed by intraperitoneal administration of aminoguanidine (180 mg/kg) and streptozotocin (30 mg/kg)].

Methods: Animals (n = 24) were categorized into group 1 (sham-operated control), group 2 (DKD), group 3 [DKD + HUCDMSCs (2.1 × 10⁵/IRA injection at day 28 after CKD induction)] and group 4 [(DKD + HUCDMSCs (6.3 × 10⁵/IRA injection)].

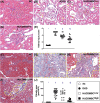
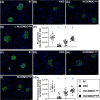
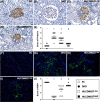
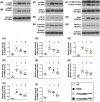
Results: By day 60 after DKD induction, the kidneys were harvested and the result showed that the creatinine level, ratio of urine protein/urine creatinine and kidney injury score were lowest in group 1, highest in group 2 and significantly lower in group 4 than in group 3 (all p < 0.0001). The protein expressions of apoptotic (cleaved caspase-3/cleaved PARP/mitochondrial Bax), fibrotic (TGF-ß/p-Smad3), autophagic (ratio of LC3B-II/LC3B-I, Atg5/Beclin-1), oxidative stress (NOX-1/NOX-2/oxidized protein/p22phox), mitochondrial/DNA-damaged (cytosolic-cytochrome-C/DRP1/γ-H2AX) and inflammatory (MMP-9/TNF-α/p-NF-κB) biomarkers exhibited an identical pattern, whereas the protein expressions of angiogenesis factors (CD31/vWF/vascularity) exhibited an opposite pattern of creatinine level among the groups (all p < 0.0001). Histopathological findings demonstrated the renal tubular-damaged (KIM-1)/kidney fibrosis area/oxidative stress (8-OHdG + cells) expressed an identical pattern, whereas the podocyte components (ZO-1/synaptopodin/podocin) exhibited an opposite pattern of creatinine level among the groups (all p < 0.0001). No tumorigenesis or immune rejection event was identified.

Conclusion: IRA injection of xenogeneic MSCs was safe and effectively protected the residual renal function and architectural integrity in DKD rat.

Keywords: Diabetic CKD; Renal function; Xenogeneic mesenchymal stem cell.


Conflict of interest statement

All authors have read the journal’s policy on disclosure of potential conflicts of interest and the journal’s authorship agreement. The authors declare that they have no conflicts of interest. The article has been reviewed and approved by all named authors.

Figures
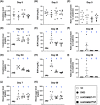
Fig. 1
Fig. 1
Time courses of circulating levels of BUN and creatinine and the ratio of urine protein to urine creatinine. A By day 0, circulating level of creatinine, p > 0.5. B By day 0, circulating level of blood urea nitrogen (BUN), p > 0.5. C By day 0, the ratio of urine protein to urine creatinine (Ra-Up/Uc), p > 0.5. D By day 28, circulating level of creatinine, * versus other groups with different symbols (†, ‡), p < 0.001. E By day 28, circulating level of BUN, * versus other groups with different symbols (†, ‡), p < 0.001. F By day 28, the Ra-Up/Uc, * versus other groups with different symbols (†, ‡), p < 0.001. G By day 60, the circulating level of creatinine, * versus other groups with different symbols (†, ‡, §), p < 0.0001. H By day 60, circulating level of BUN, * versus other groups with different symbols (†, ‡, §), p < 0.0001. I By day 60, the Ra-Up/Uc, * versus other groups with different symbols (†, ‡, §), p < 0.0001. J By day 7, the blood sugar level (SC vs. all DKD), * versus †, p < 0.0001. K By day 60, the blood sugar level (SC vs. all DKD), * versus †, p < 0.001. All statistical analyses were performed by one-way ANOVA, followed by Bonferroni multiple comparison post hoc test (n = 6 for each group). Symbols (*, †, ‡, §) indicate significance (at 0.05 level). SC = sham-operated control; DKD = diabetic kidney disease; HUCDMSCLow = human umbilical cord-derived mesenchymal stem cell of lower dose (2.1 × 105 cells); HUCDMSCHigh = human umbilical cord-derived mesenchymal stem cell of higher dose (6.3 × 105 cells)
Fig. 2
Fig. 2
Quantitative assessment of the kidney injury score and fibrotic area in kidney parenchyma by day 60 after DKD induction. AD Microscopic examination (200x; H&E stain) demonstrating significantly higher loss of brush border in renal tubules (yellow arrows), tubular necrosis (green arrows), tubular dilatation (red asterisk), protein cast formation (black asterisk) and dilatation of Bowman’s capsule (blue arrows) in DKD group than in other groups. E Analytical result of kidney injury score, * versus other groups with different symbols (†, ‡, §), p < 0.0001. FI Demonstrating the microscopic finding [(200x) for identification of fibrotic area (blue color) (red dotted lines)]. J Analytical result of fibrotic area, * versus other groups with different symbols (†, ‡, §), p < 0.0001. All statistical analyses were performed by one-way ANOVA, followed by Bonferroni multiple comparison post hoc test (n = 6 for each group). Symbols (*, †, ‡, §) indicate significance (at 0.05 level). SC = sham-operated control; DKD = diabetic kidney disease; HUCDMSCLow = human umbilical cord-derived mesenchymal stem cell of lower dose (2.1 × 105 cells); HUCDMSCHigh = human umbilical cord-derived mesenchymal stem cell of higher dose (6.3 × 105 cells)
Fig. 3
Fig. 3
HUCDMSCs therapy preserved the podocyte components of glomerulus by day 60 after DKD induction. AD The immunofluorescent (IF) microscopic finding (200x) for identification of fluorescent intensity of zonula occludens-1 (ZO-1) (green color). E Analytical result of mean fluorescent intensity ZO-1, * versus other groups with different symbols (†, ‡, §), p < 0.0001. Scale bar in right lower corner represents 50 µm. FI The IF microscopic finding (200x) for identification of fluorescent intensity of synaptopodin (green color). J Analytical result of mean fluorescent intensity of synaptopodin, * versus other groups with different symbols (†, ‡, §), p < 0.0001. Scale bar in right lower corner represents 20 µm. All statistical analyses were performed by one-way ANOVA, followed by Bonferroni multiple comparison post hoc test (n = 6 for each group). Symbols (*, †, ‡, §) indicate significance (at 0.05 level). SC = sham-operated control; DKD = diabetic kidney disease; HUCDMSCLow = human umbilical cord-derived mesenchymal stem cell of lower dose (2.1 × 105 cells); HUCDMSCHigh = human umbilical cord-derived mesenchymal stem cell of higher dose (6.3 × 105 cells)
Fig. 4
Fig. 4
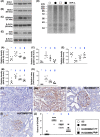
HUCDMSCs therapy preserved the integrity of component of slip diaphragm in glomeruli and attenuated the renal tubular injury marker by day 60 after DKD induction. AD The microscopic finding (400x) of immunohistochemical (IHC) stain for the identification of cellular expression of podocin (gray color). E Analytical result of expression of podocin, * versus other groups with different symbols (†, ‡, §), p < 0.0001. FI Showing the IF microscopic finding (400x) for the identification of kidney injury molecule (KIM)-1 (green color). J Analytical result of expression of KIM-1, * versus other groups with different symbols (†, ‡, §), p < 0.0001. Scale bar in right lower corner represents 20 µm. All statistical analyses were performed by one-way ANOVA, followed by Bonferroni multiple comparison post hoc test (n = 6 for each group). Symbols (*, †, ‡, §) indicate significance (at 0.05 level). SC = sham-operated control; DKD = diabetic kidney disease; HUCDMSCLow = human umbilical cord-derived mesenchymal stem cell of lower dose (2.1 × 105 cells); HUCDMSCHigh = human umbilical cord-derived mesenchymal stem cell of higher dose (6.3 × 105 cells)
Fig. 5
Fig. 5
HUCDMSCs therapy suppressed apoptotic, fibrotic and autophagic biomarkers in kidney parenchyma by day 60 after DKD induction. A Protein expression of cleaved caspase-3 (c-Csp3), * versus other groups with different symbols (†, ‡, §), p < 0.0001. B Protein expression of cleaved poly (ADP-ribose) polymerase (c-PARP), * versus other groups with different symbols (†, ‡, §), p < 0.0001. C Protein expression of mitochondrial Bax (mit-Bax), * versus other groups with different symbols (†, ‡, §), p < 0.0001. D Protein expression of transforming growth factor (TGF)-ß, * versus other groups with different symbols (†, ‡, §), p < 0.0001. E Protein expression of phosphorylated (p)-Smad3, * versus other groups with different symbols (†, ‡, §), p < 0.0001. F Protein expression of the ratio of LC3B-II to LC3B-I, * versus other groups with different symbols (†, ‡, §), p < 0.0001. G Protein expression of Atg5, * versus other groups with different symbols (†, ‡, §), p < 0.0001. H Protein expression of beclin-1, * versus other groups with different symbols (†, ‡, §), p < 0.0001. All statistical analyses were performed by one-way ANOVA, followed by Bonferroni multiple comparison post hoc test (n = 6 for each group). Symbols (*, †, ‡, §) indicate significance (at 0.05 level). SC = sham-operated control; DKD = diabetic kidney disease; HUCDMSCLow = human umbilical cord-derived mesenchymal stem cell of lower dose (2.1 × 105 cells); HUCDMSCHigh = human umbilical cord-derived mesenchymal stem cell of higher dose (6.3 × 105 cells)
Fig. 6
Fig. 6
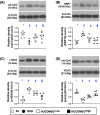
HUCDMSCs therapy reduced oxidative stress markers in kidney parenchyma by day 60 after DKD induction. A Protein expression of NOX-1, * versus other groups with different symbols (†, ‡, §), p < 0.0001. B Protein expression of NOX-2, * versus other groups with different symbols (†, ‡, §), p < 0.0001. C Protein expression of p22phox, * versus other groups with different symbols (†, ‡, §), p < 0.0001. D The oxidized protein expression, * versus other groups with different symbols (†, ‡, §), p < 0.0001, p < 0.0001 (Note: the left and right lanes shown on the upper panel represent protein molecular weight marker and control oxidized molecular protein standard, respectively). M.W. = molecular weight; DNP = 1–3 dinitrophenylhydrazone. E Protein expression of superoxide dismutase (SOD), * versus other groups with different symbols (†, ‡, §), p < 0.0001, p < 0.0001. FI The microscopic finding (200x) for identification of cellular expression of 8-hydroxy-2' -deoxyguanosine (8-OHdG) (gray color). J Analytical result of expression of 8-OHdG, * versus other groups with different symbols (†, ‡, §), p < 0.0001. All statistical analyses were performed by one-way ANOVA, followed by Bonferroni multiple comparison post hoc test (n = 6 for each group). Symbols (*, †, ‡, §) indicate significance (at 0.05 level). SC = sham-operated control; DKD = diabetic kidney disease; HUCDMSCLow = human umbilical cord-derived mesenchymal stem cell of lower dose (2.1 × 105 cells); HUCDMSCHigh = human umbilical cord-derived mesenchymal stem cell of higher dose (6.3 × 105 cells)
Fig. 7
Fig. 7
HUCDMSCs therapy reduced mitochondrial and DNA-damaged biomarkers in kidney parenchyma by day 60 after DKD induction. A Protein expression of cytosolic cytochrome C (cyt-CytC), * versus other groups with different symbols (†, ‡, §), p < 0.0001. B Protein expression of DRP1, * versus other groups with different symbols (†, ‡, §), p < 0.0001. C Protein expression of γ-H2AX, * versus other groups with different symbols (†, ‡, §), p < 0.0001. D Protein expression of mitochondrial cytochrome C (mit-CytC), * versus other groups with different symbols (†, ‡, §), p < 0.0001. All statistical analyses were performed by one-way ANOVA, followed by Bonferroni multiple comparison post hoc test (n = 6 for each group). Symbols (*, †, ‡, §) indicate significance (at 0.05 level). SC = sham-operated control; DKD = diabetic kidney disease; HUCDMSCLow = human umbilical cord-derived mesenchymal stem cell of lower dose (2.1 × 105 cells); HUCDMSCHigh = human umbilical cord-derived mesenchymal stem cell of higher dose (6.3 × 105 cells)
Fig. 8
Fig. 8
HUCDMSCs therapy suppressed inflammation and augmented angiogenesis factors in kidney parenchyma by day 60 after DKD induction. A Protein expression of matrix metalloproteinase (MMP)-9, * versus other groups with different symbols (†, ‡), p < 0.0001. B Protein expression of tumor necrosis factor (TNF)-α, * versus other groups with different symbols (†, ‡), p < 0.0001. C Protein expression of phosphorylated nuclear factor (p-NF)-κB, * versus other groups with different symbols (†, ‡, §), p < 0.0001. D Protein expression of vascular endothelial growth factor (VEGF), * versus other groups with different symbols (†, ‡, §), p < 0.0001. E Protein expression of von Willebrand factor (vWF), * versus other groups with different symbols (†, ‡), p < 0.0001. F Protein expression of CD31, * versus other groups with different symbols (†, ‡), p < 0.0001. All statistical analyses were performed by one-way ANOVA, followed by Bonferroni multiple comparison post hoc test (n = 6 for each group). Symbols (*, †, ‡, §) indicate significance (at 0.05 level). SC = sham-operated control; DKD = diabetic kidney disease; HUCDMSCLow = human umbilical cord-derived mesenchymal stem cell of lower dose (2.1 × 105 cells); HUCDMSCHigh = human umbilical cord-derived mesenchymal stem cell of higher dose (6.3 × 105 cells)
Fig. 9
Fig. 9
HUCDMSCs therapy enhanced the expressions of small vessel density in kidney parenchyma by day 60 after DKD induction. AD Microscopic finding (100x) of alpha-smooth muscle actin (α-SMA) stain for identification of small vessels (gray color) in kidney parenchyma. E Analytic results of number of small vessel (≤ 25 μm), * versus other groups with different symbols (†, ‡, §), p < 0.0001. Scale bars in right lower corner represent 100 µm. All statistical analyses were performed by one-way ANOVA, followed by Bonferroni multiple comparison post hoc test (n = 6 for each group). Symbols (*, †, ‡, §) indicate significance (at 0.05 level). SC = sham-operated control; DKD = diabetic kidney disease; HUCDMSCLow = human umbilical cord-derived mesenchymal stem cell of lower dose (2.1 × 105 cells); HUCDMSCHigh = human umbilical cord-derived mesenchymal stem cell of higher dose (6.3 × 105 cells)
Fig. 10
Fig. 10
Schematic of the time courses of the DKD induction and treatment procedure as well as identification of the HUCDMSCs in the kidney parenchyma. A the DKD induction time points and the time interval of HUCDMSCs intrarenal arterial injection. B Abundant HUCDMSCs (yellow arrows) were still clearly identified in the kidney parenchyma by day 14 after intrarenal arterial cell transfusion. Note that the red color of the HUCDMSCs was clearly observed under the immunofluorescent (IF) microscopic finding (400x, scale bar over the right lower corner = 20 μM) due to the fact that these cells were stained by Qtracker™. DKD = diabetic kidney disease; HUCDMSCs = human umbilical cord-derived mesenchymal stem cells; AG = aminoguanidine; STZ = streptozotocin

Similar articles

Cited by

References

    1. Aranson NJ, Lancaster RT, Ergul EA, Conrad MF, LaMuraglia GM, Kwolek CJ, Cambria RP, Patel VI. Chronic kidney disease class predicts mortality after abdominal aortic aneurysm repair in propensity-matched cohorts from the medicare population. Ann Surg. 2016;264:386–391. doi: 10.1097/SLA.0000000000001519. - DOI - PubMed
    1. Chang YT, Hwang JS, Hung SY, Tsai MS, Wu JL, Sung JM, Wang JD. Cost-effectiveness of hemodialysis and peritoneal dialysis: a national cohort study with 14 years follow-up and matched for comorbidities and propensity score. Sci Rep. 2016;6:30266. doi: 10.1038/srep30266. - DOI - PMC - PubMed
    1. Go AS, Chertow GM, Fan D, McCulloch CE, Hsu CY. Chronic kidney disease and the risks of death, cardiovascular events, and hospitalization. N Engl J Med. 2004;351:1296–1305. doi: 10.1056/NEJMoa041031. - DOI - PubMed
    1. Metra M, Nodari S, Parrinello G, Bordonali T, Bugatti S, Danesi R, Fontanella B, Lombardi C, Milani P, Verzura G, Cotter G, Dittrich H, Massie BM, Dei Cas L. Worsening renal function in patients hospitalised for acute heart failure: clinical implications and prognostic significance. Eur J Heart Fail. 2008;10:188–195. doi: 10.1016/j.ejheart.2008.01.011. - DOI - PubMed
    1. Cowie MR, Komajda M, Murray-Thomas T, Underwood J, Ticho B, Investigators P. Prevalence and impact of worsening renal function in patients hospitalized with decompensated heart failure: results of the prospective outcomes study in heart failure (POSH) Eur Heart J. 2006;27:1216–1222. doi: 10.1093/eurheartj/ehi859. - DOI - PubMed