. 2022 May 7;17(1):22.
doi: 10.1186/s40793-022-00417-1.

Long-term patterns of an interconnected core marine microbiota

Affiliations

Long-term patterns of an interconnected core marine microbiota

Anders K Krabberød et al. Environ Microbiome. .

Abstract

Background: Ocean microbes constitute ~ 70% of the marine biomass, are responsible for ~ 50% of the Earth's primary production and are crucial for global biogeochemical cycles. Marine microbiotas include core taxa that are usually key for ecosystem function. Despite their importance, core marine microbes are relatively unknown, which reflects the lack of consensus on how to identify them. So far, most core microbiotas have been defined based on species occurrence and abundance. Yet, species interactions are also important to identify core microbes, as communities include interacting species. Here, we investigate interconnected bacteria and small protists of the core pelagic microbiota populating a long-term marine-coastal observatory in the Mediterranean Sea over a decade.

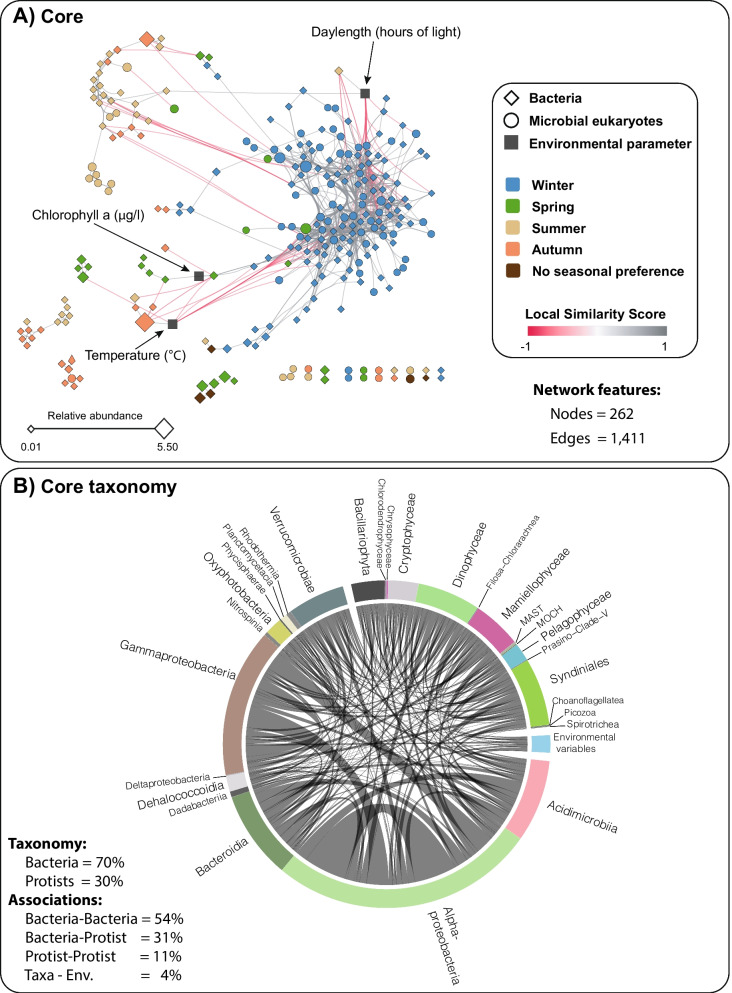
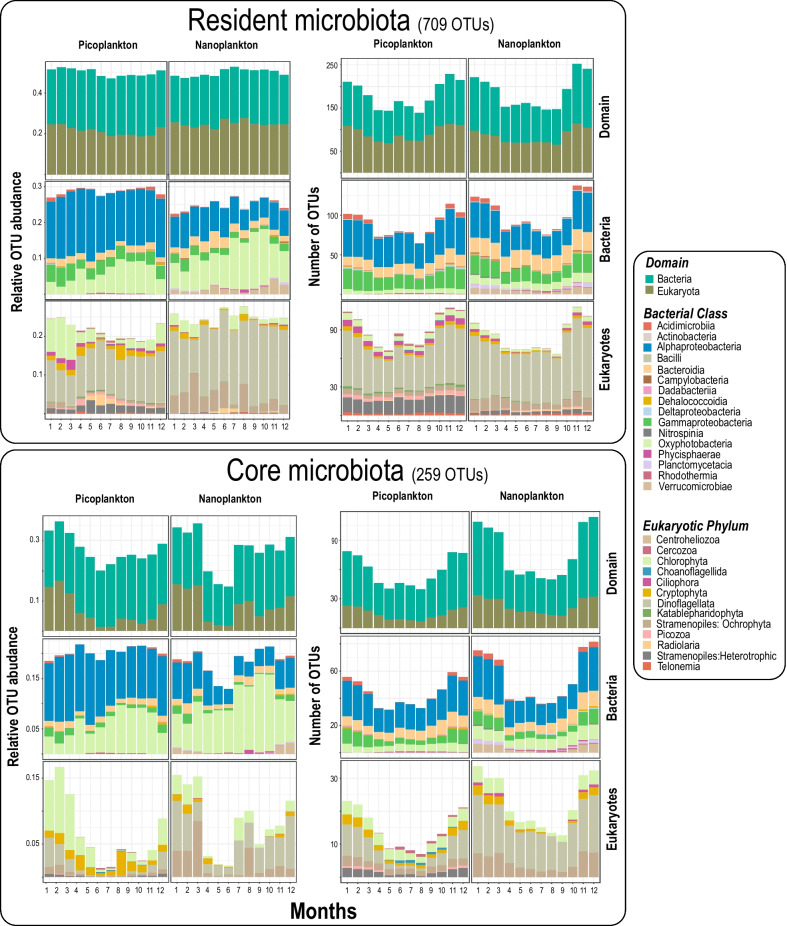
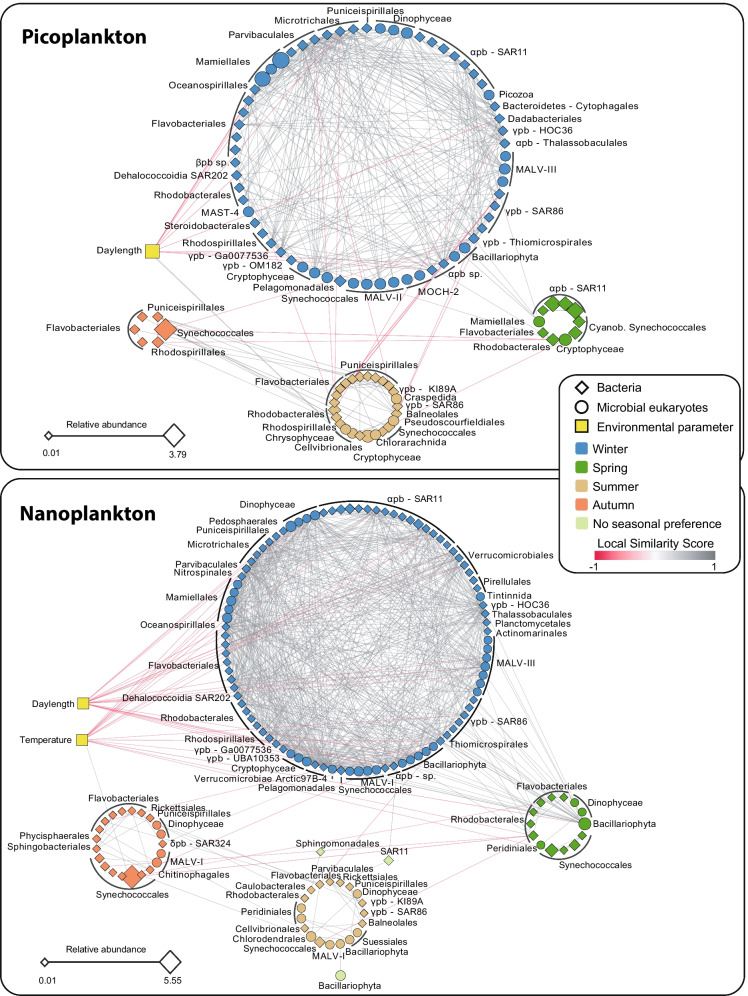
Results: Core microbes were defined as those present in > 30% of the monthly samples over 10 years, with the strongest associations. The core microbiota included 259 Operational Taxonomic Units (OTUs) including 182 bacteria, 77 protists, and 1411 strong and mostly positive (~ 95%) associations. Core bacteria tended to be associated with other bacteria, while core protists tended to be associated with bacteria. The richness and abundance of core OTUs varied annually, decreasing in stratified warmers waters and increasing in colder mixed waters. Most core OTUs had a preference for one season, mostly winter, which featured subnetworks with the highest connectivity. Groups of highly associated taxa tended to include protists and bacteria with predominance in the same season, particularly winter. A group of 13 highly-connected hub-OTUs, with potentially important ecological roles dominated in winter and spring. Similarly, 18 connector OTUs with a low degree but high centrality were mostly associated with summer or autumn and may represent transitions between seasonal communities.

Conclusions: We found a relatively small and dynamic interconnected core microbiota in a model temperate marine-coastal site, with potential interactions being more deterministic in winter than in other seasons. These core microbes would be essential for the functioning of this ecosystem over the year. Other non-core taxa may also carry out important functions but would be redundant and non-essential. Our work contributes to the understanding of the dynamics and potential interactions of core microbes possibly sustaining ocean ecosystem function.

Keywords: Associations; Bacteria; Networks; Ocean; Protists; Seasonality; Time-series.


Conflict of interest statement

The authors declare that they have no competing interests.

Figures

Fig. 1
Fig. 1
The Blanes Bay Microbial Observatory and the variation of its resident microbiota and measured environmental variables over ten years. A Location of the Blanes Bay Microbial Observatory. B All possible correlations between the measured environmental variables including the richness and abundance of resident OTUs (NB: only 709 resident OTUs are considered, see Table 1). Only significant Pearson correlation coefficients are shown (p < 0.01). The p values were corrected for multiple inference (Holm's method). C Unconstrained ordination (NMDS based on Bray Curtis dissimilarities) of communities including resident OTUs only, to which environmental variables were fitted. Only variables with a significant fit are shown (p < 0.05). Arrows indicate the direction of the gradient, and their length represents the strength of the correlation between resident OTUs and a particular environmental variable. The color of the samples (circles) indicates the season to which they belong. The bottom-left arrow indicates the direction of the seasonal change. PNF = photosynthetic nanoflagellates. D Constrained ordination (Distance-based redundancy analyses, dbRDA, using Bray Curtis dissimilarities) including only the most relevant variables after stepwise model selection using permutation tests. Each axis (i.e., dbRDA1 and dbRDA2) indicates the amount of variance it explains according to the associated eigenvalues (both dbRDA1 and dbRDA2 are significant [p < 0.01]). The color of the samples (circles) indicates the season to which they belong. Arrows indicate the direction of the gradient, and their length represents the strength of the correlation between resident OTUs and a particular environmental variable. The bottom-left arrow indicates the direction of the seasonal change. E, F Resident OTUs displaying different niche preferences (blueish areas) in terms of the two most important abiotic variables: Temperature (E) and Daylength (F). The red dots indicate the randomization mean, and the orange curves represent the confidence limits. Black dots indicate individual OTUs for which temperature or daylength preferences are significantly (p < 0.05) higher or lower than a random distribution over 10 years. At least two assemblages with different niches become evident: one preferring higher temperature and longer days (summer/spring), and another one preferring lower temperature and shorter days (winter/autumn). Note that several OTUs associated with Spring or Autumn are not expected to be detected with this approach, as their preferred temperature or daylength may not differ significantly from the randomized mean
Fig. 2
Fig. 2
Core microbiota resulting from 10 years of monthly pico- and nanoplankton relative abundances. A Core network including bacteria and microbial eukaryotic OTUs that occur ≥ 30% of the time during the studied decade (i.e., resident microbiota), with highly significant and strong associations (adjusted p < 0.001, absolute Local Similarity score |LS| > 0.7, Spearman correlation |ρ| > 0.7), where detected environmentally-driven edges were removed. The color of the edges (links) indicates whether the association is positive (grey) or negative (red). The shape of nodes indicates bacteria (rhomboid) or microbial eukaryotes (circle), and the color of nodes represents species' seasonal preferences, determined using the indicator value (indval, p < 0.05). Node size indicates OTU relative abundance. B Core network as a Circos plot, indicating the high-rank taxonomy of the core OTUs. Since 95% of the associations are positive (see Table 2), we do not indicate whether an edge is positive or negative
Fig. 3
Fig. 3
The monthly variation in the resident and core microbiotas over 10 years. Upper panels: The resident microbiota is defined as those eukaryotes and bacteria that occur in at least 30% of the samples over 10 years. The relative OTU abundance (left panel) and number of OTUs (right panel) for different domains and taxonomic levels in the resident microbiota are shown. Note that the relative abundance of Bacteria vs. Eukaryotes does not necessarily reflect organismal abundances on the sampling site, but the amplicon relative abundance after PCR. Relative abundances were calculated for each year and aggregated over the corresponding months along the 10 years for the resident microbiota, then split into size fractions (NB: relative abundance for both domains and size fraction sums up to 1 for each month across ten years, see methods for details). Lower panels: Core microbiota over 10 years. The relative abundances of core OTUs reflect the remaining proportions after removing all the OTUs that were not strongly associated when building networks. Relative OTU abundance (left panel) and number of OTUs (right panel) for different domains and taxonomic levels among the core OTUs
Fig. 4
Fig. 4
Pico- and nanoplankton core sub-networks. The shape of the nodes indicates bacteria (rhomboid) or microbial eukaryotes (circle), and the color of nodes represents species' seasonal preferences, determined using the indicator value (p < 0.05). The color of the edges indicates if the association is positive (grey) or negative (red). Node size indicates OTU relative abundance from the core microbiota
Fig. 5
Fig. 5
Main modules in the core network. Modules with MCODE score > 4 are shown for picoplankton (upper panel) and nanoplankton (lower panel). For each module, the MCODE score and relative amplicon abundance of the taxa included in it (as % of the resident microbiota) are indicated. In addition, the numbers of edges and OTUs within the modules are shown as edges/OTUs; this quotient estimates the average number of edges per OTU within the different modules. The edges represent correlations with |LS| > 0.7, |ρ| > 0.7 and adjusted p < 0.001. The color of the edges indicates positive (grey) or negative (red) associations. The shape of nodes indicates bacteria (rhomboid) or microbial eukaryotes (circle), and the color of nodes represents species' seasonal preferences, determined using the indicator value (p < 0.05). pb = Proteobacteria

References

    1. Gitay H, Wilson JB, Lee WG. Species redundancy: a redundant concept? J Ecol. 1996;84(1):121–124. doi: 10.2307/2261706. - DOI
    1. Louca S, Parfrey LW, Doebeli M. Decoupling function and taxonomy in the global ocean microbiome. Science. 2016;353:1272–1277. doi: 10.1126/science.aaf4507. - DOI - PubMed
    1. Galand PE, Pereira O, Hochart C, Auguet JC, Debroas D. A strong link between marine microbial community composition and function challenges the idea of functional redundancy. ISME J. 2018;12(10):2470–2478. doi: 10.1038/s41396-018-0158-1. - DOI - PMC - PubMed
    1. Shade A, Handelsman J. Beyond the Venn diagram: the hunt for a core microbiome. Environ Microbiol. 2012;14(1):4–12. doi: 10.1111/j.1462-2920.2011.02585.x. - DOI - PubMed
    1. Little AEF, Robinson CJ, Peterson SB, Raffa KF, Handelsman J. Rules of engagement: interspecies interactions that regulate microbial communities. Annu Rev Microbiol. 2008;62(1):375–401. doi: 10.1146/annurev.micro.030608.101423. - DOI - PubMed

LinkOut - more resources