. 2022 Sep;88(3):1039-1054.
doi: 10.1002/mrm.29266. Epub 2022 May 8.

Development of specialized magnetic resonance acquisition techniques for human hyperpolarized [13 C,15 N2 ]urea + [1-13 C]pyruvate simultaneous perfusion and metabolic imaging

Affiliations

Development of specialized magnetic resonance acquisition techniques for human hyperpolarized [13 C,15 N2 ]urea + [1-13 C]pyruvate simultaneous perfusion and metabolic imaging

Xiaoxi Liu et al. Magn Reson Med. 2022 Sep.

Abstract

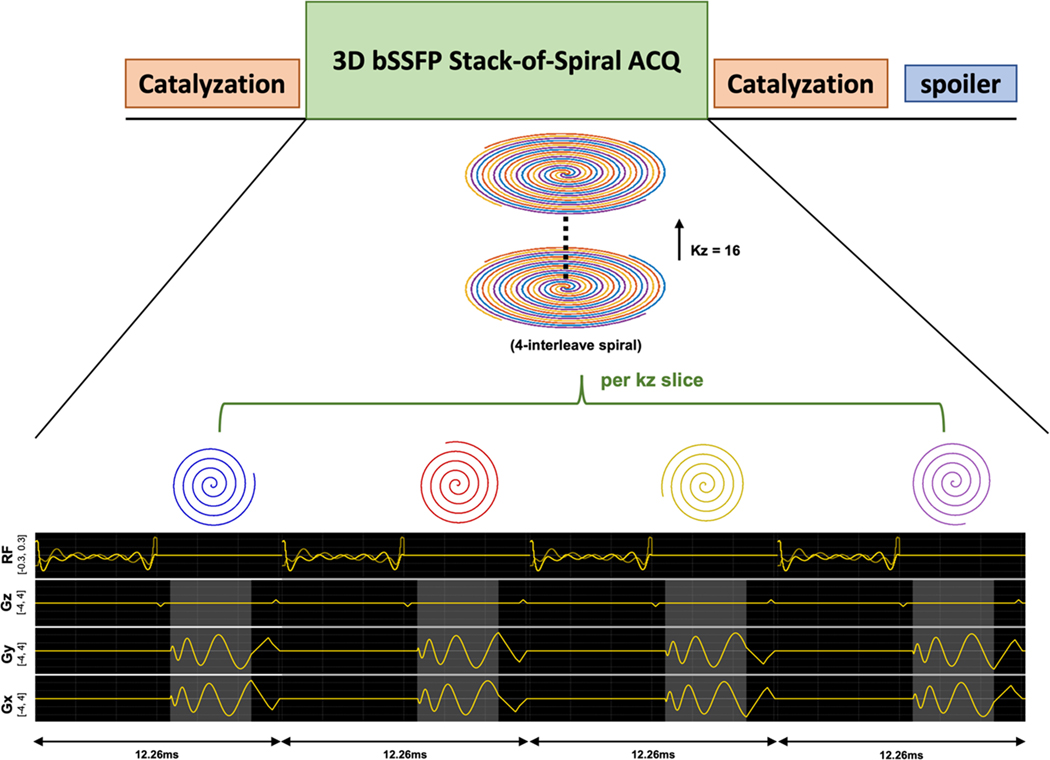
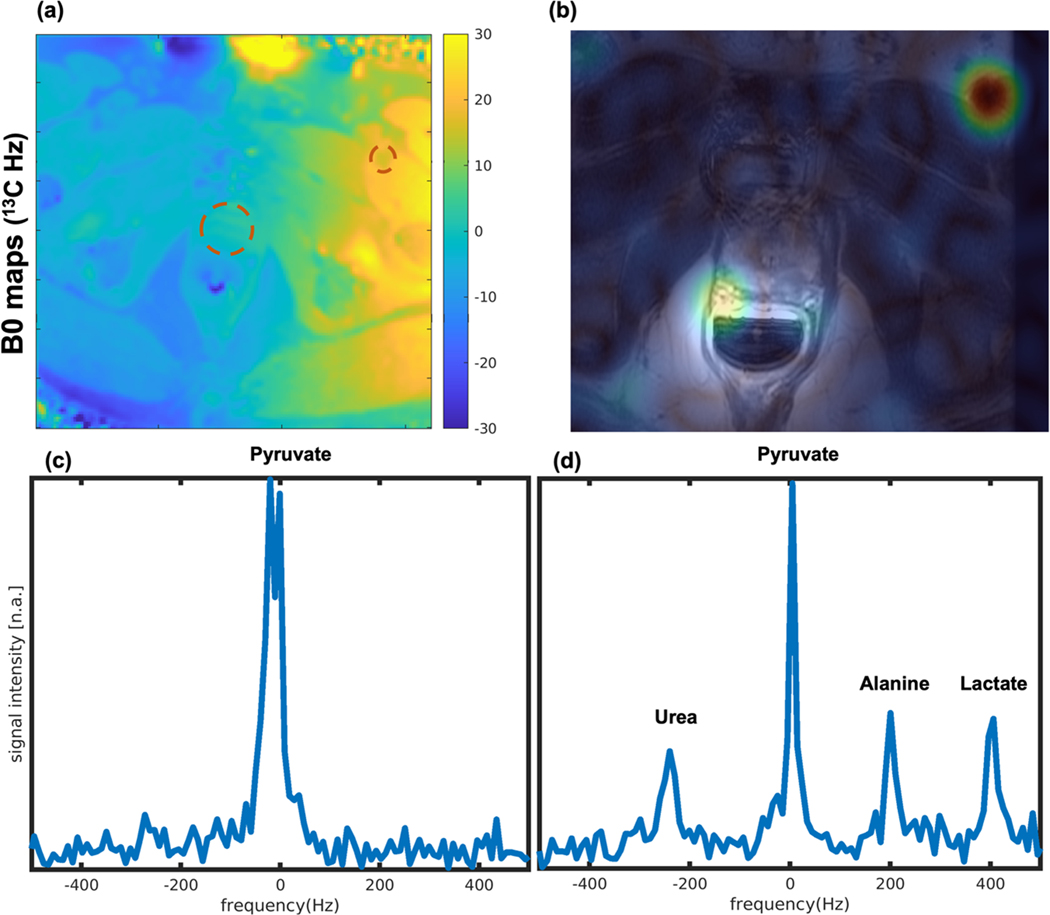
Purpose: This study aimed to develop and demonstrate the in vivo feasibility of a 3D stack-of-spiral balanced steady-state free precession(3D-bSSFP) urea sequence, interleaved with a metabolite-specific gradient echo (GRE) sequence for pyruvate and metabolic products, for improving the SNR and spatial resolution of the first hyperpolarized 13 C-MRI human study with injection of co-hyperpolarized [1-13 C]pyruvate and [13 C,15 N2 ]urea.

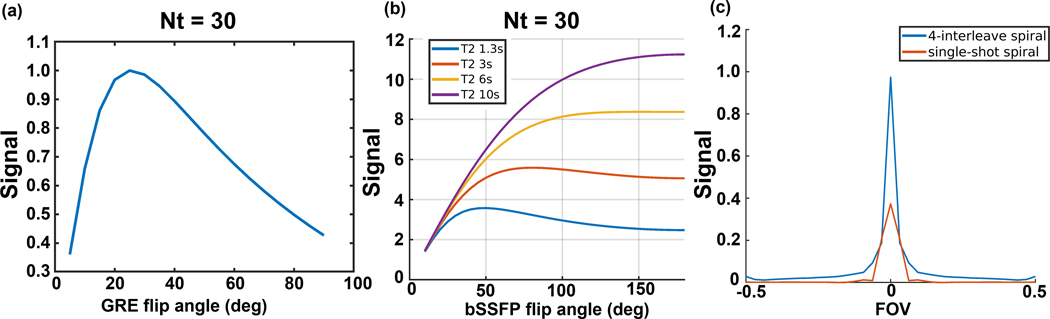
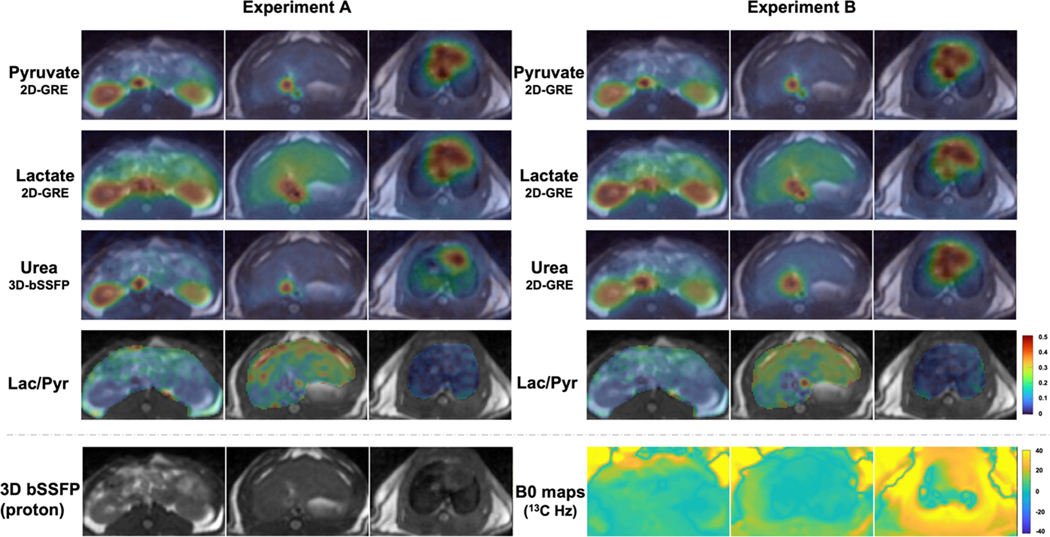
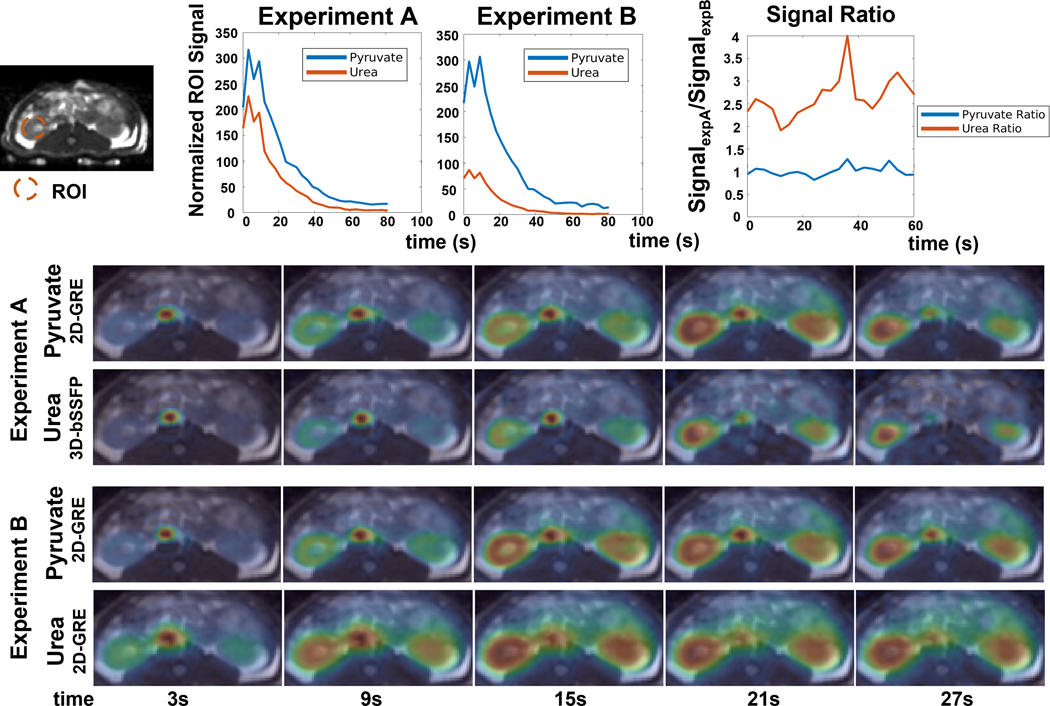
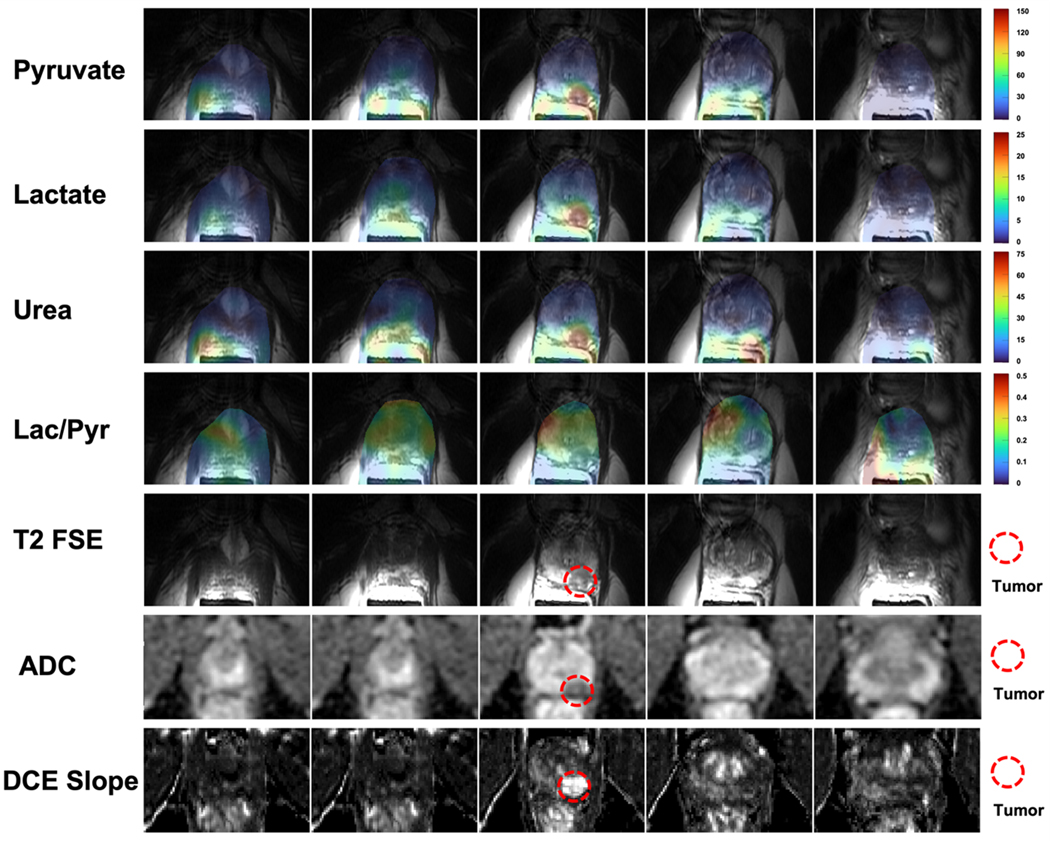
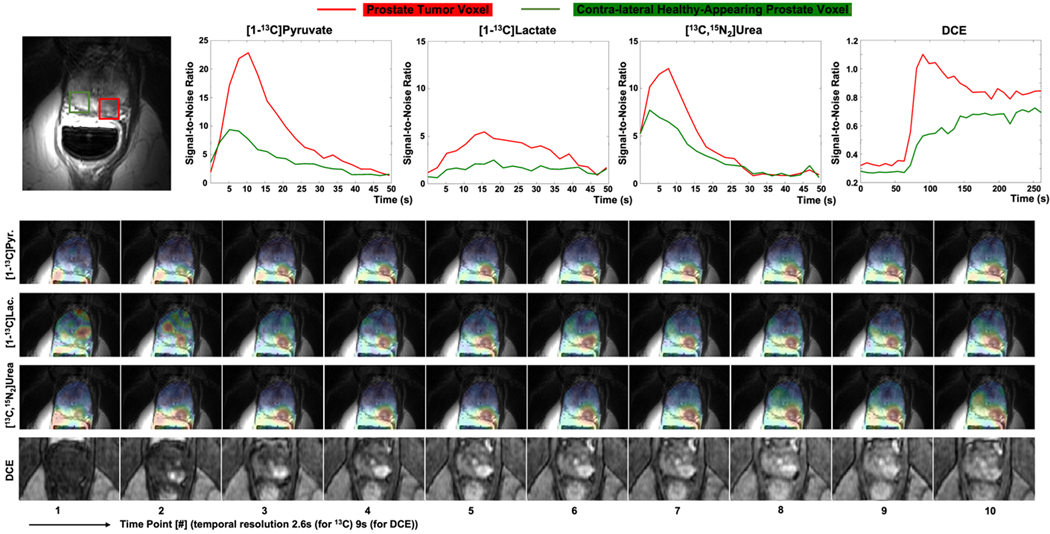
Methods: A metabolite-specific bSSFP urea imaging sequence was designed using a urea-specific excitation pulse, optimized TR, and 3D stack-of-spiral readouts. Simulations and phantom studies were performed to validate the spectral response of the sequence. The image quality of urea data acquired by the 3D-bSSFP sequence and the 2D-GRE sequence was evaluated with 2 identical injections of co-hyperpolarized [1-13 C]pyruvate and [13 C,15 N2 ]urea formula in a rat. Subsequently, the feasibility of the acquisition strategy was validated in a prostate cancer patient.

Results: Simulations and phantom studies demonstrated that 3D-bSSFP sequence achieved urea-only excitation, while minimally perturbing other metabolites (<1%). An animal study demonstrated that compared to GRE, bSSFP sequence provided an ∼2.5-fold improvement in SNR without perturbing urea or pyruvate kinetics, and bSSFP approach with a shorter spiral readout reduced blurring artifacts caused by J-coupling of [13 C,15 N2 ]urea. The human study demonstrated the in vivo feasibility and data quality of the acquisition strategy.

Conclusion: The 3D-bSSFP urea sequence with a stack-of-spiral acquisition demonstrated significantly increased SNR and image quality for [13 C,15 N2 ]urea in co-hyperpolarized [1-13 C]pyruvate and [13 C,15 N2 ]urea imaging studies. This work lays the foundation for future human studies to achieve high-quality and high-SNR metabolism and perfusion images.

Keywords: 13C hyperpolarization; bSSFP; human clinical study; metabolism imaging; perfusion imaging; urea.


Figures

FIGURE 1
FIGURE 1
The proposed 3D urea bSSFP sequence consists of catalyzation, 3D-bSSFP stack-of-spiral acquisition (urea-selective RF excitation pulse and stack-of-spiral readout), and spoiler gradients. The stack-of-spiral readout has 16 slices per stack, and each slice has 4 interleaves. The highlighted grey region denotes the spiral readout duration (4ms).
FIGURE 2
FIGURE 2
The corresponding excitation profiles of metabolite-specific bSSFP urea sequence and urea phantom results. (a) Bloch simulation of the excitation profile for the RF pulse alone; (b) Zoomed views (±40Hz) of excitation profiles at each metabolite frequency. The excitation pulse has a 6ms duration, 60Hz passband on urea (0Hz), 40Hz stopband with 0.4% ripples on pyruvate (240Hz) frequency, 0.45% ripples on alanine (425Hz), pyruvate hydrate (507Hz), and lactate (635Hz) frequencies. (c) The simulated excitation profile (red line) including the RF pulse and bSSFP sequence using the averaged magnetization of 64 pulses. The vertical green dot lines show the frequency locations of banding artifacts. (d) Zoomed views (±40Hz) of excitation profiles at each metabolite frequency. (e) 13C urea phantom images. The grey circles and arrows show the location of the urea phantom. The normalized signals of urea phantom measurements are indicated pointed by the blue cross points. The experimental results showed excellent agreement with simulation.
FIGURE 3
FIGURE 3
(a&b) Simulations of GRE and bSSFP urea AUC signal with 30 timepoints and a 3s temporal resolution. (c) Simulated PSFs of a 4-interleave spiral readout as used in the bSSFP sequence and single-shot spiral readout as used in the GRE sequence for [13C,15N2]urea with JCN splitting frequencies (±20Hz).
FIGURE 4
FIGURE 4
Comparison of the 3D-bSSFP urea sequence with a 2D-GRE sequence on a healthy Sprague Dawley rat: Experiment A (pyruvate/lactate 2D-GRE, urea 3D-bSSFP) and Experiment B (pyruvate/lactate/urea 2D-GRE) AUC images. Each AUC image is scaled by its own maximum signal to visualize metabolite distribution. Lactate-to-pyruvate AUC ratio images are displayed with the fixed scale range [0, 0.5]. The 3D-bSSFP urea sequence shows improved image quality compared to the MS-GRE sequence, with better delineation of the vasculature, kidneys and heart due to the shorter readout length ,21. The 2D-GRE sequence particularly suffers from more severe blurring artifacts in the heart than the 3D-bSSFP sequence where there is larger B0 inhomogeneity. Even when B0 inhomogeneity is small, the vessel signal acquired by 3D-bSSFP has a sharper edge in the kidneys and liver slices than data acquired by 2D-GRE because of the JCN coupling of [13C,15N2]urea.
FIGURE 5
FIGURE 5
Comparison of the 3D-bSSFP urea sequence with a 2D-GRE sequence with dynamic kidney images of a healthy Sprague Dawley rat. Experiment A (pyruvate/lactate 2D-GRE, urea 3D-bSSFP) and Experiment B (pyruvate/lactate/urea 2D-GRE) were described in the methods. Dynamic curves of pyruvate and urea signals and their signal ratios were measured on the ROI region in the kidney region. All signals have been normalized by the concentration measured by 13C NMR spectrometer of each injection and corresponding noise levels. The urea signal levels were further divided by a factor of 4 according to the concentration equivalence of probes to present in the plots. Each dynamic figure is displayed with an independent color scale. The 3D-bSSFP urea sequence shows an approximately 2.5X SNR improvement over the 2D-GRE urea sequence.
FIGURE 6
FIGURE 6
Co-hyperpolarized [1-13C]pyruvate and [13C,15N2]urea human imaging study. (a) B0 field map (scaled to 13C frequency), (b) pyruvate image acquired after frequency calibration, and (c&d) The 13C spectrum. The spectrum data before metabolite imaging acquisition in (c) has two [1-13C]pyruvate peaks with 20Hz difference. This can be explained by the B0 map in (a) that shows an off-resonance in the left superficial femoral vein region with 20Hz shift compared to the prostate region, and the initial pyruvate images in (b) showing signal near the prostate and the left superficial femoral vein. The spectrum data after metabolite imaging acquisition in the (d) shows frequency of urea to pyruvate is −244.6Hz, alanine to pyruvate is 195.7Hz, lactate to pyruvate is 401.1Hz, with single peaks for each metabolite due to localization to the prostate region.
FIGURE 7
FIGURE 7
AUC maps of pyruvate, lactate, and urea, and lactate-to-pyruvate ratio images in the prostate across 5 slices. The biopsy-confirmed prostate tumor showed hypointensity on T2-weighted images, restricted diffusion on DWI/ADC, and early arterial enhancement on DCE images. All images of each metabolite used the same display range. The lactate-to-pyruvate ratio images were measured by the division of lactate AUC images to pyruvate AUC images with flip angle compensation. These show good image quality with no apparent artifacts.
FIGURE 8
FIGURE 8
Dynamic prostate images with pyruvate, lactate and urea signals, in SNR units and extracted dynamic curves of DCE images. Each dynamic figure is displayed with the independent color scale. The tumor signal of both pyruvate and urea reaches peak at around 10.4s after acquisition. The signal peak of tumor voxel is approximately 2.5 times higher than the signal peak of the contralateral prostate voxel in urea data, which agrees with the signal peak shown in the DCE curve.

Similar articles

Cited by

References

    1. Hanahan D, Weinberg RA. Hallmarks of cancer: The next generation. Cell. 2011;144(5):646–674. doi:10.1016/j.cell.2011.02.013 - DOI - PubMed
    1. Hanahan D, Weinberg RA. The Hallmarks of Cancer Review Evolve Progressively from Normalcy via a Series of Pre. Vol 100.; 2000.
    1. Welch DR, Hurst DR. Defining the Hallmarks of Metastasis. Cancer Research. 2019;79(12):3011–3027. doi:10.1158/0008-5472.CAN-19-0458 - DOI - PMC - PubMed
    1. von Morze C, Larson PEZ, Hu S, et al. Investigating tumor perfusion and metabolism using multiple hyperpolarized 13C compounds: HP001, pyruvate and urea. Magnetic Resonance Imaging. 2012;30(3):305–311. doi:10.1016/j.mri.2011.09.026 - DOI - PMC - PubMed
    1. Wilson DM, Keshari KR, Larson PEZ, et al. Multi-compound polarization by DNP allows simultaneous assessment of multiple enzymatic activities in vivo. Journal of Magnetic Resonance. 2010;205(1):141–147. doi:10.1016/j.jmr.2010.04.012 - DOI - PMC - PubMed

Publication types