

In-plane and out-of-plane deformations of gilt utero-sacral ligaments
- PMID: 35526346
- PMCID: PMC11513578
- DOI: 10.1016/j.jmbbm.2022.105249
In-plane and out-of-plane deformations of gilt utero-sacral ligaments
Abstract
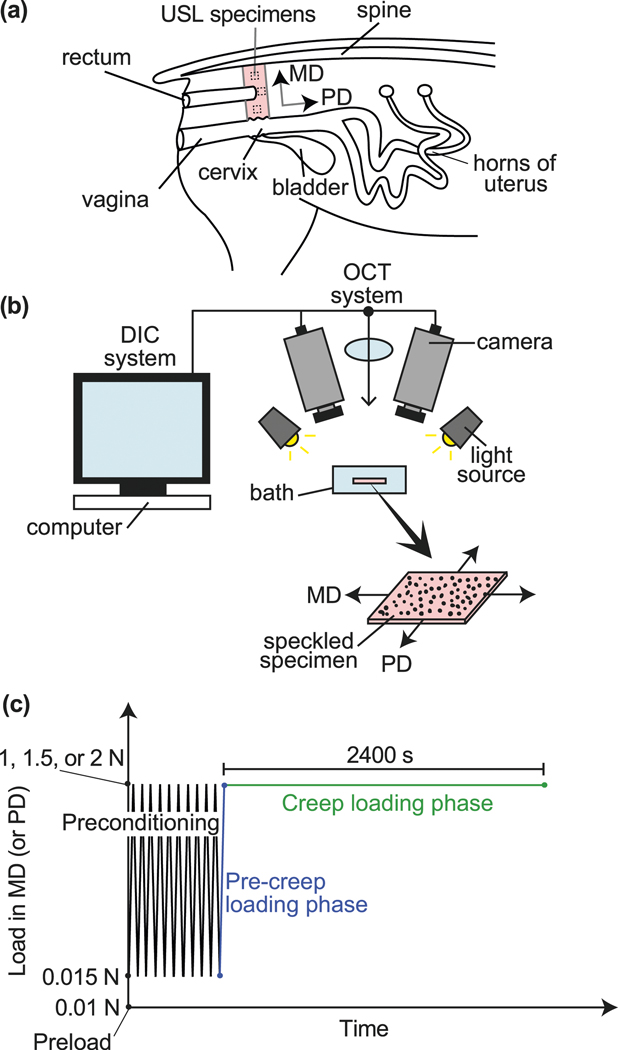
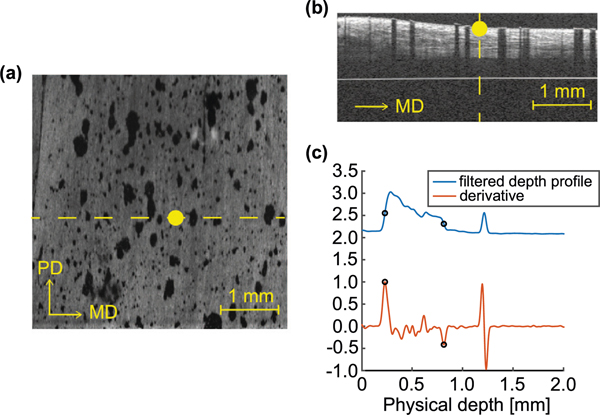
The uterosacral ligaments (USLs) are supportive structures of the uterus and apical vagina. The mechanical function of these ligaments within the pelvic floor is crucial not only in normal physiological conditions but also in reconstructive surgeries for pelvic organ prolapse. Discrepancies in their anatomical and histological description exist in the literature, but such discrepancies are likely due to large variations of these structures. This makes mechanical testing very challenging, requiring the development of advanced methods for characterizing their mechanical properties. This study proposes the use of planar biaxial testing, digital image correlation (DIC), and optical coherence tomography (OCT) to quantify the deformations of the USLs, both in-plane and out-of-plane. Using the gilts as an animal model, the USLs were found to deform significantly less in their main direction (MD) of in vivo loading than in the direction perpendicular to it (PD) at increasing equibiaxial stresses. Under constant equibiaxial loading, the USLs deform over time equally, at comparable rates in both the MD and PD. The thickness of the USLs decreases as the equibiaxial loading increases but, under constant equibiaxial loading, the thickness increases in some specimens and decreases in others. These findings could contribute to the design of new mesh materials that augment the support function of USLs as well as noninvasive diagnostic tools for evaluating the integrity of the USLs.
Keywords: Biaxial testing; Deformations; Digital image correlation; Optical coherence tomography; Pelvic floor support; Uterosacral ligaments.
Copyright © 2022 Elsevier Ltd. All rights reserved.
Conflict of interest statement
Declaration of competing interest
The authors declare the following financial interests/personal relationships which may be considered as potential competing interests: Raffaella De Vita reports financial support was provided by National Science Foundation.
Figures


Similar articles
-
Mechanical Analysis of the Uterosacral Ligament: Swine vs. Human.Ann Biomed Eng. 2018 Dec;46(12):2036-2047. doi: 10.1007/s10439-018-2103-x. Epub 2018 Jul 26. Ann Biomed Eng. 2018. PMID: 30051246 Free PMC article.
-
Effects of repeated biaxial loads on the creep properties of cardinal ligaments.J Mech Behav Biomed Mater. 2017 Oct;74:128-141. doi: 10.1016/j.jmbbm.2017.05.038. Epub 2017 May 31. J Mech Behav Biomed Mater. 2017. PMID: 28599153
-
Mechanics of Uterosacral Ligaments: Current Knowledge, Existing Gaps, and Future Directions.Ann Biomed Eng. 2021 Aug;49(8):1788-1804. doi: 10.1007/s10439-021-02755-6. Epub 2021 Mar 22. Ann Biomed Eng. 2021. PMID: 33754254 Review.
-
Biaxial mechanical properties of swine uterosacral and cardinal ligaments.Biomech Model Mechanobiol. 2015 Jun;14(3):549-60. doi: 10.1007/s10237-014-0621-5. Epub 2014 Sep 14. Biomech Model Mechanobiol. 2015. PMID: 25218641
-
Female pelvic floor biomechanics: bridging the gap.Curr Opin Urol. 2017 May;27(3):262-267. doi: 10.1097/MOU.0000000000000380. Curr Opin Urol. 2017. PMID: 28267057 Free PMC article. Review.
Cited by
-
Ex Vivo Uniaxial Tensile Properties of Rat Uterosacral Ligaments.Ann Biomed Eng. 2023 Apr;51(4):702-714. doi: 10.1007/s10439-023-03135-y. Epub 2023 Jan 18. Ann Biomed Eng. 2023. PMID: 36652028
References
-
- Baah-Dwomoh A, McGuire J, Tan T, De Vita R, 2016. Mechanical properties of female reproductive organs and supporting connective tissues: A review of the current state of knowledge. Appl. Mech. Rev. 68 (6).
-
- Barber MD, Maher C, 2013a. Apical prolapse. Int. Urogynecol. J. 24 (11), 1815–1833. - PubMed
-
- Barber MD, Maher C, 2013b. Epidemiology and outcome assessment of pelvic organ prolapse. Int. Urogynecol. J. 24 (11), 1783–1790. - PubMed
Publication types
MeSH terms
Grants and funding
LinkOut - more resources
Full Text Sources
Medical
