

Biological pathways and comparison with biopsy signals and cellular origin of peripheral blood transcriptomic profiles during kidney allograft pathology
- PMID: 35526671
- PMCID: PMC9231008
- DOI: 10.1016/j.kint.2022.03.026
Biological pathways and comparison with biopsy signals and cellular origin of peripheral blood transcriptomic profiles during kidney allograft pathology
Abstract
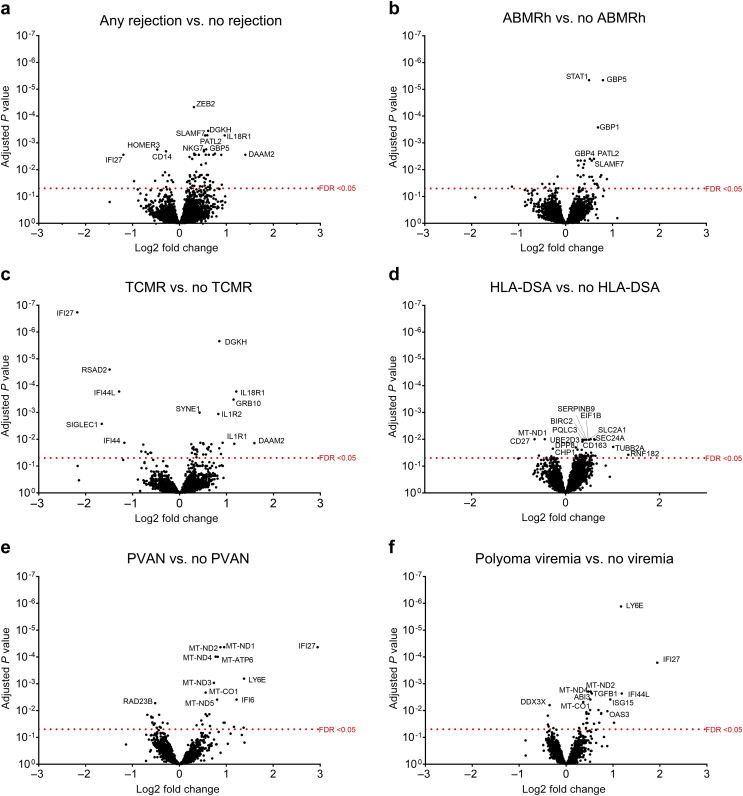
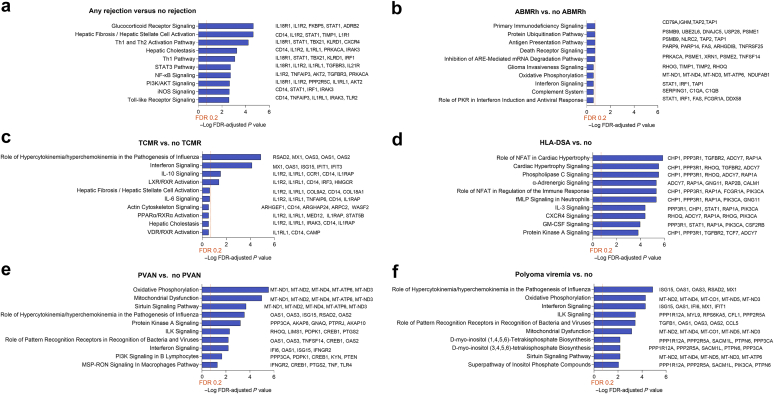
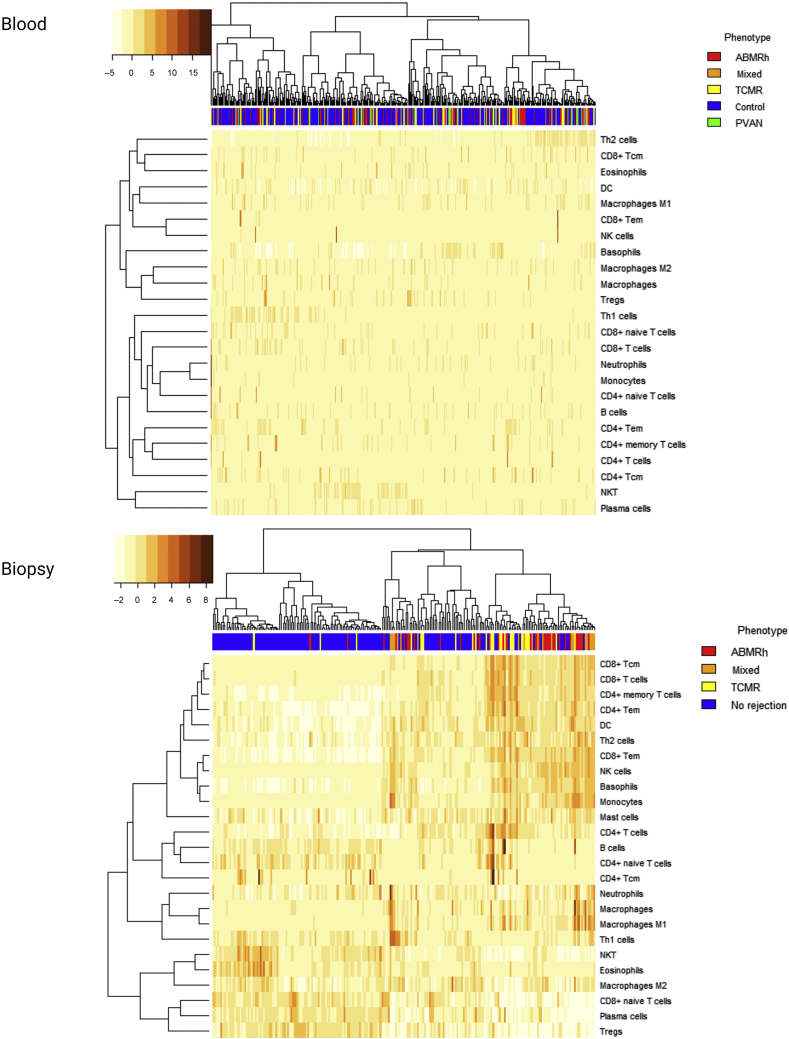
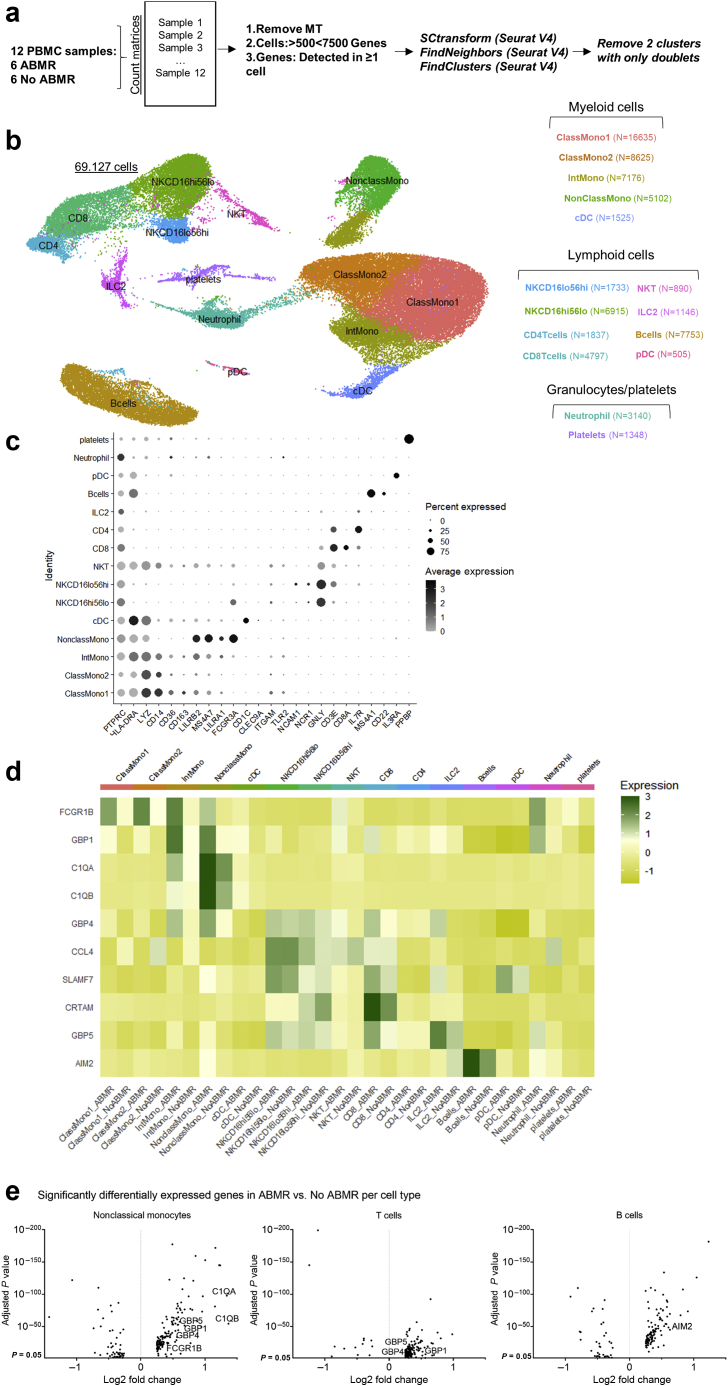
Kidney transplant injury processes are associated with molecular changes in kidney tissue, primarily related to immune cell activation and infiltration. How these processes are reflected in the circulating immune cells, whose activation is targeted by strong immunosuppressants, is poorly understood. To study this, we analyzed the molecular alterations in 384 peripheral blood samples from four European transplant centers, taken at the time of a kidney allograft biopsy, selected for their phenotype, using RNA-sequencing. In peripheral blood, differentially expressed genes in 136 rejection and 248 no rejection samples demonstrated upregulation of glucocorticoid receptor and nucleotide oligomerization domain-like receptor signaling pathways. Pathways enriched in antibody-mediated rejection (ABMR) were strongly immune-specific, whereas pathways enriched in T cell-mediated rejection were less immune related. In polyomavirus infection, upregulation of mitochondrial dysfunction and interferon signaling pathways was seen. Next, we integrated the blood results with transcriptomics of 224 kidney allograft biopsies which showed consistently upregulated genes per phenotype in both blood and biopsy. In single-cell RNASeq (scRNASeq) analysis of seven kidney allograft biopsies, the consistently overexpressed genes in ABMR were mostly expressed by infiltrating leukocytes in the allograft. Similarly, in peripheral blood scRNASeq analysis, these genes were overexpressed in ABMR in immune cell subtypes. Furthermore, overexpression of these genes in ABMR was confirmed in independent cohorts in blood and biopsy. Thus, our results highlight the immune activation pathways in peripheral blood leukocytes at the time of kidney allograft pathology, despite the use of current strong immunosuppressants, and provide a framework for future therapeutic interventions.
Keywords: BK virus; gene expression; immune cells; kidney transplantation rejection.
Copyright © 2022 International Society of Nephrology. Published by Elsevier Inc. All rights reserved.
Figures


Similar articles
-
Transcriptomic signatures of chronic active antibody-mediated rejection deciphered by RNA sequencing of human kidney allografts.Kidney Int. 2024 Feb;105(2):347-363. doi: 10.1016/j.kint.2023.11.012. Epub 2023 Nov 29. Kidney Int. 2024. PMID: 38040290 Free PMC article.
-
Transcriptional Changes in Kidney Allografts with Histology of Antibody-Mediated Rejection without Anti-HLA Donor-Specific Antibodies.J Am Soc Nephrol. 2020 Sep;31(9):2168-2183. doi: 10.1681/ASN.2020030306. Epub 2020 Jul 8. J Am Soc Nephrol. 2020. PMID: 32641395 Free PMC article.
-
Tissue miRNA Profile Is Associated with Acute Tubular Necrosis, Rejection Phenotypes and BK Polyomavirus-Associated Nephropathy in Human Kidney Allografts.Nephron. 2024;148(5):300-311. doi: 10.1159/000534072. Epub 2023 Oct 31. Nephron. 2024. PMID: 37906981
-
The Chronology of Renal Allograft Dysfunction: The Pathological Perspectives.Nephron. 2023;147 Suppl 1:67-73. doi: 10.1159/000531575. Epub 2023 Aug 11. Nephron. 2023. PMID: 37573772 Review.
-
Banff 2013 update: Pearls and pitfalls in transplant renal pathology.Nephrology (Carlton). 2015 Jul;20 Suppl 2:2-8. doi: 10.1111/nep.12474. Nephrology (Carlton). 2015. PMID: 26031578 Review.
Cited by
-
Single-cell mapping of leukocyte immunoglobulin-like receptors in kidney transplant rejection.Front Transplant. 2022 Aug 11;1:952785. doi: 10.3389/frtra.2022.952785. eCollection 2022. Front Transplant. 2022. PMID: 38994376 Free PMC article.
-
Oxidized ATP Suppresses B Lymphocyte Activity to Attenuate Antibody-mediated Rejection of Kidney Allografts in Mice.Transplantation. 2025 Jan 1;109(1):e11-e21. doi: 10.1097/TP.0000000000005118. Epub 2024 Dec 7. Transplantation. 2025. PMID: 38946027 Free PMC article.
-
Interferon-γ and its response are determinants of antibody-mediated rejection and clinical outcomes in patients after renal transplantation.Genes Immun. 2024 Feb;25(1):66-81. doi: 10.1038/s41435-024-00254-x. Epub 2024 Jan 22. Genes Immun. 2024. PMID: 38246974
-
Transforming kidney transplant monitoring with urine CXCL9 and CXCL10: practical clinical implementation.Sci Rep. 2024 Sep 2;14(1):20357. doi: 10.1038/s41598-024-70390-x. Sci Rep. 2024. PMID: 39223175 Free PMC article.
-
Multiple omics-based machine learning reveals peripheral blood immune cell landscape during acute rejection of kidney transplantation and constructs a precise non-invasive diagnostic strategy.Mamm Genome. 2025 Jul 7. doi: 10.1007/s00335-025-10149-5. Online ahead of print. Mamm Genome. 2025. PMID: 40624201
References
-
- Lamb K.E., Lodhi S., Meier-Kriesche H.U. Long-term renal allograft survival in the United States: a critical reappraisal. Am J Transplant. 2011;11:450–462. - PubMed
-
- Coemans M., Süsal C., Döhler B., et al. Analyses of the short- and long-term graft survival after kidney transplantation in Europe between 1986 and 2015. Kidney Int. 2018;94:964–973. - PubMed
-
- Van Loon E., Bernards J., Van Craenenbroeck A.H., Naesens M. The causes of kidney allograft failure: more than allo-immunity. A viewpoint paper. Transplantation. 2020;104:e46–e56. - PubMed
-
- Van Loon E., Senev A., Lerut E., et al. Assessing the complex causes of kidney allograft loss. Transplantation. 2020;104:2557–2566. - PubMed
-
- Stewart B.J., Ferdinand J.R., Clatworthy M.R. Using single-cell technologies to map the human immune system—implications for nephrology. Nat Rev Nephrol. 2020;16:112–128. - PubMed
Publication types
MeSH terms
Substances
LinkOut - more resources
Full Text Sources
Medical
Molecular Biology Databases
