

An optimal variant to gene distance window derived from an empirical definition of cis and trans protein QTLs
- PMID: 35527238
- PMCID: PMC9082853
- DOI: 10.1186/s12859-022-04706-x
An optimal variant to gene distance window derived from an empirical definition of cis and trans protein QTLs
Abstract
Background: A genome-wide association study (GWAS) correlates variation in the genotype with variation in the phenotype across a cohort, but the causal gene mediating that impact is often unclear. When the phenotype is protein abundance, a reasonable hypothesis is that the gene encoding that protein is the causal gene. However, as variants impacting protein levels can occur thousands or even millions of base pairs from the gene encoding the protein, it is unclear at what distance this simple hypothesis breaks down.
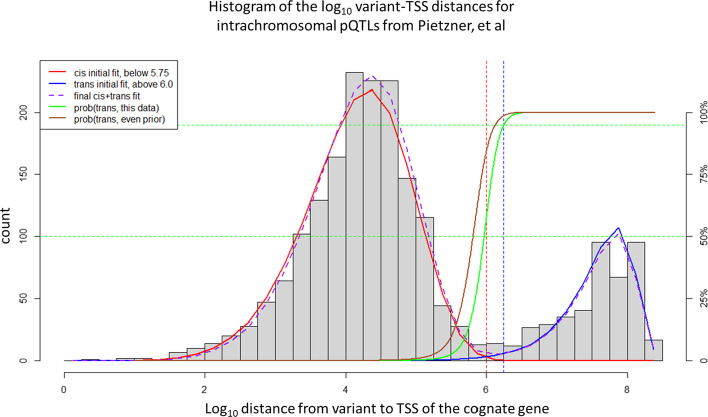
Results: By making the simple assumption that cis-pQTLs should be distance dependent while trans-pQTLs are distance independent, we arrive at a simple and empirical distance cutoff separating cis- and trans-pQTLs. Analyzing a recent large-scale pQTL study (Pietzner in Science 374:eabj1541, 2021) we arrive at an estimated distance cutoff of 944 kilobasepairs (95% confidence interval: 767-1,161) separating the cis and trans regimes.
Conclusions: We demonstrate that this simple model can be applied to other molecular GWAS traits. Since much of biology is built on molecular traits like protein, transcript and metabolite abundance, we posit that the mathematical models for cis and trans distance distributions derived here will also apply to more complex phenotypes and traits.
Keywords: Cis-eQTL; Cis-pQTL; GWAS; Trans-eQTL; Trans-pQTL; Weibull; eQTL; metQTL; pQTL.
© 2022. The Author(s).
Conflict of interest statement
The authors declare that they are full time employees of Pfizer, Inc.
Figures
Similar articles
-
Statistically and functionally fine-mapped blood eQTLs and pQTLs from 1,405 humans reveal distinct regulation patterns and disease relevance.Nat Genet. 2024 Oct;56(10):2054-2067. doi: 10.1038/s41588-024-01896-3. Epub 2024 Sep 24. Nat Genet. 2024. PMID: 39317738 Free PMC article.
-
Common Genetic Polymorphisms Influence Blood Biomarker Measurements in COPD.PLoS Genet. 2016 Aug 17;12(8):e1006011. doi: 10.1371/journal.pgen.1006011. eCollection 2016 Aug. PLoS Genet. 2016. PMID: 27532455 Free PMC article.
-
Mendelian randomization and genetic colocalization infer the effects of the multi-tissue proteome on 211 complex disease-related phenotypes.Genome Med. 2022 Dec 12;14(1):140. doi: 10.1186/s13073-022-01140-9. Genome Med. 2022. PMID: 36510323 Free PMC article.
-
Common variation in a long non-coding RNA gene modulates variation of circulating TGF-β2 levels in metastatic colorectal cancer patients (Alliance).BMC Genomics. 2024 May 14;25(1):473. doi: 10.1186/s12864-024-10354-7. BMC Genomics. 2024. PMID: 38745123 Free PMC article.
-
Expression Quantitative Trait Loci Information Improves Predictive Modeling of Disease Relevance of Non-Coding Genetic Variation.PLoS One. 2015 Oct 16;10(10):e0140758. doi: 10.1371/journal.pone.0140758. eCollection 2015. PLoS One. 2015. PMID: 26474488 Free PMC article. Review.
Cited by
-
Statistically and functionally fine-mapped blood eQTLs and pQTLs from 1,405 humans reveal distinct regulation patterns and disease relevance.Nat Genet. 2024 Oct;56(10):2054-2067. doi: 10.1038/s41588-024-01896-3. Epub 2024 Sep 24. Nat Genet. 2024. PMID: 39317738 Free PMC article.
-
Discovery of target genes and pathways at GWAS loci by pooled single-cell CRISPR screens.Science. 2023 May 19;380(6646):eadh7699. doi: 10.1126/science.adh7699. Epub 2023 May 19. Science. 2023. PMID: 37141313 Free PMC article.
-
Prediction of causal genes at GWAS loci with pleiotropic gene regulatory effects using sets of correlated instrumental variables.PLoS Genet. 2024 Nov 11;20(11):e1011473. doi: 10.1371/journal.pgen.1011473. eCollection 2024 Nov. PLoS Genet. 2024. PMID: 39527631 Free PMC article.
-
Proteome-wide mendelian randomization identifies therapeutic targets for nephrolithiasis.Urolithiasis. 2024 Sep 6;52(1):126. doi: 10.1007/s00240-024-01627-7. Urolithiasis. 2024. PMID: 39237840
-
Mendelian randomization as a tool to inform drug development using human genetics.Camb Prism Precis Med. 2023 Feb 8;1:e16. doi: 10.1017/pcm.2023.5. eCollection 2023. Camb Prism Precis Med. 2023. PMID: 38550933 Free PMC article. Review.
References
MeSH terms
Substances
LinkOut - more resources
Full Text Sources
