

Prevalence and sociodemographic correlates of physical activity and sitting time among South American adolescents: a harmonized analysis of nationally representative cross-sectional surveys
- PMID: 35527268
- PMCID: PMC9080195
- DOI: 10.1186/s12966-022-01291-3
Prevalence and sociodemographic correlates of physical activity and sitting time among South American adolescents: a harmonized analysis of nationally representative cross-sectional surveys
Abstract
Background: To identify the prevalence and sociodemographic correlates of different domains of physical activity (PA) and higher sitting time among South American adolescents.
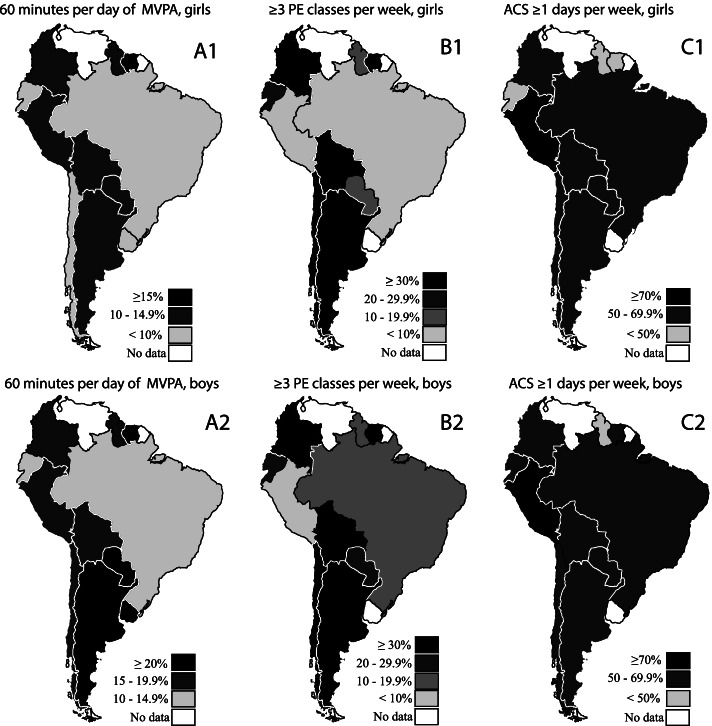
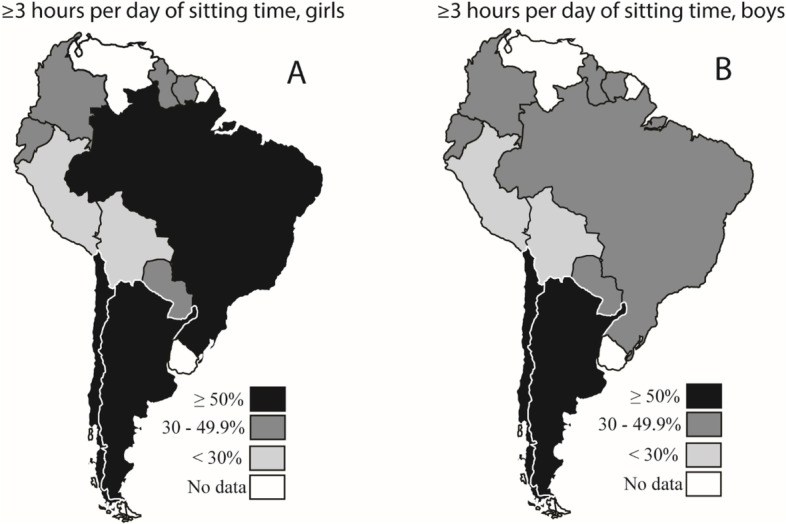
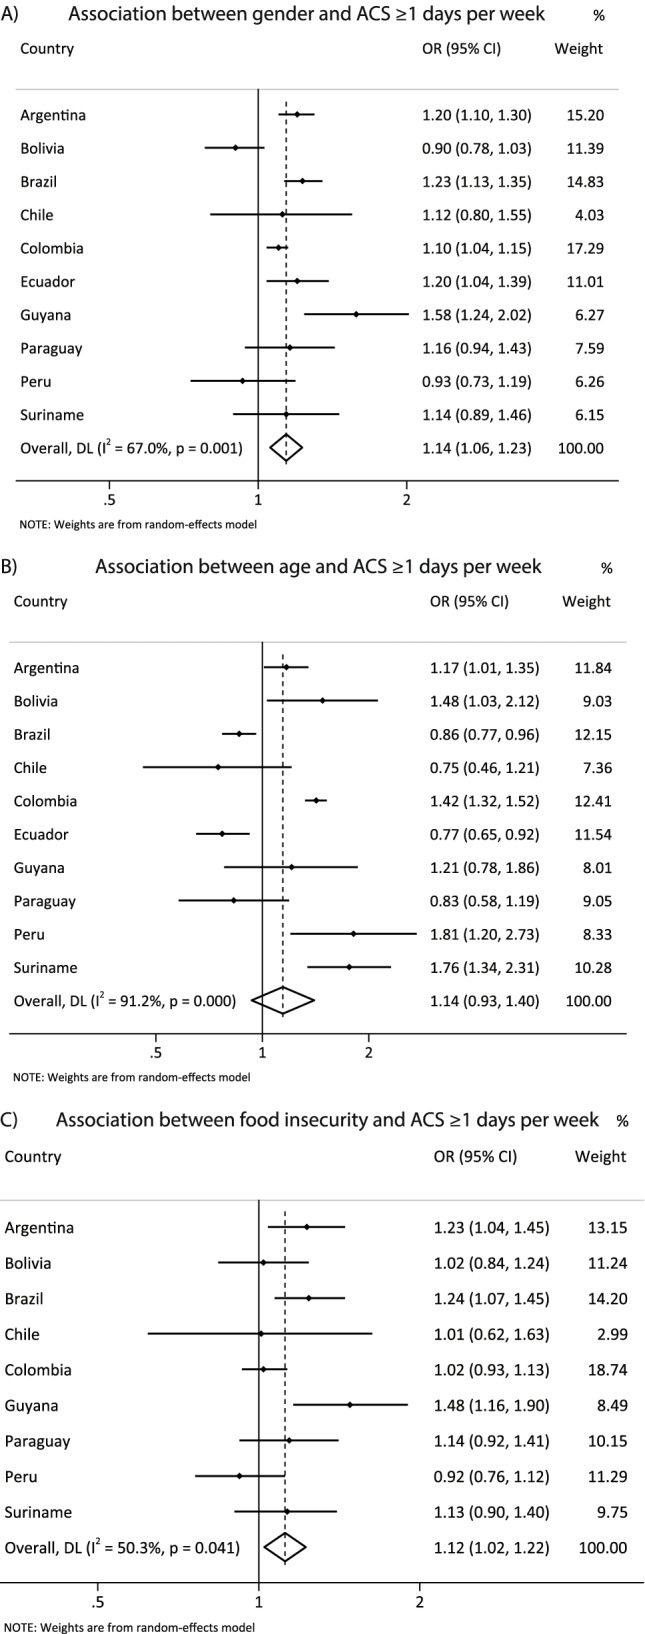
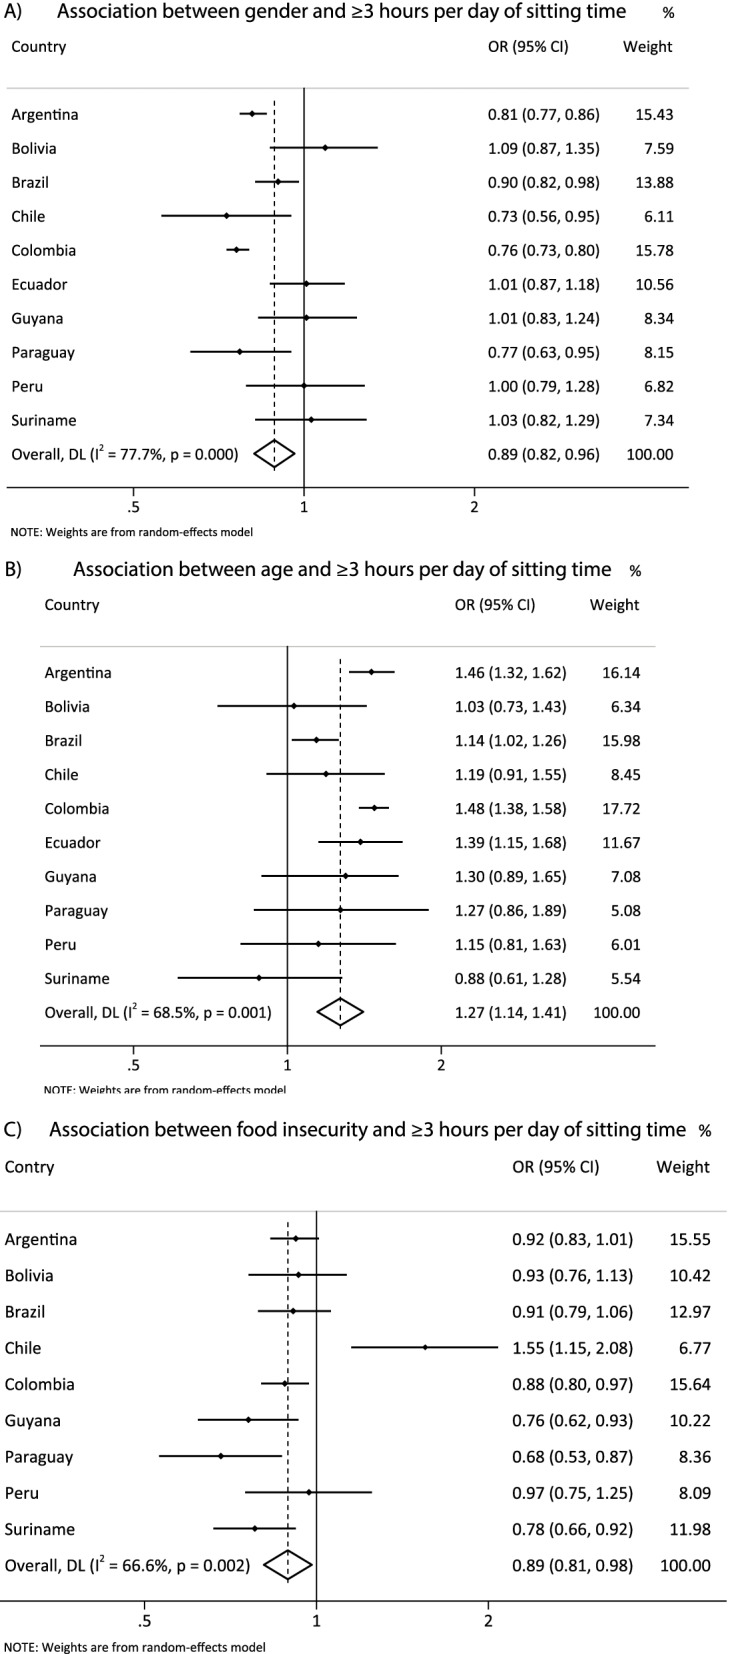
Methods: Data from national surveys of 11 South American countries were analyzed, and comprised information on 166,901 adolescents. PA (≥ 60 min/day of moderate-vigorous PA), physical education classes (PEC) (≥ 3 classes/wk), active commuting to school (≥ 1 d/wk), and higher sitting time (≥ 3 h/d) were self-reported. Sociodemographic correlates, such as gender, age, and food security status were explored using a random effect meta-analysis for logistic parameters.
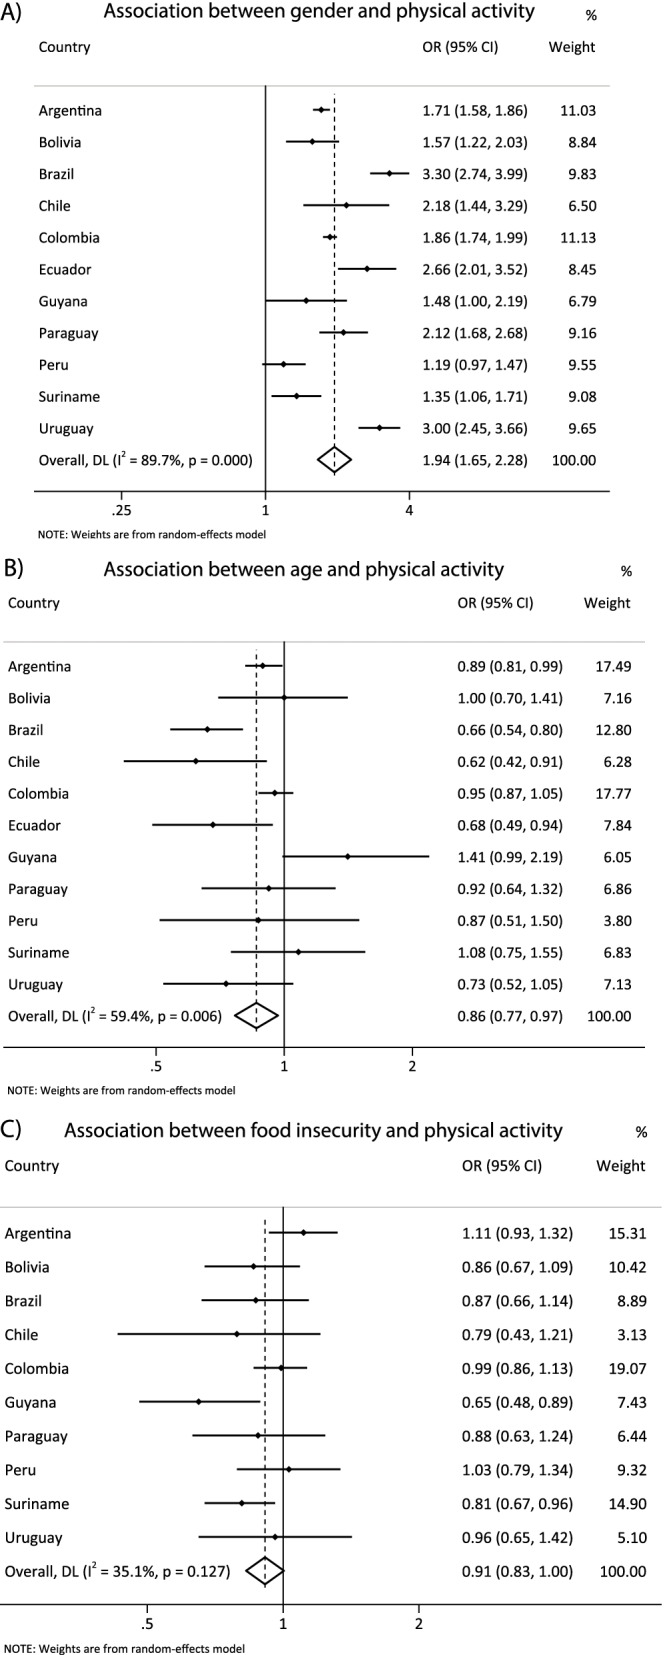
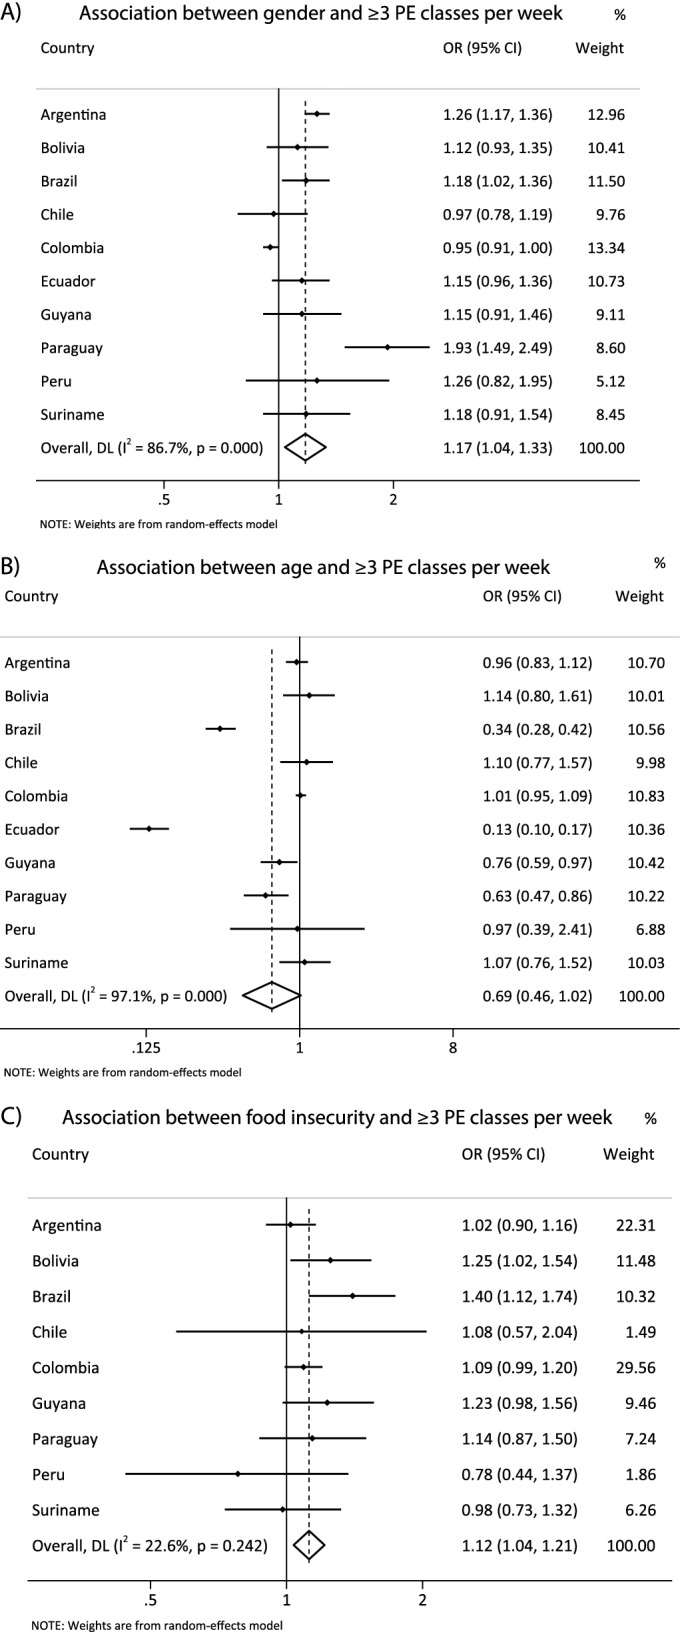
Results: Recommended PA ranged between 7.5% (Brazil) and 19.0% (Suriname). Peru (2.2%) and Guyana (43.1%) presented the lowest prevalence of PEC and active commuting to school, respectively. Higher sitting time was less prevalent in Bolivia (24.6%) and more prevalent in Argentina (55.6%). Compared to girls, boys were more prone to reach recommendations for PA [OR = 1.94(1.65;2.28)]; to reach ≥ 3 PEC [OR = 1.17(1.04;1.33)] and to be active in commuting to school [(OR = 1.14(1.06;1.23)], but less prone to higher sitting time [OR = 0.89(0.82;0.96)]. Older adolescents had less odds of reach PA guidelines [OR = 0.86(0.77; 0.97)] and accumulated higher sitting time [OR = 1.27(1.14;1.41)]. Adolescents with food insecurity reported more PEC [OR = 1.12(1.04;1.21)] and active commuting to school [OR = 1.12(1.02;1.22)] but had less higher sitting time than their food security pairs [OR = 0.89(0.81;0.98)].
Conclusions: Few adolescents reach the PA recommendation. Actions aiming the promotion of PA and the reduction of sitting time must consider girls and older adolescents as target groups, as well as the specifics of each country.
Keywords: Adolescence; Physical activity; Sedentary behavior; South America; Transportation.
© 2022. The Author(s).
Conflict of interest statement
The authors declare that they have no competing interests.
Figures
Similar articles
-
Physical activity and sedentary behavior patterns and sociodemographic correlates in 116,982 adults from six South American countries: the South American physical activity and sedentary behavior network (SAPASEN).Int J Behav Nutr Phys Act. 2019 Aug 20;16(1):68. doi: 10.1186/s12966-019-0839-9. Int J Behav Nutr Phys Act. 2019. PMID: 31429772 Free PMC article.
-
Participation frequency in physical education classes and physical activity and sitting time in Brazilian adolescents.PLoS One. 2019 Mar 13;14(3):e0213785. doi: 10.1371/journal.pone.0213785. eCollection 2019. PLoS One. 2019. PMID: 30865705 Free PMC article.
-
Physical Activity and Sitting Time Patterns and Sociodemographic Correlates Among 155,790 South American Adults.J Phys Act Health. 2023 May 9;20(8):716-726. doi: 10.1123/jpah.2022-0305. Print 2023 Aug 1. J Phys Act Health. 2023. PMID: 37160287
-
Global prevalence of physical activity for children and adolescents; inconsistencies, research gaps, and recommendations: a narrative review.Int J Behav Nutr Phys Act. 2021 Jun 29;18(1):81. doi: 10.1186/s12966-021-01155-2. Int J Behav Nutr Phys Act. 2021. PMID: 34187486 Free PMC article. Review.
-
Developing a policy brief on physical activity promotion for children and adolescents.Front Public Health. 2023 Sep 22;11:1215746. doi: 10.3389/fpubh.2023.1215746. eCollection 2023. Front Public Health. 2023. PMID: 37841728 Free PMC article. Review.
Cited by
-
Sociodemographic Inequalities in Physical Activity in Latin America: Time for Policies Targeted at Groups that Need it the Most.Int J Public Health. 2022 Nov 10;67:1605125. doi: 10.3389/ijph.2022.1605125. eCollection 2022. Int J Public Health. 2022. PMID: 36439275 Free PMC article. No abstract available.
-
Association between the practice of fitness-related exercises and body image dissatisfaction in adolescents from Curitiba (PR), Brazil.Rev Paul Pediatr. 2024 Sep 6;43:e2023221. doi: 10.1590/1984-0462/2025/43/2023221. eCollection 2024. Rev Paul Pediatr. 2024. PMID: 39258665 Free PMC article.
-
Global prevalence and gender inequalities in at least 60 min of self-reported moderate-to-vigorous physical activity 1 or more days per week: An analysis with 707,616 adolescents.J Sport Health Sci. 2024 Sep;13(5):709-716. doi: 10.1016/j.jshs.2023.10.011. Epub 2023 Nov 3. J Sport Health Sci. 2024. PMID: 37923057 Free PMC article.
-
Cross-Sectional Associations between Playing Sports or Electronic Games in Leisure Time and Life Satisfaction in 12-Year-Old Children from the European Union.Eur J Investig Health Psychol Educ. 2022 Aug 13;12(8):1050-1066. doi: 10.3390/ejihpe12080075. Eur J Investig Health Psychol Educ. 2022. PMID: 36005224 Free PMC article.
-
Household food insecurity and physical activity behaviour in Ecuadorian children and adolescents: findings from the Ecuador 2018 National Health and Nutrition Survey (ENSANUT-2018).Public Health Nutr. 2024 Feb 2;27(1):e67. doi: 10.1017/S1368980024000351. Public Health Nutr. 2024. PMID: 38305098 Free PMC article.
References
-
- Barker AR, Gracia-Marco L, Ruiz JR, Castillo MJ, Aparicio-Ugarriza R, González-Gross M, et al. Physical activity, sedentary time, TV viewing, physical fitness and cardiovascular disease risk in adolescents: the HELENA study. Int J Cardiol. 2018;254:303–309. doi: 10.1016/j.ijcard.2017.11.080. - DOI - PubMed
-
- Khan A, Lee E-Y, Rosenbaum S, Khan SR, Tremblay MS. Dose-dependent and joint associations between screen time, physical activity, and mental wellbeing in adolescents: an international observational study. Lancet Child Adolesc Heal. 2021;5(10):729–738. doi: 10.1016/S2352-4642(21)00200-5. - DOI - PubMed
-
- Hillman CH, Erickson KI, Hatfield BD. Run for your life! childhood physical activity effects on brain and cognition. Kinesiol Rev. 2017;6:12–21. doi: 10.1123/kr.2016-0034. - DOI
Publication types
MeSH terms
LinkOut - more resources
Full Text Sources
Medical
