. 2022 Aug;42(6):1205-1222.
doi: 10.1007/s10875-022-01279-5. Epub 2022 May 9.

T and NK Cells in IL2RG-Deficient Patient 50 Years After Hematopoietic Stem Cell Transplantation

Affiliations

T and NK Cells in IL2RG-Deficient Patient 50 Years After Hematopoietic Stem Cell Transplantation

Janine E Melsen et al. J Clin Immunol. 2022 Aug.

Abstract

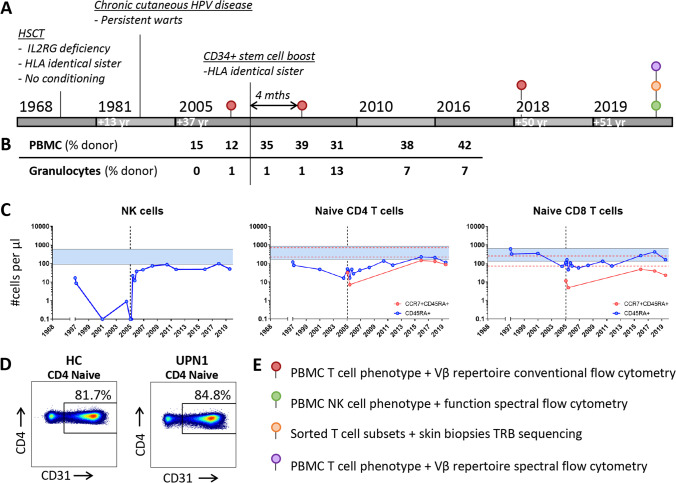
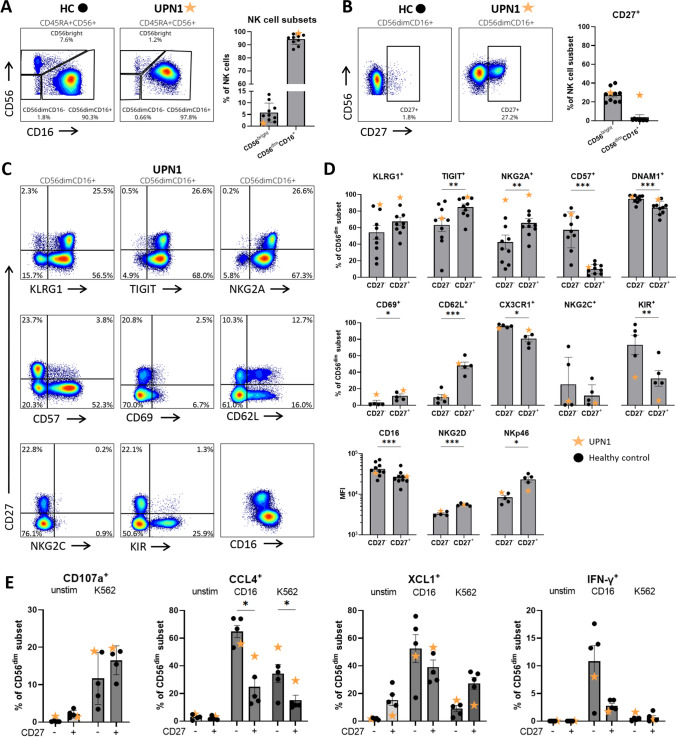
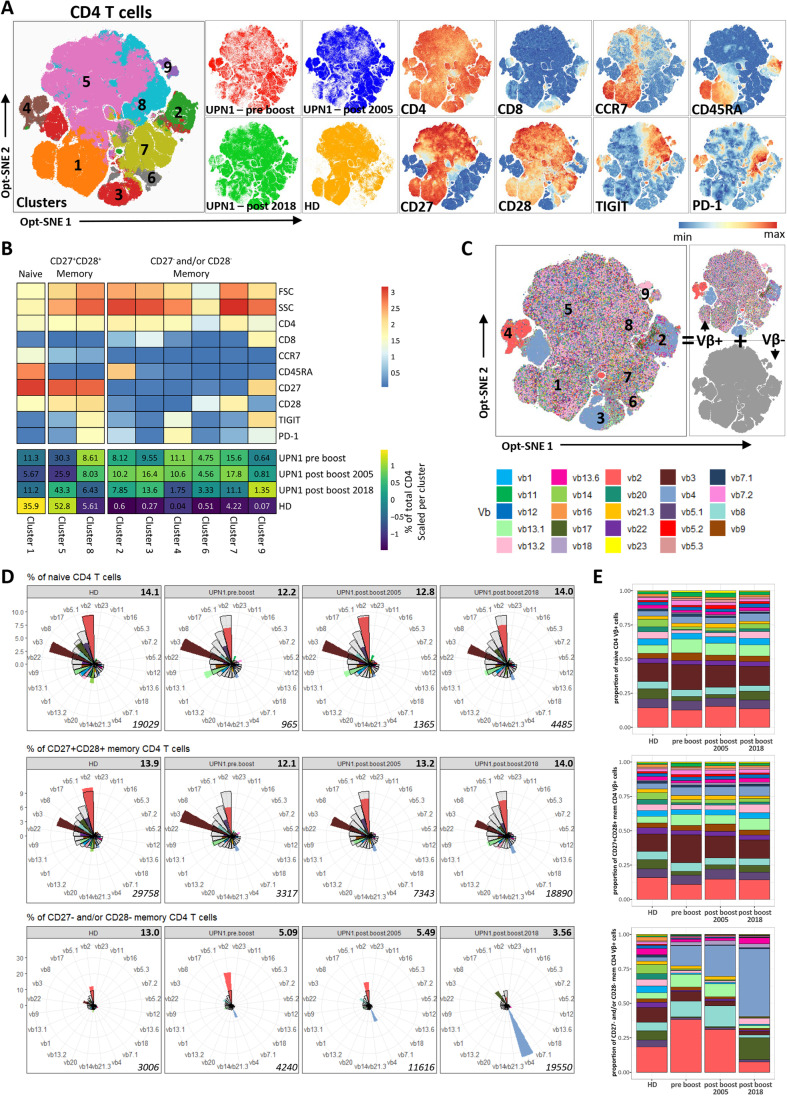
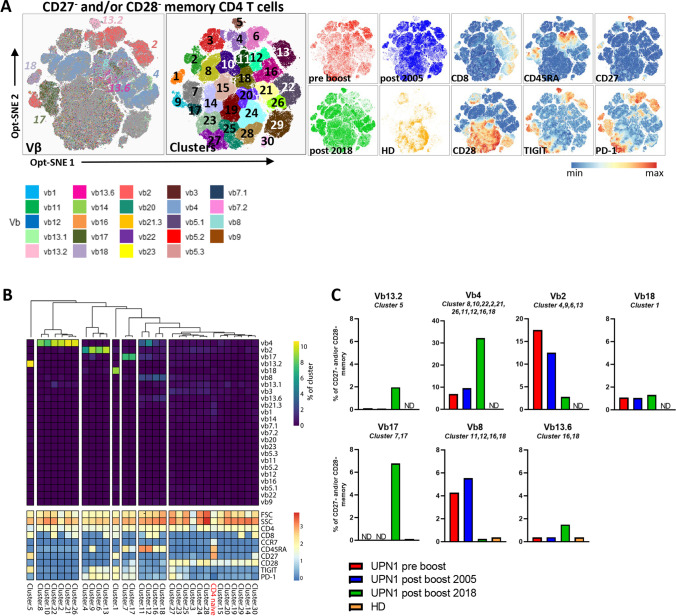
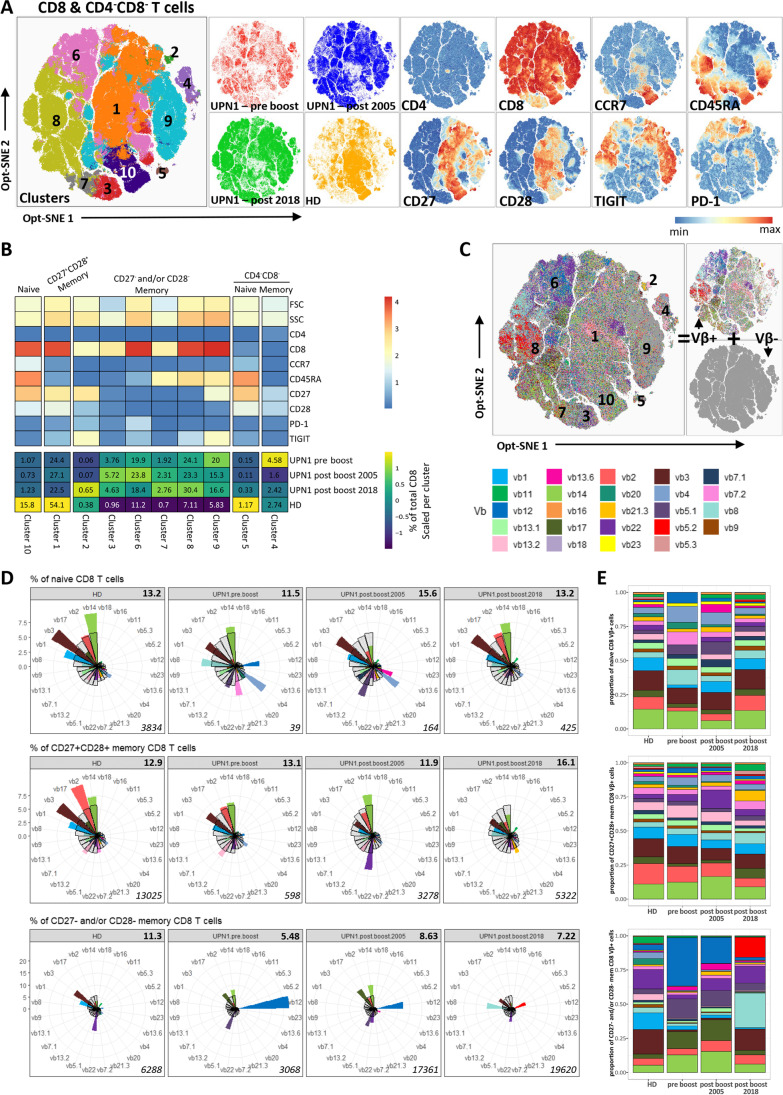
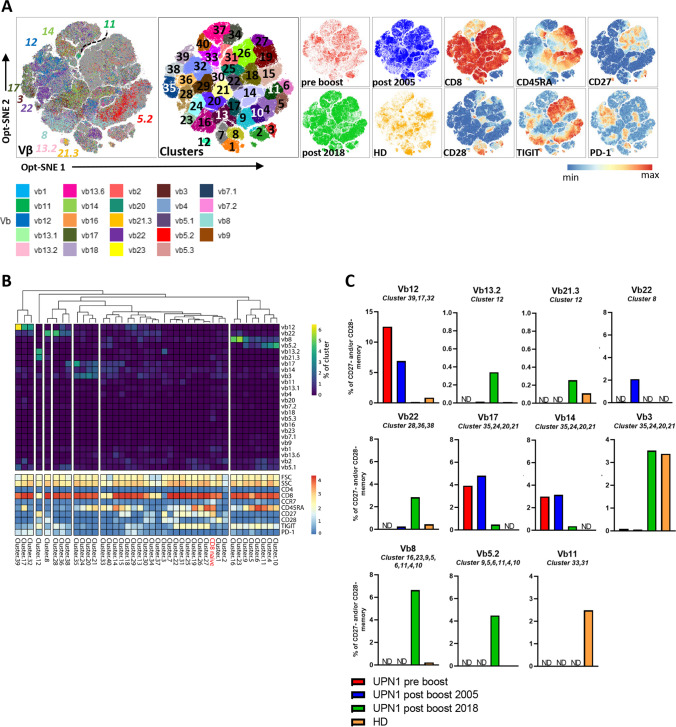
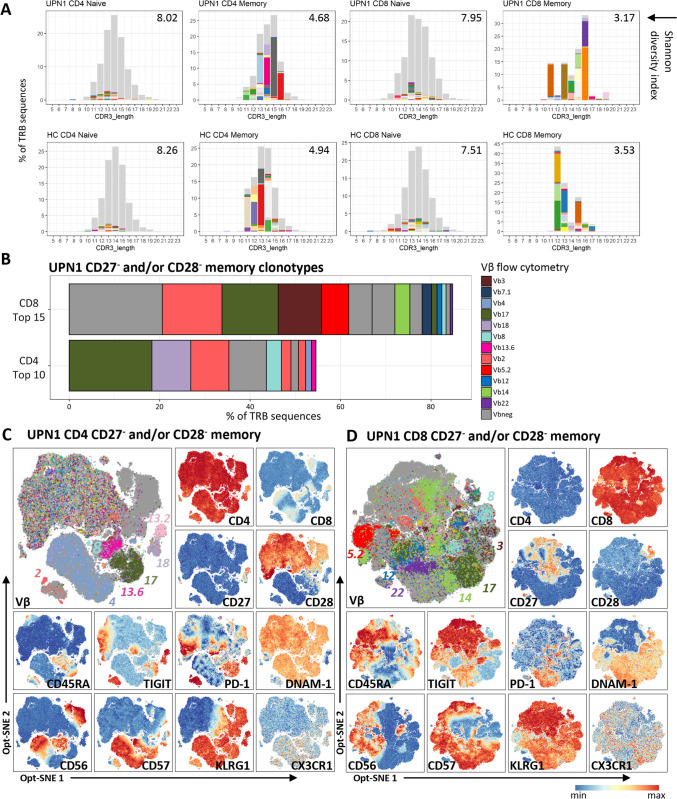
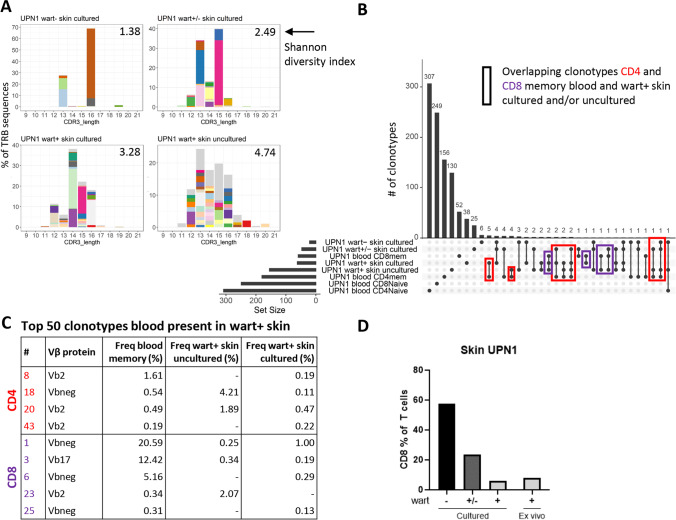
The first successful European hematopoietic stem cell transplantation (HSCT) was performed in 1968 as treatment in a newborn with IL2RG deficiency using an HLA-identical sibling donor. Because of declining naive T and natural killer (NK) cells, and persistent human papilloma virus (HPV)-induced warts, the patient received a peripheral stem cell boost at the age of 37 years. NK and T cells were assessed before and up to 14 years after the boost by flow cytometry. The boost induced renewed reconstitution of functional NK cells that were 14 years later enriched for CD56dimCD27+ NK cells. T-cell phenotype and T-cell receptor (TCR) repertoire were simultaneously analyzed by including TCR Vβ antibodies in the cytometry panel. Naive T-cell numbers with a diverse TCR Vβ repertoire were increased by the boost. Before and after the boost, clonal expansions with a homogeneous TIGIT and PD-1 phenotype were identified in the CD27- and/or CD28- memory population in the patient, but not in the donor. TRB sequencing was applied on sorted T-cell subsets from blood and on T cells from skin biopsies. Abundant circulating CD8 memory clonotypes with a chronic virus-associated CD57+KLRG1+CX3CR1+ phenotype were also present in warts, but not in healthy skin of the patient, suggesting a link with HPV. In conclusion, we demonstrate in this IL2RG-deficient patient functional NK cells, a diverse and lasting naive T-cell compartment, supported by a stem cell boost, and an oligoclonal memory compartment half a century after HSCT.

Keywords: Severe combined immune deficiency; T cells; T-cell receptor repertoire; hematopoietic stem cell transplantation; natural killer cells.


Conflict of interest statement

The authors declare no competing interests.

Figures

Fig. 1
Fig. 1
Clinical overview UPN1 and study design. A) Timeline indicates the hematopoietic stem cell transplantation (HSCT) in 1968, the onset of HPV disease and the CD34+-enriched peripheral stem cell boost in 2005. B) The donor chimerism of PBMC and granulocytes at different timepoints. C) The reconstitution of different lymphocyte subsets following HSCT and the boost (vertical dotted line). Naive T cells were either defined as CD45RA+ (blue) or CCR7+CD45RA+ (red). The horizontal lines represent the reference range of adult healthy donors. D) The CD31 expression on naive (CCR7+CD45RA+) CD4 T cells (surrogate marker of CD4 recent thymic emigrants) of an age-matched healthy control and UPN1 (51 years post-HSCT), as determined by flow cytometry. E) In this study, we assessed NK cell phenotype and function by spectral cytometry, and T-cell phenotype and repertoire by cytometry and TRB sequencing. The samples of UPN1 used for these analyses are indicated in A.
Fig. 2
Fig. 2
Enrichment of CD56dimCD27+ NK cells in functional circulating NK cell compartment. A) The density plots depict NK cells of a representative healthy control (HC) and UNP1 (14 years after the boost). The bar graphs indicate the frequency of CD56bright and CD56dimCD16+ NK cells in blood of UPN1 (orange star) versus healthy controls (black dots, n = 9). B) The CD27 expression on the two NK cell subsets in healthy controls (n = 9) and UPN1. C) The CD56dimCD16+ NK cells were grouped into a CD27 and CD27+ subset. The expression of multiple surface molecules on these subsets of UPN1 is depicted. D) Quantitative analysis of the expression of the surface molecules on NK cells of healthy controls (black dot, n = 4–9) versus UPN1 (orange star). E) NK cells from healthy controls (n = 4) and UPN1 were stimulated with K562 cells for 4 h to study degranulation (CD107a). Intracellular chemokine (CCL4, XCL1) and cytokine (IFN-γ) production was measured after stimulation by anti-CD16 (4 h) or K562 cells (overnight). Bar graphs in A, B, D and E indicate mean and standard error of the mean. One-way repeated measures ANOVA was applied to test for statistical differences between CD27 and CD27+ NK cells. *p < 0.05, **p < 0.005, ***p < 0.001
Fig. 3
Fig. 3
Clustering and Vβ frequencies of CD4 T cells. A) The clusters within the CD4 T-cell compartment, as determined by FlowSOM, are projected onto the opt-SNE embedding. The expression of each individual parameter is shown. No downsampling between samples was performed. B) The heatmap indicates the median expression value for each parameter per cluster. In addition, the frequencies of the different clusters in the four samples are depicted. C) After clustering, each cell was colored by its Vβ expression, which was previously determined by gating. D) Clusters were grouped into three groups: naive CD4 T cells (cluster 1), CD27+CD28+ memory CD4 T cells (clusters 5 and 8) and CD27 and/or CD28 memory CD4 T cells (clusters 2–4, 6, 7 and 9). The frequency of each individual Vβ was calculated as % of total T cells in the relevant tube and is shown per sample in a polar plot. The color indicates the frequency as measured within the sample, and the blanc bars indicate the mean reference values as determined among total CD4 T cells. The numbers at the right top and bottom represent the inverse Simpson index and total number of Vβ+ cells, respectively. E) The proportion of each individual Vβ among all Vβ+ cells is visualized per sample and subset.
Fig. 4
Fig. 4
Skewed Vβ distribution within CD27 and/or CD28 memory CD4 T cells. A) An opt-SNE embedding is shown of CD27 and/or CD28 memory CD4 T cells with each cell colored by its Vβ expression, clustering, or parameter intensity. Clustering was based on opt-SNE coordinates. No downsampling was performed between samples. B) For each individual cluster, the Vβ frequency (of total cells in cluster) and the phenotype are visualized in a heatmap. From the UPN1 post-boost 2018 sample, the Vβ frequencies of the naive CD4 T-cell cluster as shown in Fig. 3A-C are added as reference. C) For each dominant Vβ family, the total frequency was calculated by the sum of the Vβ+ events of the indicated clusters divided by the sum of CD27 and/or CD28 memory CD4 T cells of the tube in which the particular Vβ antibody was included. ND = not detected
Fig. 5
Fig. 5
Clustering and Vβ frequencies of CD8 T cells. A) The clusters within the CD8 T-cell compartment, as determined by FlowSOM, are projected onto the opt-SNE embedding. The expression of each individual parameter is shown. No downsampling was performed between samples. B) The heatmap indicates the median expression value for each parameter per cluster. In addition, the frequencies of the different clusters in the four samples are depicted. C) After clustering, we colored each cell by its Vβ expression, which was previously determined by gating. D) Clusters were grouped into five groups: naive CD8 T cells (cluster 10), CD27+CD28+ memory CD8 T cells (cluster 1), CD27 and/or CD28 memory CD8 T cells (clusters 2,3,6,7,8,9), naive CD4CD8 T cells (cluster 5) and memory CD4CD8 T cells. A minor fraction of CD28 cells in cluster 1 was manually removed. The frequency of each individual Vβ was calculated as % of total T cells in the relevant tube and is shown per sample in a polar plot. The color indicates the frequency as measured within the sample. The blanc bars indicate the mean reference values as determined among total CD8 T cells. The numbers at the right top and bottom represent the inverse Simpson index and total number of Vβ+ cells, respectively. E) The proportion of each individual Vβ among all Vβ+ cells is visualized per sample and subset.
Fig. 6
Fig. 6
Skewed Vβ distribution within CD27 and/or CD28 memory CD8 T cells. A) An opt-SNE embedding is shown of CD27 and/or CD28 memory CD8 T cells with each cell colored by its Vβ expression, clustering, or parameter intensity. Clustering was based on opt-SNE coordinates. Between the samples, no downsampling was performed. B) For each individual cluster, the Vβ frequency (of total cells in cluster) and the phenotype are indicated in the heatmap. From the UPN1 post-boost 2018 sample, the Vβ frequencies of the naive CD8 T-cell cluster as shown in Fig. 5A-C are added as reference. C) For each dominant Vβ family, the total frequency was calculated by the sum of the Vβ+ events of the indicated clusters divided by the sum of CD27 and/or CD28 memory CD8 T cells of the tube in which the particular Vβ antibody was included. ND = not detected
Fig. 7
Fig. 7
TRB sequencing of sorted blood T-cell subsets confirms clonality of expansions identified by flow cytometry. TRB sequencing of four peripheral blood T-cell subsets from UPN1 and an age-matched healthy control (HC) was performed: naive CD4, naive CD8, CD27 and/or CD28 memory CD4, and CD27 and/or CD28 memory CD8 T cells (Figure S1). A) The distribution of clonotypes based on CDR3 length is visualized with the top 50 most frequent clonotypes colored. The Shannon diversity index is shown at the right upper corner. B) The top ten most frequent clonotypes of the CD4 CD27 and/or CD28 memory T cells and the top 15 clonotypes of the CD8 CD27 and/or CD28 memory T cells are colored by their Vβ expression, with the same colors as applied for the flow cytometry analysis. Vbneg indicates a Vβ that was not detected by the antibodies included in the cytometry panel. C) Spectral cytometry was applied to provide a more detailed phenotype of the clonal expansions. Shown is an opt-SNE embedding based on the backbone panel of markers (except CD3) of the CD27 and/or CD28 memory CD4 T cells and D) the CD27 and/or CD28 memory CD8 T cells. The expression of Vβ and a selection of markers are shown.
Fig. 8
Fig. 8
Abundant CD8 memory clonotypes in blood are present in HPV2-induced warts. A) TRB sequencing was performed on total T cells isolated from warts or total T cells isolated and expanded from wart+ skin, wart± skin, or wart skin of UPN1. The frequencies of clonotypes based on CDR3 length are shown. The top 50 most frequent clonotypes are colored. The Shannon diversity index is shown at the right upper corner. B) The overlap of clonotypes among samples is shown. Only clonotypes with at least 50 reads were included. We focused on the clonotypes present in both CD4 memory (CD27 and/or CD28) from blood and uncultured or cultured T cells from wart+ skin (indicated by red, in total 17). The same strategy was applied for the memory CD27 and/or CD28 CD8 T cells (indicated in purple, in total 5). C) Of those overlapping sequences, we selected the ones present in the top 50 of most frequent clonotypes in the CD4 or CD8 memory compartment. The number indicates the ranking in the top 50. Vbneg indicates a Vβ that was not detected by the antibodies included in the cytometry panel. D) The percentage of CD8+ T cells in the skin samples of UPN1.

References

    1. Van Rood JJ, Eernisse JG, Van Leeuwen A. Leucocyte Antibodies in Sera from Pregnant Women. Nature. 1958;181:1735–1736. doi: 10.1038/1811735a0. - DOI - PubMed
    1. Van RJJ, Van LA. Leukocyte grouping. A method and its application*. J Clin Invest. 1963;42:1382–1390. doi: 10.1172/JCI104822. - DOI - PMC - PubMed
    1. Gatti R, Meuwissen H, Allen H, Hong R, Good R. Immunological reconstitution of sex-linked lymphopenic immunological deficiency. Lancet. 1968;292:1366–1369. doi: 10.1016/S0140-6736(68)92673-1. - DOI - PubMed
    1. De Koning J, Van Bekkum DW, Dicke KA, Dooren LJ, Rádl J, Van Rood JJ. Transplantation of bone-marrow cells and fetal thymus in an infant with lymphopenic immunological deficiency. Lancet. 1969;1:1223–1227. doi: 10.1016/S0140-6736(69)92112-6. - DOI - PubMed
    1. Kovanen PE, Leonard WJ. Cytokines and immunodeficiency diseases: critical roles of the gammac-dependent cytokines interleukins 2, 4, 7, 9, 15, and 21, and their signaling pathways. Immunol Rev. 2004;202:67–83. doi: 10.1111/j.0105-2896.2004.00203.x. - DOI - PubMed

Publication types

Substances