The splicing-regulatory lncRNA NTRAS sustains vascular integrity
- PMID: 35527520
- PMCID: PMC9171682
- DOI: 10.15252/embr.202154157
The splicing-regulatory lncRNA NTRAS sustains vascular integrity
Abstract
Vascular integrity is essential for organ homeostasis to prevent edema formation and infiltration of inflammatory cells. Long non-coding RNAs (lncRNAs) are important regulators of gene expression and often expressed in a cell type-specific manner. By screening for endothelial-enriched lncRNAs, we identified the undescribed lncRNA NTRAS to control endothelial cell functions. Silencing of NTRAS induces endothelial cell dysfunction in vitro and increases vascular permeability and lethality in mice. Biochemical analysis revealed that NTRAS, through its CA-dinucleotide repeat motif, sequesters the splicing regulator hnRNPL to control alternative splicing of tight junction protein 1 (TJP1; also named zona occludens 1, ZO-1) pre-mRNA. Deletion of the hnRNPL binding motif in mice (Ntras∆CA/∆CA ) significantly repressed TJP1 exon 20 usage, favoring expression of the TJP1α- isoform, which augments permeability of the endothelial monolayer. Ntras∆CA/∆CA mice further showed reduced retinal vessel growth and increased vascular permeability and myocarditis. In summary, this study demonstrates that NTRAS is an essential gatekeeper of vascular integrity.
Keywords: alternative splicing; long non-coding RNA; tight junctions; vascular integrity.
© 2022 The Authors. Published under the terms of the CC BY 4.0 license.
Figures

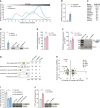
Illustration of the human NTRAS and GAPDH loci. Displayed are UCSC genome browser snapshots of ribosome profiling GWIPs‐viz ribose tracks.
Schematic representation of NTRAS transcript variants identified by RT–PCR and 5’ RACE–PCR in HUVECs (n = 1).
IGV screen shot showing NTRAS expression levels in HUVECs under normoxic (N) and hypoxic (H; 0.2% O2 for 12 h or 24 h) conditions (n = 2 independent biological replicates).
Digital PCR‐based analysis of NTRAS copy numbers per µg of total RNA in HUVECs under normoxic (N) and hypoxic (H) conditions (n = 3 independent biological replicates).
RT–qPCR‐based analysis of VEGFA expression, controlling for hypoxia (n = 4 independent biological replicates).
Subcellular localization of NTRAS in normoxic (N) and hypoxic (H) HUVECs, assayed by cellular fractionation and RT–qPCR (n = 3 independent biological replicates).
RNAscope‐based detection of NTRAS in HUVECs under normoxic and hypoxic conditions (n = 1). Binding sites of the probes are indicated.
Validation of NTRAS silencing in HUVECs by RT–qPCR, comparing two different LNAs (n = 4 independent biological replicates).
Cell cycle analysis in control and NTRAS‐silenced HUVECs (n = 3 independent biological replicates).
Representative images of in vitro sprouting comparing control and NTRAS‐silenced HUVECs under basal conditions and VEGFA stimulation (n = 3–10 independent biological replicates). Scale bars are 50 µm.
Illustration of the human and murine NTRAS loci (GRCh38.p13: RP11‐354k1.1; GRCm38/mm10: 1700034H15).
Validation of Ntras silencing in murine H5V cells by RT‐qPCR (n = 3 independent biological replicates).
RT–qPCR‐based analysis of Ntras expression in hearts of control and Ntras‐silenced mice (n = 19–23 mice per group).
FTSC‐based in vivo permeability assays, comparing heart homogenates from control and Ntras‐silenced mice. Data normalized to organ and body weight (n = 11–12 mice per group). Experimental outline on the left.

Murine Ntras enrichment in endothelial cells versus other heart‐derived cell types (data acquired from GSE95755; Quaife‐Ryan et al, 2017) (n = 4 mice).
Changes in lncRNA expression from HUVECs exposed to hypoxia (0.2% O2 for 12 h or 24 h), determined by ribo‐minus RNA deep sequencing (data acquired from GSE107033; Neumann et al, 2018); NTRAS is highlighted (n = 2 independent biological replicates).
Validation of hypoxia‐induced NTRAS expression at the indicated time points by RT–qPCR (n = 4 independent biological replicates).
Subcellular localization of NTRAS and control transcripts, assayed by nuclear‐cytoplasmic fractionation of HUVECs and RT–qPCR (n = 3 independent biological replicates).
FITC‐dextran‐based in vitro permeability comparing control and NTRAS‐silenced HUVECs (n = 5 independent biological replicates).
Cumulative in vitro sprout lengths of control and NTRAS‐silenced HUVECs under basal conditions and VEGFA stimulation (n = 3–10 independent biological replicates).
Cell cycle analysis in Ntras‐silenced H5V cells (n = 3 independent biological replicates).
TMR‐dextran‐based assessment of vascular permeability in vivo, comparing heart homogenates from control and Ntras‐silenced mice. Data normalized to organ and body weight (n = 11–12 mice per group). Experimental outline on the left.
Survival of control and Ntras‐silenced mice under basal conditions (black, n = 21–23 mice per group) and in hind limb ischemia (HLI; red, n = 8 mice per group). Number of survivors is indicated; experimental outline on the left.

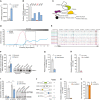
Separation of mock and proteinase K‐treated HeLa nuclear extracts by sucrose density gradient ultracentrifugation followed by NTRAS detection using RT–qPCR. Fractions 1 and 14 represent top and bottom of the gradient, respectively (n = 1).
Enrichment of NTRAS by antisense affinity selection from HeLa cell lysate followed by RT–qPCR, comparing a control and an NTRAS‐specific probe (n = 5 independent biological replicates).
Top ten enriched proteins from NTRAS affinity selections, identified by mass spectrometry (n = 5 independent biological replicates).
RT–qPCR‐based validation of NTRAS–hnRNPL interaction by anti‐hnRNPL RIPs from HUVEC nuclear fractions (n = 6 independent biological replicates). Representative western blot on the right.
RT–qPCR analysis of NTRAS expression in HUVECs upon silencing of hnRNPL (n = 4 independent biological replicates).
RPLP0‐normalized NTRAS‐CA16 motif expression after hnRNPL silencing determined by RT‐PCR (n = 4 independent biological replicates).
RNA deep sequencing‐based assignment of alternative splicing events in NTRAS‐ or hnRNPL‐silenced HUVECs, using rMATS software. Displayed are changes > 5% (n = 2 independent biological replicates).
NTRAS and hnRNPL co‐regulated alternative splicing (AS) events. Data points with an FDR < 0.05 are circled (n = 2 independent biological replicates).
RT–PCR‐based analysis of TJP1 exon 20 inclusion upon silencing of NTRAS in HUVECs (n = 7 independent biological replicates). Representative agarose gels on the right.
RT–PCR‐based analysis of TJP1 exon 20 inclusion upon silencing of hnRNPL in HUVECs (n = 4 independent biological replicates). Representative agarose gels on the right.

Relative expression of NTRAS in HUVECs and HeLa cells, determined by RT–qPCR (n = 4 independent biological replicates).
RT–qPCR‐based identification of accessible regions within NTRAS using RNase H‐mediated cleavage of RNA–DNA heteroduplexes (DNA antisense oligonucleotides AS1 to AS5) in HUVEC cell lysate (n = 1). The oligonucleotide used for probe design is highlighted in red.
Scheme illustrating the affinity selection of endogenous NTRAS–protein complexes for RNA and protein analysis.
Sucrose density gradient ultracentrifugation showing the distribution of NTRAS and hnRNPL (protein). The dashed box indicates the fractions with the greatest overlap of both factors (n = 1).
Illustration of the human NTRAS locus. Displayed is NTRAS (GRCh38.p13; RP11‐354k1.1) and RBPmap‐predicted hnRNPL binding motifs, described elsewhere (Smith et al, 2013).
Western blot‐based validation of NTRAS–hnRNPL interaction following antisense affinity selection of NTRAS in nuclear extracts from normoxic and hypoxic HUVECs (n = 4 independent biological replicates).
Expression of NTRAS in control and NTRAS‐silenced HUVECs used for RNA sequencing (n = 4 independent biological replicates).
hnRNPL mRNA levels in control and hnRNPL‐silenced HUVECs used for RNA sequencing (n = 3 independent biological replicates).
RT–PCR‐based analysis of CD55 intron 7 retention following hnRNPL/NTRAS double knockdown in HUVECs (n = 4 independent biological replicates). Representative agarose gel on the right.
rMATs‐based analysis of alternative splicing events upon silencing of lncRNA lncflow2 in HUVECs (n = 4 independent biological replicates) ES: Exon skipping, MXE: Mutually exclusive exons, A5SS: Alternative 5’ splice site, A3SS: Alternative 3’ splice site, RI: Retained intron.
Validation of hnRNPU silencing in HUVECs by RT–qPCR (n = 4 independent biological replicates).
RT–PCR‐based analysis of TJP1 exon 20 inclusion in hnRNPU‐silenced HUVECs (n = 4 independent biological replicates).

RT–qPCR‐based analysis of TJP1 mRNA expression in hnRNPL‐silenced HUVECs (n = 7 independent biological replicates).
Relative expression of BCL2, CASP3, CASP6, and CASP9 mRNA in hnRNPL‐silenced HUVECs (n = 2 independent biological replicates).
RT–qPCR‐based analysis of TJP1 mRNA expression in NTRAS‐silenced HUVECs (n = 4 independent biological replicates).
RT–PCR‐based analysis of Tjp1 exon 20 inclusion in control and Ntras‐silenced murine CMT93 epithelial cells (n = 3 independent biological replicates).
RT–qPCR‐based validation of RNase H‐mediated NTRAS degradation in HeLa nuclear extracts used for in vitro splicing (n = 4 independent biological replicates).
RT–qPCR‐based validation of NTRAS overexpression (n = 4 independent biological replicates).
Co‐precipitation of NTRAS in anti‐hnRNPL RIPs, using nuclear lysates from control and NTRAS‐overexpressing cells (n = 4 independent biological replicates).
RT–PCR‐based validation of NTRAS‐CA16 motif overexpression (n = 6 independent biological replicates). Representative agarose gel on the right.
Quantification of nuclear TJP1, comparing control and NTRAS‐silenced HUVECs (n = 4 independent biological replicates). Representative micrographs are shown. Scale bars are 10 µm.
Analysis of hnRNPL knockdown by western blot 72 h post‐transfection of control or hnRNPL‐targeting siRNAs (n = 4 independent biological replicates). Representative western blots on the right.
In vitro permeability assays using FITC‐dextran, comparing control and hnRNPL‐silenced HUVECs (n = 6 independent biological replicates).
In vitro permeability assays using FITC‐dextran, comparing control and hnRNPU‐silenced HUVECs (n = 4 independent biological replicates).
In vitro permeability assays using FITC‐dextran, comparing control SSO‐ and E20 SSO‐transfected HUVECs (n = 5 independent biological replicates).

Scheme depicting the in vitro splicing of a TJP1 exon 19–exon 20 splice substrate featuring an intronic splicing silencer (ISS). hnRNPL binding sites are highlighted in red.
In vitro splicing efficiency of the TJP1 splice substrate, comparing mock, NTRAS‐depleted, and NTRAS‐CA16 motif add‐back conditions (n = 7–12 independent biological replicates).
Co‐precipitation of TJP1 pre‐mRNA in anti‐hnRNPL RIPs, using nuclear lysates from control and NTRAS‐silenced HUVECs (n = 6 independent biological replicates).
Co‐precipitation of TJP1 pre‐mRNA in anti‐hnRNPL RIPs, using nuclear lysates from control and NTRAS‐overexpressing cells (n = 5 independent biological replicates). Representative western blot on the right.
Co‐precipitation of TJP1 pre‐mRNA in anti‐hnRNPL RIPs, using nuclear lysates from control and NTRAS‐CA16 motif overexpressing cells (n = 5 independent biological replicates). Representative western blot on the right.
RT–PCR‐based analysis of TJP1 exon 20 inclusion upon NTRAS overexpression and overexpression of the NTRAS‐CA16 motif (n = 8 independent biological replicates).
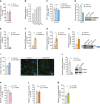
Endothelial resistance of NTRAS‐silenced HUVECs (n = 3–5 independent biological replicates), analyzed by electrical cell‐substrate impedance sensing (ECIS).
Endothelial resistance of hnRNPL‐silenced HUVECs (n = 3 independent biological replicates), analyzed by ECIS.
Analysis of TJP1 exon 20 inclusion by RT–PCR upon transfection of HUVECs with a control SSO or an SSO masking the exon 20–intron 20 boundary (E20 SSO) (n = 9 independent biological replicates). Representative agarose gel on the right. Schematic outline at the top right.
Endothelial resistance of control SSO‐ or E20 SSO‐transfected HUVECs (n = 4 independent biological replicates), analyzed by ECIS.

Validation of Ntras–hnRNPL interaction by anti‐hnRNPL RIPs from H5V lysates, followed by RT–qPCR (n = 4 independent biological replicates). Representative western blot on the right.
RT–PCR‐based analysis of murine Tjp1 exon 20 inclusion in cardiac tissue from control and Ntras‐silenced mice (n = 8 mice per group). Experimental outline on the left.
Illustration of the murine Ntras locus. Displayed are Ntras and Slc30a1 (GRCm38/mm10). The red box highlights the deleted genomic region (~600 bp) in Ntras ∆CA/∆CA mice, comprising the hnRNPL binding motif (~130 bp) and flanking sequences (~440 bp).
Co‐precipitation of Ntras in anti‐hnRNPL RIPs using whole heart lysates from Ntras CA/CA and Ntras ∆CA/∆CA mice (n = 3–4 mice per group). Representative western blot on the right.
RT–PCR‐based analysis of TJP1 exon 20 inclusion in hearts from Ntras CA/CA and Ntras ∆CA/∆CA mice (n = 9–14 mice per group).
Retinal angiogenesis assessed in P7 Ntras CA/CA and Ntras ∆CA/∆CA pups by immunostaining of isolectin B4. Vascularized areas were normalized to total retinal area (n = 4–8 mice per group). Representative micrographs are shown. Scale bars are 200 µm.
FTSC and TMR‐dextran in vivo permeability assays, comparing homogenates of hearts from Ntras CA/CA and Ntras ∆CA/∆CA mice. Data normalized to organ and body weight (n = 11–18 mice per group).
Quantification of CD45+ cell (red) infiltration into cardiac tissue from Ntras CA/CA and Ntras ∆CA/∆CA mice normalized to DAPI. Isolectin B4 (green) was used to label endothelial cells (n = 4–5 mice per group). Representative micrographs are shown. Scale bars are 50 µm. Insets and arrows indicate sites of CD45+ cell infiltration.
Percentage of control and Ntras‐silenced mice showing cardiac pathologies (n = 15–17 mice per group). Prevalence is indicated above the bars. H&E micrographs of murine heart sections from control and Ntras‐silenced mice are shown. Insets and arrows indicate sites of lymphocytic infiltration. Scale bars are 100 µm.

Illustration of the murine Ntras locus. Displayed is Ntras (GRCm38/mm10; 1700034H15) and RBPmap‐predicted hnRNPL binding motifs, described elsewhere (Smith et al, 2013).
Genotyping results confirming the genomic deletion of the hnRNPL binding motif in Ntras ∆CA/∆CA mice.
RT–qPCR‐based analysis of Ntras expression in Ntras CA/CA and Ntras ∆CA/∆CA mice (n = 5–11 mice per group).
Western blot‐based analysis of the NTRAS–hnRNPL interaction following antisense affinity selection of NTRAS in nuclear fractions from NTRAS CA controls and NTRAS ∆CA HeLa cells (n = 3 independent biological replicates). Representative western blot on the right.

References
-
- Bakker RA, Timmerman H, Leurs R (2002) Histamine receptors: Specific ligands, receptor biochemistry, and signal transduction. In Histamine and H1‐Antihistamines in Allergic Disease: Second Edition Revised and Expanded, Estelle F, Simons R (eds), pp 27–64. Boca Raton: CRC Press; - PubMed
-
- Balda MS, Anderson JM (1993) Two classes of tight junctions are revealed by ZO‐1 isoforms. Am J Physiol Cell Physiol 264: C918–C924. - PubMed
-
- Bogatcheva NV, Garcia JG, Verin AD (2002) Molecular mechanisms of thrombin‐induced endothelial cell permeability. Biochemistry (Mosc) 67: 75–84 - PubMed
Publication types
MeSH terms
Substances
LinkOut - more resources
Full Text Sources
Research Materials

